DOI: 10.12928/TELKOMNIKA.v14i1.2385 674
Cluster Analysis for SME Risk Analysis Documents
Based on Pillar K-Means
Irfan Wahyudin*1, Taufik Djatna2, Wisnu Ananta Kusuma3
1,3
Computer Science, Mathematic and Natural Science, Bogor Agricultural University
2
Postgraduate Program in Dept. Agro-industrial Technology, Bogor Agricultural University, Kampus IPB Darmaga P.O. Box 220 Bogor, (62-251)8621974/(62-251)8621974
Tel: (0251) 86228448, Fax: (0251) 8622986
*Corresponding author, e-mail: [email protected], [email protected], [email protected]
Abstract
In Small Medium Enterprise’s (SME) financing risk analysis, the implementation of qualitative model by giving opinion regarding business risk is to overcome the subjectivity in quantitative model. However, there is another problem that the decision makers have difficulity to quantify the risk’s weight that delivered through those opinions. Thus, we focused on three objectives to overcome the problems that oftenly occur in qualitative model implementation. First, we modelled risk clusters using K-Means clustering, optimized by Pillar Algorithm to get the optimum number of clusters. Secondly, we performed risk measurement by calculating term-importance scores using TF-IDF combined with term-sentiment scores based on SentiWordNet 3.0 for Bahasa Indonesia. Eventually, we summarized the result by correlating the featured terms in each cluster with the 5Cs Credit Criteria. The result shows that the model is effective to group and measure the level of the risk and can be used as a basis for the decision makers in approving the loan proposal.
Keywords: risk analysis, SME business, centroid optimazion, K-Means, opinion mining, pillar algorithm, sentiment analysis
Copyright © 2016 Universitas Ahmad Dahlan. All rights reserved.
1. Introduction
Currently, There are two models that are widely used to implement risk assessment in financing, namely a quantitative model and a qualitative model [1]. Risk assesment for SME business in national banks in Indonesia is commonly dominated by the implementation of credit scoring system (quantitative model). Unfortunately, not all of the banks have succesfully implemented these models. This condition is as shown in a national private bank in Indonesia, where the Non Performing Loan (NPL) ratio has an inclining trend in the last three years. This condition drove the top management of the bank to encourage the risk management division to refine the implementation of risk management.
From the observation through the loan assesment’s Standard Operating Procedure (SOP) in the bank where this research is conducted, it is found that the there are some leakages in measuring the acceptance criteria. In fact, the leakages are dominantly found in the credit scoring system, and customer’s financial quality analysis which are part of what we called as quantitative model. In quantitative model, the objectivity is questioned, since it is performed by the marketing staff that stand sides to the customer. Moreover, the data are originated from the customer itself, vulnerable to have a manipulation, especially when the financial statement has no any inspection from the external auditor. Hence, the qualitative model are deployed to overcome these drawbacks, where the analysis is objectively proceed by some risk analysts. However, the implementation of qualitative model is not wholly reliable, which was indicated in the bank’s NPL ratio. The other problem is that the qualitative model was not significantly used by the authorities in making decision since there is no model to quantify the weight of risk’s business that implicitely delivered through opinions. Also, there is no decision criteria that can be used as a baseline in making the decision.
term-importance and sentiment analysis, and (3) To evaluate clustering task and sentiment measurement to reveal the implication with the criteria in assessing the loan risk. The usages of machine learning techniques for credit scoring and risk quantification were successfully proven to be more superior than traditional (statistical) technique [2]. However, those machine learning techniques were still used financial report (numerical data) to compute the credit score, therefore those are vulnerable to manipulation as we mentioned earlier. Thus, using opinion data from risk analysts we suggest a new approach to perform sentiment analysis combined with machine learning to quantify the risk.
Regarding to the techniques used in a sentiment analysis, there are two major techniques commonly used; those are machine learning based and lexicon based [3]. Supervised machine learning techniques that are commonly used are such as Support Vector Machine [4], Neural Networks [5], and Naive Bayes [6]. In addition, for unsupervised machine learning, there are several clustering techniques, let say K-Means [7] and hierarchical clustering [8].
For the lexicon based, there are various lexicon resources that can be utilized as a dictionary to determine the polarity of terms, such as SentiWordNet [9], which is derived from a well known corpus, that is, WordNet, an English dictionary for word synonyms and antonyms. The next one is SentiStrength [10], which is a lexicon based technique, distributed as a desktop application tool that is already combined with several popular supervised and unsupervised classifier algorithms: SVM, J48 classification tree, and Naive Bayes. The other is emoticon based sentiment analysis, which is considered the simplest one [11]. Unfortunately, most of the lexicon dictionaries and corpus resources are designated for English. Some efforts have been done to overcome this shortfall, for instance, by translating either the observed corpus object [12] or the lexicon dictionary [13]. Moreover, sentiment analysis were also can be used to support decision making. Zhang et al., [14] employed sentiment analysis to aggregates network public sentiment emergency decision-making.
Support Vector Decomposition (SVD) for dimension reduction and concept extraction is performed as an initialization followed by a clustering task using K-Means, optimized by centroid initialization namely Pillar Algorithm [15]. A method to measure the term importance from the risk opinion corpus is performed using the widely use TF-IDF, combined with positive-negative polarity measurement using the SentiWordNet 3.0 library [8]. Unlike in English, as of today there is only one international research publication utilizing SWN 3.0 in Bahasa Indonesia that aims to detect sarcasm in social media [13]. The translation problems are overcomed by utilizing tools and techniques such as Google Translate, Kateglo (Kamus Besar Bahasa Indonesia based dictionary), and by asking banking experts for specific banking and finance terms.
2. Research Method
As a case study, we conducted it in one of national private banks in Indonesia where the SME financing is one of their core businesses. We collected about 519 risk analysis documents from the Risk Management division. All of the documents are in Microsoft Words (*.doc an *.docx format), consisting of narrative opinions in Bahasa Indonesia. There are seven opinion points delivered in the documents; those are 1) Credit Scoring 2) Financial Performance 3) Proposed Loan Facility 4) Business Performance 5) Repayment Ability and Cash Flow 6) Legal Analysis, and 7) Foreign Exchange (optional). All of the parts were analyzed based on 5Cs Credit Criteria (Character, Capacity, Capital, Condition, and Collateral).
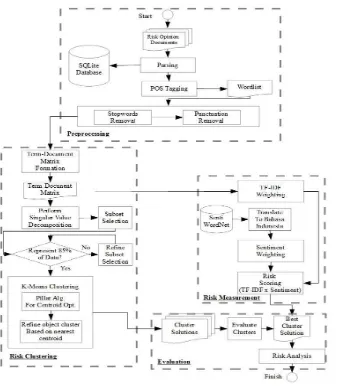
As seen in Figure 1 below, the research framework was divided into 4 parts; those are 1) Preprocessing 2) Risk Clustering 3) Risk Measurement, and 4) Evaluation. We will discuss the details and results in the following section.
2.1. Preprocessing
Figure 1. Research Framework
2.2. K-Means Clustering
K-Means clustering, a widely used centroid based partitioning algorithm, was used in order to find how many risk clusters exist in the corpus. The original proposal of K-Means clustering used random centroid selection in the beginning of iteration. This is not an issue when it computes a small size of datasets. However, dealing with a large size of data could take a lot of time to produce the best centroid selection. Thus, we implement an optimization algorithm, named Pillar Algorithm that proposed to tackles the drawback of K-Means clustering in initiating centroid.
2.3. Singular Value Decomposition
The term-document matrix was considered a high dimensional matrix, so it could take big amount of time to have computation. Thus, the term-document matrix dimension was reduced by using Singular Value Decomposition. The best K-vectors to represent the whole dataset [18] were selected based on formulation (1).
← ∑ / ∑ (1)
2.4. TF-IDF and Sentiment Weighting
, , (2)
For idfi, inverse document frequency for term t in the corpus D is defined as formula (3).
(3)
Where N is the number of document available in corpus, nt is occurrence number of term t in all documents in the corpus. There was a little modification in implementing the formula above. The term in the basic TF-IDF was selected distinctly based only on how the term was spelled, and disregarded the term preposition in sentence. Since the SWN 3.0 was also based on the term preposition, the term position in the term list needed to be added, as obtained in the POS Tagging task1. In sentiment weighting the process simply done by comparing the negative score and the positive score in SWN 3.0 database as defined in logical formulation below. The reason is because the value positive and negative value varied from 0, 0.123, 0.5, 0.625, 0.75, 1, thus we need to define the exact sentiment of a term as seen in Formula (4).
,
, (4)
We combined Term Importance Weighting using TF-IDF and Sentiment Weighting to define risk level in each cluster generated from the Risk Clustering process. The idea was came to find out on how the risk analyst emphasis the usages of terms by calculating its importance using TF-IDF. And the sentiment weighting used to calculate the polarity, whether a term is tend to positive or negative. Hence, the formulation of both calculation for each term described as below in Formula 5, where . , , is TF-IDF score of term t in document d, and s is sentiment score of term t.
. , (5)
3. Results and Analysis 3.1. Preprocessing
Preprocessing is the prerequisite task to remove stop words, punctuation, and unimportant terms, and to formalize the terms used as feature vector for the next task [16]. After scanning the seven parts of the corpus, there were 3289 terms found. From the term collection, there were several things to do such as fixing typos and formalizing the terms. To do so, a mini dictionary was created to be used as a reference for the program.
Furthermore, the formalization was done for some terms like “stratejik””strategi” (strategy), “spekulas””spekulasi” (speculation), “melamah””melemah” (declining). The formalization was also important since some terms could not be found in the SWN 3.0 lexicon, although those are not typos. For instance, terms like “komperehensif” was converted to “komprehensif”; “identity” was converted to “identitas”; “volatility” was converted to “volatilitas”. We also facing problems like translation and finding the proper synonim that can not be found in SWN, those were solved by utilizing tools such as Google Translate, and Kateglo2.
3.2. Reduced Dataset using SVD
A300=U300 Σ300 V300 (6)
3.3. K-Means Clustering and Centroid Optimization using Pillar Algorithm
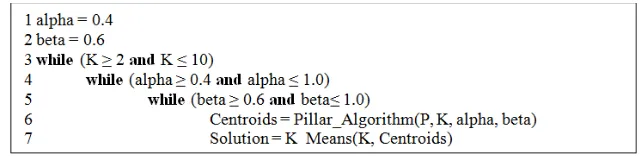
The algorithm was inspired by the function of pillars of a building or a construction. It is common that a pillar in a building is deployed at each edge or at each corner in a building, so that the mass of the building is concentrated in each pillar. The same idea was adopted for the clustering task that the best initial centroids were presumed to exist in the edge of the dataset, or in other words, those k-furthest objects in the dataset were selected as initial centroids, where k is the number of clusters to be observed. Hence, to find the best cluster solution, we iterated some possible numbers of clusters from K=2 to K=10, and each iteration was preceded by centroid optimization using Pillar Algorithm as seen in Figure 3 below.
Figure 3. Pseudocode to find the best cluster solution
Complete steps of original Pillar Algorithm paper are described in Figure 4, where the mean calculation was done for each t variable term, that is, available terms are in the term-document matrix list P, n is the number of document, and m is the mean vector of the term. After getting the mean of all terms as a starting point of the iteration, the algorithm selected the k farthest distance objects from m, defined as Ж or initial centroids, and checked whether Ж already existed in SX list; if not, it would be stored to SX. The selection method was simply by sorting the distance matrix dataset containing each term vector distance to the mean. The distance formula we used here is the basicEuclidian distance measurement.
There are also two criteria veriables, namely alpha and beta. Each is used to determine minimum number, and the farthest distance of neighbor objects for the selected centroid candidates. This criteria must be fulfilled in order to avoid an outlier is selected as a centroid.
3.4. Sentiment Weighting
Before performing sentiment weighting by using Google Translate API, SWN 3.0 lexicon needed to be translated into Bahasa Indonesia [13]. By using Levensthein distance measure, not all terms in the corpus were perfectly matched, so the polarity values were manually set for special terms in banking and finance e.g., “collectability" or “coll”, “bowheer” (project employer) and “jaminan” (collateral) to get the precise positive(pos) or negative(neg) polarity value. If the weight was not manually defined, there would be misinterpretation in the sentiment weighting task, since those terms were not found in the lexicon.
Figure 4. Pillar Algorithm modified from Barakbah 2009 .
3.5. Evaluation
3.5.1. Silhouette Function
level of cluster result just like silhouette has, that is, ∈ . , . . The formulation is as seen against all objects within the same cluster of object i. b(i) isthe average distance between object i against all objects in other clusters. By using silhouette function, it will be easy to understand how well is an object placed in a cluster, therefore the quality of a clustering task is ensured for the risk documents.
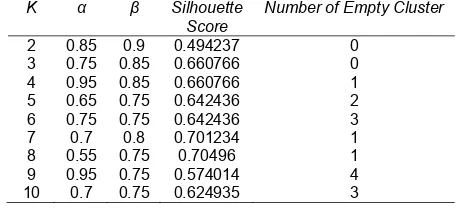
From the experiments that have been conducted, the values of α and β play a significant role in silhouette score. We noticed that the lowest values of α and β are 0.4 and 0.6, feasible to . Any combination value lower than those combinations are only feasible to K=2. There are 715 cluster solutions, thus, it is hard to observe all the cluster solutions, so we decided to pick up the cluster solutions with the highest silhouette score as listed in Table 2.
Table 2. Best cluster solution for each k, based on silhouette score
K α β Silhouette
From Table 2, it seems that K=8 is the best cluster solution to model the risk document based on the term relationship. Nevertheless, when we take a closer look, it has a cluster without any member in it, so we can conclude that the clustering task did not place the document properly. Then, the exploration continued with additional conditions to select the best cluster solution. Additional conditions are defined as follows: the best cluster solution is only selected (1) if it has no empty cluster and, (2) if it has no negative average silhouette score as figured in Figure 5.
The second additional condition has been added because high silhouette score does not always represent a solution with good quality for each cluster within. For example, for k=7, α=0.65, and β=0.8, from the silhouette score, they may be considered one of best cluster solutions, but when it is observed deeper, most of its objects have negative silhouette score. Our exploration found that the best cluster solution is k=6, α=0.65, and β=0.8, because it has the highest silhouette score, s=0.30205, and fulfills both additional criteria.
3.5.2. Sum Squared of Error
This evaluation also helps to understand the nature of the cluster solution. It has been noticed that the greater the number of clusters in a cluster solution is, the lower the SSE is resulted. For instance, for k=6, the top 5 cluster solutions are listed in Table 3 above. Table 3 empowers our reason to add the additional conditions since the cluster solutions that have not fulfilled both additional conditions tend to have higher SSE. Thus, those are not recommended as the best solutions, despite having high silhouette score.
Table 3. List of the SSE of first top 5 cluster solutions for k=6, and the best cluster solution
α β Number of Cluster with Negative Avg Silhouette Number of Empty Cluster SSE
0.75 0.75 1 3 7786.063
0.7 0.75 0 3 7802.287
0.6 0.8 2 0 7358.057
0.55 0.8 2 0 7358.057
0.5 0.8 2 0 7358.057
0.65 0.8 0 0 3974.671
3.5.3.K-Means Execution Time
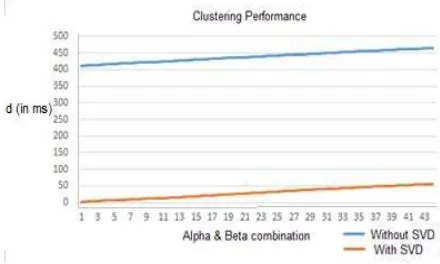
We also performed some comparison between two clustering task where the first task was performed without SVD decompisition, and the second task was performed with SVD decomposition. From the result we can see that by reduce the dimension using SVD we can save execution time. As seen in Figure 6, the performance of clustering task with SVD (up to 50 ms) is surpass the other task that not using SVD (400 ms to 460 ms). The comparison was taken for these following parameters: 6 ≤K ≤ 7, 0.5 ≤α≤ 1.0, and 0.5 ≤β≤ 1.0.
Figure 6. Clustering performance comparison (by execution time in miliseconds) on dataset that decomposed with SVD and without SVD
3.5.4.Sentiment Analysis Performance
For instance, in cluster 1, the total term weight is -6262.070, and the total number of documents is 221; thus, the Risk Score is -28.335.
To indicate how big the risk is, the sum of TF-IDF score and negative sentiment score was accumulated in each cluster. While each cluster has unique characteristics, on the contrary, each of them has variation sector of business. This indicates that specific business does not always has a specific risk, so, the bank may be more aware and more thoroughly in analyzing every loan proposal that comes in, not treating it in the same way as analyzing previous proposals with the same business sector. The result also shows that the type of risk found in the cluster solution is related to four of 5Cs (Character, Capacity, Capital, Condition, and Collateral) Credit criteria [20] that are commonly used to make lending decision. The mostly found criterion in the corpus is Capacity, while Character and Capital are not considered too significant, as the top ranked terms do not reflect these criteria.
This result can be used by the bank to resharp the risk analysis since only three of the 5Cs criteria are exposed significantly in at least one cluster. The analysts may have difficulities in analyzing Character since it needs more in-depth investigation in the field. However, they must also improve the Character analysis since it is the most important criterion. Capital is the criterion that the analysts may rely on the scoring system, so that they will not be too concerned with delivering the opinions.
Table 4. Risk cluster analysis and its corresponding 5Cs criteria
Cluster 1(2) Related to collateral and asset (fix asset and current asset),
e.g. “asset”, “piutang” (claim), “tanah”(land), “jaminan”(collateral)
221 -28.335 Collateral
2(3) Related to income, e.g. “net profit”, “copat” (cash operating profit after tax), “pendapatan”(profit), “leverage” (gain and loss ratio)
213 -27.502 Capacity
3(4) Related to production capacity, e.g. “persediaan”(stock), “kapasitas”(capacity), “penjualan”(sales)
47 -27.447 Capacity 4(5) Related to both income and financial measurements, e.g. “net
profit”, “copat” (cash operating profit after tax), “pendapatan” (profit), “leverage”(gain and loss ratio), “equity”, and “roe”(return of equity)
34 -26.102 Capacity
5(1) Related to business condition, e.g. “persaingan” (business competition), “wilayah”(territory), “demonstrasi warga” (protest from local residents)
2 -35.064 Condition
6(6) Related to business financial measurement, e.g. “perputaran” (business cycle), “quick ratio”, “equity”, “return of equity”, “roe”(return of equity) and “profit”
2 -24.548 Capacity
3.5.5. Comparison with The Conventional Risk Analysist
The conventional risk analysist for SME business, mostly are performed by only giving opinions or comments regarding the customer’s business condition, without being able to give a clear risk quantification. Here we help to improve the process by quantify the risk through sentiment analysis, and hopefully will directly help and improve the decision making process. Furthermore, we suggest that in the future there is an enhancement in this research by adding a classification feature so that the risk analysts will be able to classify the new customer’s information against the risk clusters.
4. Conclusion
Frequent update of data source are required to enrich the knowledge base and the information regarding risks in SME business, since this research only observed documents from 2013 to the beginning of 2014. This can be used as a challenge for the future works, to find the best efficient and effective method in adding new information when there are documents added.
References
[1] Soares J, Pina J, Ribeiro M, Catalao-Lopes M. Quantitative vs. Qualitative Criteria for Credit Risk Assessment. Frontiers in Finance and Economics. 2011; 8(1): 68-87.
[2] Chih FT, Jhen WW. Using neural network ensembles for bankruptcy prediction and credit scoring. Experts System with Applications. 2008; 34: 2639-2649.
[3] Medhat W, Hassan A, Korashy H. Sentiment analysis algorithms and applications: A survey. Ain Shams Engineering Journal. 2014: 1093-1113.
[4] Xu K, Shaoyi S, Li J, Yuxia S. Mining comparative opinions from customer reviews for Competitive Intelligence. Decision Support Systems. 2011; 50: 743-754.
[5] Ghiassi M, Skinner J, Zimbira D. Twitter brand sentiment analysis: A hybrid system using n-gram analysis and dynamic artificial neural network. Expert Systems with Applications. 2013; 40(16): 6266-6282.
[6] Li N, Wu DD. Using text mining and sentiment analysis for online forums hotspot detection. Decision Support Systems. 2010; 48: 354-368.
[7] Xu H, Zhai Z, Liu B, Jia P. Clustering Product Features for Opinion Mining. Proceedings of the fourth ACM international conference on Web search and data mining. ACM. 2011: 347-354.
[8] Zhang D, Dong Y. Semantic, Hierarchical, Online Clustering of Web Search Results. Advanced Web Technologies and Applications. 2004; 30(07): 69-78.
[9] Esuli, Sebastiani. Sentiwordnet: A publicly. International Conference on Language Resources and Evaluation (LREC). 2006; 1: 417-422.
[10] Thelwall M. Sentiment Strength Detection in Short Informal Text. Journal of the American Society for Information Science and Technology. 2010; 1: 2544-2558.
[11] Gonçalves P, Benevenuto F, Araujo M, Cha M. Comparing and Combining Sentiment Analysis Methods. Conference on Online Social Networks (COSN). 2013; 1: 27-38.
[12] Denecke K. Using SentiWordNet for Multilingual Sentiment Analysis. International Council for Open and Distance Education Conference. 2008.
[13] Lunando E, Purwarianti A. Indonesian Social Media Sentiment Analysis with Sarcasm Detection. Advanced Computer Science and Information Systems (ICACSIS). 2013; 1: 195-198.
[14] Zhang Q, Liu F, Xie B, Huang Y. Index Selection Preference and Weighting for Uncertain Network Sentiment Emergency. TELKOMNIKA Indonesian Journal of Electrical Engineering. 2013; 11(1): 287-295.
[15] Barakbah AR, Kiyoki Y. A Pillar Algorithm for K-Means Optimization by Distance Maximization for Initial Centroid Designation. IEEE Symposium on Computational Intelligence and Data Mining (CIDM). 2009; 1: 61-68.
[16] Manning CD, Prabakhar R, Schütze H. An Introduction of Information Retrieval. Cambridge: Cambridge University Press. 2009: 118-119.
[17] Zhang PY. A HowNet-based Semantic Relatedness Kernel for Text Classification. TELKOMNIKA. 2013; 11(4): 1909-1915.
[18] [18] Osinski SL, Stefanowski J, Weiss D. Lingo: Search Results Clustering Algorithm Based on Singular Value Decomposition. Master Thesis. Poznan: Poznan University of Technology. 2003. [19] Rousseeuw PJ. Silhouettes: a Graphical Aid to the Interpretation and Validation of Cluster Analysis.
Computational and Applied Mathematics. 1986; 20: 53-65.
[20] Gumparthi S. Risk Assessment Model for Assessing NBFCs’ (Asset Financing) Customers. International Journal of Trade, Economics and Finance. 2010; 1: 121-130.