Indonesian local fetal-weight standard: a better predictive ability for low Apgar score of
small-for-gestational age neonates
Keywords: Apgar, small-for-gestational-age, standard, weight
pISSN: 0853-1773 • eISSN: 2252-8083 • http://dx.doi.org/10.13181/mji.v25i4.1301 • Med J Indones. 2016;25:228–33 • Received 30 Oct 2015 • Accepted 04 Sep 2016
Corresponding author: Adly N.A. Fattah, adlynanda@yahoo.com
Copyright @ 2016 Authors. This is an open access article distributed under the terms of the Creative Commons Attribution-NonCommercial 4.0 International License (http://creativecommons.org/licenses/by-nc/4.0/), which permits unrestricted non-commercial use, distribution, and reproduction in any medium, provided the original author and source are properly cited.
Adly N.A. Fattah,1 Karina N. Pratiwi,1 Sulaeman A. Susilo,1 Jimmy S.N. Berguna,1 Rima Irwinda,1
Noroyono Wibowo,1
Budi I. Santoso,1
Jun Zhang2
1 Department of Obstetrics and Gynecology, Faculty of Medicine Universitas Indonesia, Cipto Mangunkusumo Hospital,
Jakarta, Indonesa
2 Ministry of Education-Shanghai Key Laboratory of Children’s Environmental Health, Xinhua Hospital, Shanghai, China
C l i n i c a l Re s e a rc h
ABSTRAK
Latar belakang: Keakuratan penilaian pertumbuhan janin adalah salah satu komponen penting dalam asuhan antenatal. Rujukan umum berat janin dan berat lahir yang dapat diadaptasi pada pasien lokal telah dikembangkan oleh Mikolajczyk dan rekan. Penelitian ini bertujuan untuk memvalidasi standar presentil lokal dengan mengevaluasi odds ratio (OR) dari skor Apgar <7 pada menit ke-1 dan ke-5 pada small-for-gestational age (SGA) dibandingkan bayi yang tidak SGA.
Metode: Kami menggunakan rujukan umum persentil berat janin dan berat lahir yang dikembangkan Mikolajczyk
dan rekan untuk menghasilkan standar local Indonesia kemudian merumuskan neonatus dengan SGA. Data divalidasi menggunakan basis data bayi lahir tunggal hidup (2.139 kelahiran) dari 1 Januari hingga 31 Desember 2013 di Rumah Sakit Cipto Mangunkusumo, Jakarta, Indonesia. Kami membandingkan rujukan kami dengan rujukan dari Hadlock
dan rekan. Dari setiap rujukan, OR Apgar <7 pada menit 1 dan 5 pada bayi SGA dibandingkan dengan tidak SGA diukur menggunakan analisis bivariat dan multivariat.
Hasil: SGA didapatkan pada 35% (748/2.139) dan 13%
(278/2.139) dari neonatus sesuai definisi standar Indonesia
dan Hadlock. OR dari skor Apgar <7 pada menit 1 dan 5 adalah 3,45 (95% IK=2,56–4,65) dan 3,05 (95% IK=1,92–4,83) untuk berat janin standar lokal Indonesia dibandingkan 2,14 (95% IK=1,65–2,76) dan 1,83 (95% IK=1,21–2,77) sesuai rujukan
Hadlock dan rekan.
Kesimpulan: Berat janin Indonesia terstandar memiliki kemampuan lebih baik dalam memprediksi skor Apgar <7 pada menit ke-1 dan ke-5 pada neonatal dengan SGA dibandingkan rujukan dari Hadlock dan rekan.
ABSTRACT
Background: Accurate assessment of fetal growth is one of crucial components of antenatal care. A generic reference for fetal-weight and birthweight percentiles that can be easily adapted to local populations have been developed by Mikolajczyk and colleagues. This study aimed to validate our own local percentile standard by evaluating the odds ratio (OR) of low 1st and 5th minute Apgar score for
small-for-gestational age (SGA) versus those not SGA.
Methods: We used the generic reference tools for fetal-weight and birthweight percentiles developed by Mikolajczyk and colleagues to create our own local standard
and then defined the SGA neonates. For validation, we used
the database of singleton live deliveries (2,139 birth) during January 1st to December 31st 2013 in Cipto Mangunkusumo
Hospital, Jakarta, Indonesia. We compared our reference
with that of Hadlock and colleagues. For every reference,
the OR of Apgar score <7 at 1st and 5th minutes for infants
who were SGA versus those not estimated with bivariate and multivariate analyses.
Results: SGA found in 35% (748/2,139) and 13%
(278/2,139) of neonates using the definition derived from
Indonesian standard and Hadlock’s. OR of Apgar score <7 at 1st and 5th minutes were 3.45 (95% CI=2.56–4.65) and
3.05 (95% CI=1.92–4.83) for the Indonesian local fetal-weight standard compared with respectively 2.14 (95% CI=1.65–2.76) and 1.83 (95% CI=1.21–2.77) for Hadlock and collegues’ reference.
Conclusion: Indonesian local fetal-weight standard has a better ability to predict low 1st and 5th minutes
Accurate assessment of fetal growth is one of
crucial components of antenatal care,1 because
intrauterine growth restriction (IUGR) could lead to the increased rate of perinatal mortality and
morbidity.2 However, defining normal or abnormal
fetal growth has become a great challenge in clinical
research.3 Many studies have been conducted
to find the best method to assess fetal growth.4
They are widely ranging methods from a
simple-inexpensive fundal height measurement5 to the
Doppler velocimetry and biomarkers work-up.3
In 2014, the International fetal growth standards for the clinical interpretation was issued. It was derived from women who were at low risk of IUGR in eight countries (Brazil, Italy, Oman, United
Kingdom, United States, China, India, and Kenya).6
However, there was contrary statement that the use of customized or individualized fetal weight charts, with adjustment for maternal and fetal factors, have a better accuracy in predicting fetal weight compared to non-customized fetal-weight
reference.7,8 Dutch already constructed their own
reference standard for birthweight by parity,
sex, and ethnic background, seperately.9 United
States also have their own customized standard to assess the fetal growth and birthweight among their population by adjusting physiological coefficients (maternal height, weight, parity, ethnic origin, and sex of the baby), positive (diabetic mothers) and negative effects (smoking, history of preterm delivery, and hypertensive
diseases) on birthweight.10 These standards were
created as the consequences of statement that optimal neonatal outcome is achieved at different
birth weights in different populations.4
It was internationally accepted that customized standards for fetal growth and birth weight improve the accuracy to detect IUGR by better distinction between physiological and pathological
smallness.2,7 Ideal diagnosis of IUGR is complex
because it should involve the growth potential of the fetus, current fetal size, fetal and placental
health, and, if available, fetal growth velocity.3
Miller et al11 stated that normal fetal growth is
affected by the genetically predetermined growth potential and later controlled by maternal, fetal,
placental, and external factors11.
Mikolajczyk et al12 created generic reference for
fetal-weight and birthweight percentiles that can be easily adapted to local populations. It has a better
ability to predict adverse perinatal outcomes than the non-customized fetal-weight reference, and is simpler to use than the individualized reference without loss of predictive ability. They created a weight percentiles calculator that allow us to obtain weight percentile standards for our own local population by inserting the mean birthweight at 40
weeks of our population into the formula.12
In this present study, we aimed to develop our own local percentile standard of fetal birthweight using the generic reference tool developed by
Mikolajczyk et al.12 We applied the correlation
between small-for-gestational age and low 5th
minute Apgar score to test the predictive ability of our fetal weight standard. It will be compared with the previous birthweight percentile
developed by Hadlock et al13 that commonly used
in our practical setting.
METHODS
The generic reference tool developed by
Mikolajczyk et al12 was first downloaded in a
form of excel (.xls) file. The original article was
downloaded in order to analyze the method used in the development of the generic reference of the fetal weight chart. They made the weight reference easily adjustable according to the mean birthweight at 40 weeks of gestation for any local population after considering the fetal-weight
reference developed by Hadlock et al13 and the
notion of proportionality proposed by Gardosi
et al.14 Optimum growth equation proposed by
Hadlock et al13 was used to create a generic global
reference.
Fetal weight (g) = exp(0.578 + 0.332 × GA – 0.00354 × GA2)
Hadlock et al13 performed ultrasound examination
between 10 and 41 weeks of gestation of 392 pregnant women of the European Continental Ancestry Group in the USA. The statistical variation of fetal weight in a given gestational week was also provided and resulted in a constant fraction of mean. Therefore, the fetal-weight percentiles
of each gestational week were developed13.
Gardosi et al5 created the individualized reference
by using the Hadlock et al13 formula. They
function. Therefore, a percentage of the expected weight based on Hadlock’s formula could be derived from a given individual birth weight. They also adjusted it for ethnic group, parity, sex
of the infant, and maternal height and weight.14
To determine the mean birthweight, we use at least 100 deliveries at 40 weeks (40+0 to 40+6) and with no risk factors for having small-for-gestational age (SGA) infants. Therefore for this purpose, pregnancy complicated with preeclampsia, intrauterine growth restriction, known congenital anomalies, maternal systemic disease i.e heart failure, diabetes mellitus were excluded from the initial database.
For application and validation, we used data from our delivery database at Cipto Mangunkusumo Hospital, Jakarta, Indonesia. This database contains clinical information on all women who
delivered their babies during 1st January to 31st
December 2013. Gestational age was determined based on first trimester ultrasound examination, and if not available, last menstrual period.
SGA was defined as below 10th percentile for
completed week of gestational age based on the local percentile standards. The percentile of each neonates’ birthweight was obtained from Fetal/ Birth Weight Percentiles Calculator developed
by Mikolajczyk et al.12 Apgar scores at 1st and
5th minutes below 7 established by competent
perinatology residents was considered as low.
Bivariate analysis was used to find the association between the low Apgar score with SGA defined by both of Indonesian local fetal weight standard and Hadlock’s Fetal weight standard. P<0.05 was considered as significant association. Statistical analyses were conducted
using software IBM® SPSS® Statistics version 20
(Armonk, NY: IBM Corp).
RESULTS
Mean birthweight at 40 completed weeks of gestation were respectively 3,705 grams and
3,217 grams by Hadlock et al13 and by our local
standard. Hadlock et al13 performed ultrasound
measurements between 10 and 41 weeks of gestation among 392 pregnant women of the European Continental Ancestry Group living in the USA in order to create the optimum growth equation. We calculated the mean birthweight of 285 neonates born in during 2013 who were not at risk of having SGA. Therefore, preeclamptic deliveries, IUGR fetus, fetal with known congenital anomaly were excluded prior to the calculation.
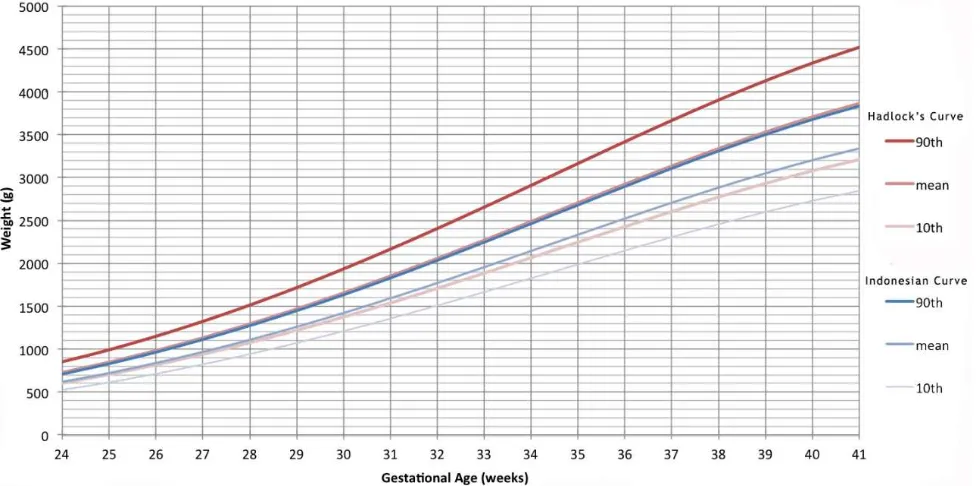
We developed two growth percentile standards (Figure 1) using the generic reference tool and then defined the SGA from both standards (Table 1).
The 10th percentile value of fetal weight at 28
wga were respectively 1,074 g and 957 g defined by Hadlock’s standard and by Indonesian fetal
growth standard. At 40 wga, the 10th percentile
value was respectively 3,077 g and 2,744 g defined
by Hadlock’s standard13 and by Indonesian fetal
growth standard (Table 2).
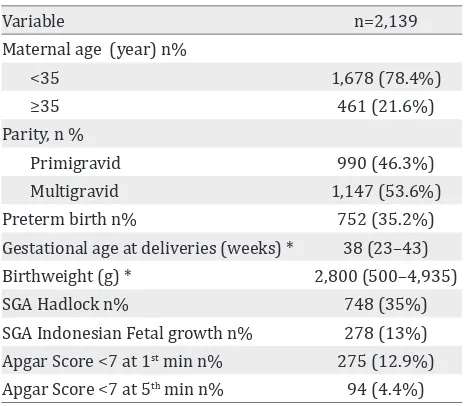
We validated the definition of SGA using the delivery database of 2,139 deliveries during
1st January to 31st December 2013 in Cipto
Mangunkusumo Hospital Jakarta, Indonesia. Table 2 shows the characteristics of women underwent delivery registered in our database. The median (range) of maternal age was 29 years (13–48). More than half of the population was multigravida (53.6%). The median (range) of birthwight was 2,800 (500–4,935) grams. SGA was diagnosed in 35% (748/2,139) of the population using the definition derived from
Hadlock’s standard13. However it found in 13%
(278/2,139) of neonates when defined by Indonesian fetal growth standard definition. Low Apgar scores were found respectively in 12.9% (275/2,149) and 4.4% (94/2,139) of neonates (Table 3).
Low Apgar scores at both of 1st and 5th minutes
were significantly associated with the SGA neonates defined by both standards (p>0.005).
OR of Apgar scores lower than 7 at 1st and 5th
minutes were respectively 3.45 (95% CI=2.56– 4.65) and 3.05 (95% CI=1.92–4.83) for the Indonesian local fetal-weight standard compared with respectively 2.14 (95% CI=1.65–2.76) and
1.83 (95% CI=1.21–2.77) for Hadlock et al13
standard. After adjusted with maternal age,
parity, and preterm delivery, the OR of low 1st
minute AS was improved from 3.45 to 3.53 using the definition of SGA derived from Indonesian
standard. However, using the Hadlock’s et al13
Variable
90th percentile at 28 wga (g) 1,512 1,288
90th percentile at 40 wga (g) 4,333 3,691
10th percentile at 28th wga (g) 1,074 957
10th percentile at 40th wga (g) 3,077 2,744
Table 1. Birthweight mean and percentiles on Hadlock’s standard13 and Indonesian fetal growth standard
Wga= weeks of gestational age
Variable n=2,139
Maternal age (year) n%
<35 1,678 (78.4%)
≥35 461 (21.6%)
Parity, n %
Primigravid 990 (46.3%)
Multigravid 1,147 (53.6%)
Preterm birth n% 752 (35.2%) Gestational age at deliveries (weeks) * 38 (23–43) Birthweight (g) * 2,800 (500–4,935)
SGA Hadlock n% 748 (35%)
SGA Indonesian Fetal growth n% 278 (13%) Apgar Score <7 at 1st min n% 275 (12.9%)
Apgar Score <7 at 5th min n% 94 (4.4%)
Table 2. Delivery characteristics of database used for valida-tion of Hadlock’s and Indonesian fetal growth chart
SGA: small-for-gestational-age; *: variables expressed as me-dian (range).
SGA (Indonesian Local Fetal Weight Standard) SGA (Hadlock’s Fetal Weight Standard)
n % OR(95%CI) Adj OR(95%CI)* n % OR(95%CI)* Adj OR(95%CI) AS 1st min < 7 80/278 28.8% 3.45 (2.56–4.65) 3.53 (2.56–4.89) 140/748 18.7% 2.14 (1.65–2.76) 1.57 (1.20–2.07)
AS 5th min < 7 28/278 10.1% 3.05 (1.92–4.83) 2.80 (1.73–4.51) 46/748 6.1% 1.83 (1.21–2.77) 1.21* (0.79–1.87)
Table 3. Odds ratio of Apgar score < 7 at 1st and 5th minutes for infants who were SGA versus those not estimated with bivariate
and multivariate analysis
SGA: small-for-gestational-age; AS: Apgar Score; OR: odds ratio; Adj OR: adjusted odds ratio; CI: confident interval; *: non-signifi
-cant result (p>0.05). Multivariate analysis was performed by adjusting maternal age, parity, and preterm delivery
definition, the SGA was no longer associated
with low 5th minute AS (p>0.05) after adjusting
DISCUSSION
We showed that Indonesian local fetal-weight
standard has a better ability to predict low 1st and
5th minutes Apgar scores of SGA neonates than
has the Hadlock13 and collegues13 reference. The
evidences that SGA neonates have an increased
risk of low 1st and 5th minutes Apgar scores were
irrespective of the standard used for definition. In our study, however, most of low Apgar scores were found in infants without SGA. Consequently, the predictive value of status of SGA for low Apgar
score is very low.12 Low Apgar score was closely
related to most cases of early neonatal mortality
as well as low birth weight and prematurity.15
It also has a significant association with SGA
neonates.12
Mikolajczyk et al12 have published a reliable
generic reference for fetal-weight and birthweight percentiles that can be easily adapted to local populations. They compared the prediction ability for adverse perinatal outcomes of their non-customized fetal-weight reference with the fully individualized
reference developed by Gardosi et al.14 Adverse
perinatal events include any of stillbirth, dead
within or after 24 hours of birth, alive on 7th
day postpartum but referred to a higher level or special care unit, or Apgar score lower than seven at five minutes. We studied Apgar
scores <7 at both of 1st and 5th minutes as the
adverse perinatal event because the data are available in every deliveries record therefore the probability of having missing data would be reduced.
Odds ratio of Apgar score <7 at 5th minute was
3.05 (95% CI=1.92–4.83) for the Indonesian local fetal-weight standard. It was similar with OR of adverse outcomes (stillbirth, dead
within or after 24 hours of birth, alive on 7th
day postpartum but referred to a higher level or special care unit, or Apgar score <7 at five minutes) for infants SGA versus those SGA age determined by the country-specific reference developed by Mikolajczyk and colleagues 2.87
(95% CI=2.73–3.01).12 In addition, our findings
supported the evidence that the local standard
derived from generic tool12 has a better ability
to predict adverse perinatal outcomes than has the non-customized fetal-weight reference.
We used the generic reference tool due to its proven-applicability and flexibility. It was validated in a large multinational study that included various ethnic groups. We considered that such tool is very useful in low-resource settings, especially where longitudinal ultrasound studies needed to examine variation in fetal growth were difficult to be conducted. To our knowledge, this is the first study that validates the generic reference tool developed by
Mikolajczyk et al12 in Indonesia. Also, deliveries
occurred over a year period in a tertiary medical center, is unlikely to affect to the Apgar score. However it has several limitations. First, by using this generic reference tool which is developed
using the method proposed by Gardosi et al,14 a
similar fetal growth pattern was assumed for all ethnic groups. However, this assumption might not always be accurate. Our hospital is a tertiary national referral hospital that allows multi-ethnic patients to be managed. In addition, we considered that defining normal and abnormal fetal growth using the reference or standard is found to be problematic in both of research fields
and clinical practice.3 Second, we found similarly
high prevalence of SGA in both standards (35% and 13% respectively for Indonesian standards
and Hadlock’s standard13) using the cut off of 10th
percentile. In undernourished population the prevalence would probably different. Therefore, this study result should only be generalized to pregnant women who have adequate nutrition.
Finally, utilization of a generic reference for fetal weight and birthweight can be completed with
the approach developed by Mikolajczyk et al.12 A
definition of SGA was largely dependent on the study population, i.e ethnic origin and maternal nutritional status. Indonesian local fetal-weight standard produced lower prevalence of SGA than
Hadlock’s.13 It also has a better ability to predict
low 1st and 5th minutes Apgar scores of SGA
neonates than has the Hadlock et al13 reference.
Acknowledgment
This paper is based upon previous research work of Jun Zhang from MOE and Shanghai Key Laboratory of Children’s Environmental Health, Xinhua Hospital, Shanghai, China.
Conflicts of interest
REFERENCES
1. Bloemenkamp KWM. Fetal growth. Int Congr Series.
2005;1279:295–301.
2. Gardosi J. Fetal growth standards: individual and global
perspectives. Lancet. 2011;377(9780):1812–4.
3. Zhang J, Merialdi M, Platt LD, Kramer MS. Defining
normal and abnormal fetal growth: promises and challenges. Am J Obstet Gynecol. 2010;202(6):522–8. 4. Reeves S, Bernstein IM. Optimal growth modeling.
Semin Perinatol. 2008;32(3):148–53.
5. Morse K, Williams A, Gardosi J. Fetal growth screening
by fundal height measurement. Best Pract Res Clin Obstet Gynaecol. 2009;23(6):809–18.
6. Papageorghiou AT, Ohuma EO, Altman DG, Todros T, Cheikh Ismail L, Lambert A, et al. International standards for fetal growth based on serial ultrasound
measurements: the Fetal Growth Longitudinal
Study of the INTERGROWTH-21st Project. Lancet. 2014;384(9946):869–79.
7. Gelbaya TA, Nardo LG. Customised fetal growth chart: a systematic review. J Obstet Gynaecol. 2005;25(5):445–50.
8. Kiserud T, Johnsen SL. Biometric assessment. Best Pract Res Clin Obstet Gynaecol. 2009;23(6):819–31.
9. Visser GH, Eilers PH, Elferink-Stinkens PM, Merkus HM, Wit JM. New Dutch reference curves for birthweight by gestational age. Early Hum Dev. 2009;85(12):737–44.
10. Gardosi J, Francis A. A customized standard to assess
fetal growth in a US population. Am J Obstet Gynecol. 2009;201(1):25e1–7.
11. Miller J, Turan S, Baschat AA. Fetal growth restriction.
Semin Perinatol. 2008;32:274–80.
12. Mikolajczyk RT, Zhang J, Betran AP, Souza JP, Mori R, Gülmezoglu AM, et al. A global reference for fetal-weight and birthweight percentiles. Lancet. 2011;377(9780):1855–61.
13. Hadlock FP, Harrist RB, Martinez-Poyer J. In utero
analysis of fetal growth: a sonographic weight standard. Radiology. 1991;181(1):129–33.
14. Gardosi J, Mongelli M, Wilcox M, Chang A. An adjustable fetal weight standard. Ultrasound Obstet Gynecol. 1995;6(3):168–74.