The effect of high protein enteral nutrition on protein status in acute stroke
patients
Sri Wuryanti*, Savitri Sayogo*, Sitti Airiza Ahmad
Abstrak
Penelitian ini dilakukan untuk mengetahui pengaruh pemberian nutrisi enteral tinggi protein pada status protein penderita stroke akut. Subjek penelitian dibagi 2 kelompok secara randomisasi blok, yaitu kelompok perlakuan mendapat nutrisi enteral tinggi protein (NETP) dan kelompok kontrol mendapat nutrisi enteral standar rumah sakit (NERS). Tiga puluh enam subjek dari 60 penderita stroke akut berhasil menjalani 7 hari penelitian ini. Hasil penelitian menunjukkan bahwa pemberian NETP dapat meningkatkan kadar prealbumin serum, menurunkan ekskresi kreatinin urin, dan memperkecil penurunan kadar albumin serum dibandingkan kelompok kontrol. (Med J Indones 2005; 14: 37-43)
Abstract
The objective of this study was to determine the effect of high protein enteral nutrition on protein status in acute stroke patients. The subjects were divided into two groups using block randomisation, i.e. the intervention group that received high protein enteral nutrition (HPEN), and the control group that received enteral hospital diet. Thirty six out of 60 acute stroke patients had completed 7 days of follow-up. The results showed that HPEN have increased prealbumin level, decreased urinary creatinine excretion, and decreased the decline of albumin serum compared to the control group. (Med J Indones 2005; 14: 37-43)
Keywords:albumin, prealbumin, urinary urea nitrogen, urinary creatinine, nitrogen balance
The identification of undernutrition may have important clinical implications on a hospital patient׳s outcome. Numerous studies have demonstrated positive associations between specific clinical markers of undernutrition and morbidity or mortality in acute clinical care environment. Stroke patients are particulary at risk of undernutrition because the majority are old and have premorbid fraility. Up to 16% of stroke patients may be undernourished on admission to hospital and undernutrition tends to worsen during the hospital stay, especially in the more dependent patients.1
In stroke patients, neurologic defect after stroke such as swallowing difficulty, reduced consciousness,
motor and sensory dysfunction, and communication difficulties also lead to poor nutritional intake. Furthermore, stress response in acute stroke may lead to undernutrition by hypercatabolism and hyper-metabolism. Both stress and undernutrition can worsen the prognosis by decreasing protein synthesis and increasing protein degradation, thus reducing the circulating levels of proteins such as albumin and prealbumin.1,2 Hypoproteinemia may complicate an illness and its treatment and has been associated with reduced wound healing, wound dehiscence, decubitus ulcer formation, reduced immune responsiveness, and reduced small intestinal mobility and absorbtion.3
There is evidence that nutritional supplementation improves nutritional status and can reduce morbidity and mortality.3 Adequatenutritional support in stroke patients has been found to decrease complication rate, shorten the length of hospital stay, improve functional outcome and lower mortality.1,4
*
Department of Nutrition, Faculty of Medicine, University of Indonesia, Jakarta, Indonesia
The aim of this study was to determine the effect of high protein enteral nutrition on protein status in acute stroke patients.
METHODS
This study was conducted from September 2002 through March 2003, at IRNA B, Department of Neurology, Cipto Mangunkusumo General Hospital, Jakarta. Inclusion criteria for subjects enrolled in this study were (1) had hemorrhage or ischaemic stroke diagnosed by CT scan or clinical examination; (2) admission delay of less than 48 hours from onset of stroke; (3) had swallowing problem. Exclusion criteria were (1) hepatic or renal impairment; (2) blood glucose level at admission 200mg %; and (3) were receiving ongoing corticosteroid treatment for more than 2 weeks. The subjests were allocated to the intervention or control group using block randomization.
Nutritional status was assessed on admission. The anthropometric measurements done were body weight, height, and body mass index. Laboratory assessments were (1) albumin and prealbumin level on the 1st and 7th day; (2) urinary urea nitrogen (UUN) and urinary creatinine on the 1st, 4th, and 7th day using a 24-hour urine collection. Nitrogen balance was calculated by substracting nitrogen intake with urinary urea nitrogen.
On the1st and 2nd day, both groups received the hospital enteral nutrition appropiate to basal energy expenditure (BEE) which were calculated using Harris Bennedict equations.4,5 On the 3rd until the 7th day, the intervention group were given high protein enteral nutrition (HPEN), which was equal to total energy expenditure (BEE + thermic effect of food + physical activity + stres factors),5 whereas the control group was given enteral hospital diet (Table 1).
Statistical analysis
Statistical program for social science (SPSS) version 10 was used for data analyses. Descriptive data are presented in mean SD, median, and minimum-maximum values. Comparison between intervention and control groups were analyzed using t-test if the distribution of the data was normal, and using
Mann-Whitney test if the distribution of the data wasn’t
normal.
Comparison between pre and post intervention measurements were analyzed using dependent t-test if the distribution of the data was normal, and using Wilcoxon test if the distribution was not normal.
RESULTS
There were 342 patients admitted to IRNA B, and sixty subjects were recruited into the study. On the follow up, 24 patients were droped out due to death (12 patients), stress ulcer (5 patients), discharged without permission (5 patients), and transfer to another place (2 patients). Overall, there were 36 patients, 18 patients in each group who had completed the study.
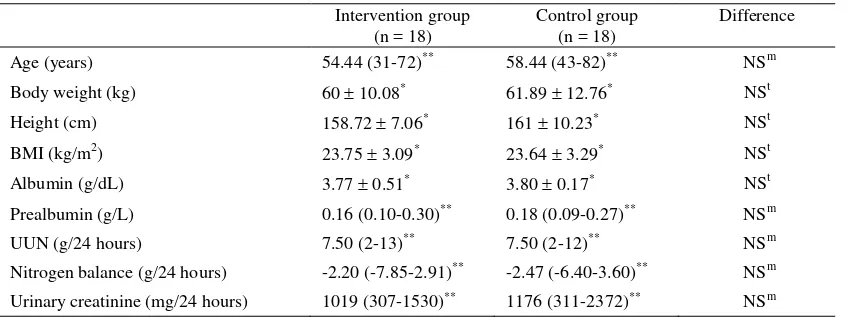
Characteristics of the subjects are shown in table 2. Anthropometric and laboratory indices in the two study groups were similar. Baseline serum albumin and prealbumin level tended to be higher in the control group compared to the intervention group, but it was not significant. On the 1st day, in both groups, UUN was above the normal range, nitrogen balance was negative, and the urinary creatinine was in the normal range.
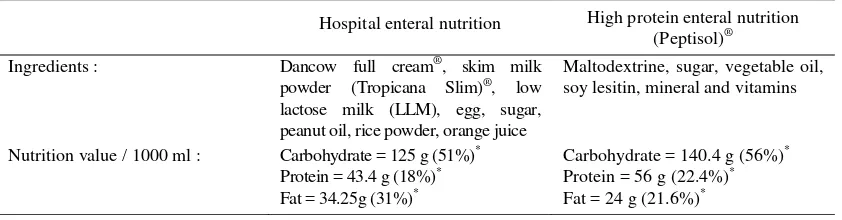
Table 1. Ingredients and nutrition value of enteral nutrition
Hospital enteral nutrition High protein enteral nutrition (Peptisol)®
Ingredients : Dancow full cream®, skim milk powder (Tropicana Slim)®, low lactose milk (LLM), egg, sugar, peanut oil, rice powder, orange juice
Maltodextrine, sugar, vegetable oil, soy lesitin, mineral and vitamins
Nutrition value / 1000 ml : Carbohydrate = 125 g (51%)*
Protein = 43.4 g (18%)* Fat = 34.25g (31%)*
Carbohydrate = 140.4 g (56%)*
Protein = 56 g (22.4%)* Fat = 24 g (21.6%)*
Table 2. Baseline characteristics of the intervention and control group Intervention group
(n = 18)
Control group (n = 18)
Difference
Age (years) 54.44 (31-72)** 58.44 (43-82)** NSm
Body weight (kg) 60 10.08* 61.89 12.76* NSt
Height (cm) 158.72 7.06* 161 10.23* NSt
BMI (kg/m2) 23.75 3.09* 23.64 3.29* NSt
Albumin (g/dL) 3.77 0.51* 3.80 0.17* NSt
Prealbumin (g/L) 0.16 (0.10-0.30)** 0.18 (0.09-0.27)** NSm
UUN (g/24 hours) 7.50 (2-13)** 7.50 (2-12)** NSm
Nitrogen balance (g/24 hours) -2.20 (-7.85-2.91)** -2.47 (-6.40-3.60)** NSm
Urinary creatinine (mg/24 hours) 1019 (307-1530)** 1176 (311-2372)** NSm
BMI= body mass index, UUN= urinary urea nitrogen, * = mean SD, ** = median (minimum-maximum), NS= not significant (p > 0.05), t = independent t test, m= Mann-Whitney test
Energy intake in both groups on the 1st and 2nd day were similar, while starting on the 3rd day the intervention group received more protein and
carbohydrate than the control group (table 3). Protein intake in intervention and control group was 1.6 and 0.9 g/kg per day, respectively.
Table 3. Energy intake, basal energy expenditure and total energy expenditure in the intervention and control groups during the study
Intervention group (n = 18)
Control group (n = 18)
Difference
On 1st and 2nd day
BEE (kcals)
Energy intake (kcals): Protein (g) Fat (g)
Carbohydrate (g)
On 3rd until 7th day
TEE (kcals)
Energy intake (kcals): Protein (g) Fat (g)
Carbohydrate (g)
1287.56 150.87* 1303.82 176.47*
55.50 + 9.64* 47.50 (19.80 – 60.23)**
168,46 22,78*
1759.92 + 216.69* 1763.97 213.02* 97.56 11.86*
42.07 5.08* 249.74 30.88*
1323.41 + 245.82* 1313.47 260.11*
57.13 12.18* 50.82 (27.55 – 72.40)**
164.75 30.61*
1789.02 + 325.86* 1760.55 308.21* 75.29 13.75* 65.06 (32.45 – 84.7)**
224.66 43.35
NSt NSt NSt
NSm NSt
NSt NSt
St
Sm St
Figure 1. Albumin levels in the intervention and control goups
Value= mean SD, NS= not significant (p > 0.05), t= t test
Figure 1 shows the change in albumin level in both groups at admission and the 7th day. There was no significant difference in albumin level between the two groups, although in the control group, there was a higher decrease compared to the intervention group.
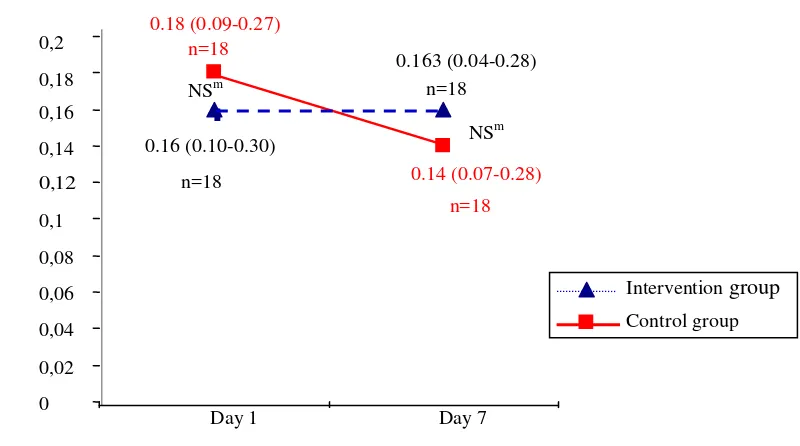
There was a significant difference in the change of prealbumin level (between the 1st and the 7th day) between the two groups. In the intervention group, there was a slight increase in prealbumin level, while in the control group, there was a decline in prealbumin level (Figure 2).
Figure 2. Prealbumin levels in the intervention and control group
Values= median (minimum - maximum), NS= not significant (p > 0.05), m= Mann Whitney test
3.42 0,35 n=18
3.77 0,51
n=18 3.20 0,44
n=18 3.80 0,17
n=18
0
1
2
3
4
Day 7
Alb
u
m
in
lev
els (
g
/d
L
)
Intervention group
Control group NSt
NSt
Day 1
0.163 (0.04-0.28) n=18
0.16 (0.10-0.30)
n=18 0.14 (0.07-0.28)
n=18 0.18 (0.09-0.27)
n=18
0 0,02 0,04 0,06 0,08 0,1 0,12 0,14 0,16 0,18 0,2
Day 1 Day 7
Pre
alb
u
m
in
lev
els (
g
/L)
Intervention group
Control group NSm
Figure 3. Urinary urea nitrogen on day 1, 4, and 7 in the intervention on and control groups
Value= median (minimum - maximum), NS= not significant (p > 0.05), S= significant (p < 0.05), m= Mann Whitney test
Figure 4. Nitrogen balance on day 1, 4, and 7 in the intervention and control groups
Value= median (minimum - maximum), NS= not significant (p > 0.05), m = Mann Whitney test
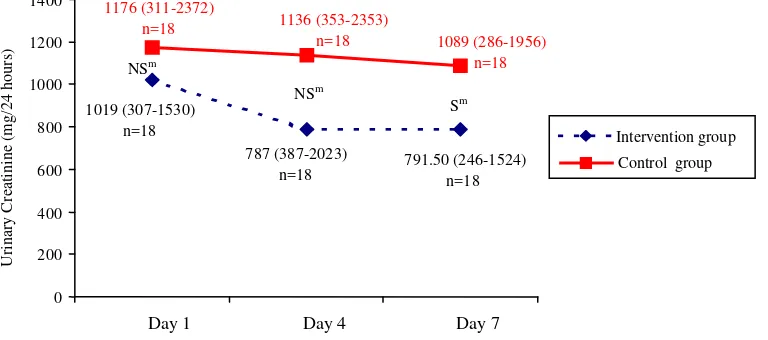
Figure 5. Urinary creatinine on day 1, 4, and 7 in the intervention and control groups
Value= median (minimum - maximum), NS= not significant (p > 0.05), S= significant (p < 0.05), m= Mann Whitney test
Figure 3, 4, and 5 showed urinary urea nitrogen, nitrogen balance, and urinary creatinine respectively, that was measured on day 1, 4, and 7, in the intervention and control groups.
DISCUSSION
The average energy intake in both groups compared to the energy requirement during the study period was more than 95%, and no significant difference was found in terms of the energy intake in both groups (Table 3). Enteral feeding is effective in improving nutritional intake and status in stroke patients.1 Enteral nutrition generally is preferred over parenteral feeding because it is more physiologic, and maintains gastrointestinal tract integrity, and acts as intestinal mucosal barrier to bacteria. Furthermore large quantities of energy can be provided enterally without fluid overload.6
In this study, we monitored albumin and prealbumin level. Ideally, a protein marker should readily respond to changes in nutrient intake, and is not influenced by other disease processes. The marker must have a short biologic half-life, exists in a relatively small pool, has a predictable catabolic rate, and a rapid rate of synthesis that responds only to protein intake.7
Albumin level is a traditional marker that has long been used in assessments of hospital patients, and it is useful in identifying long-term malnutrition. However, serum albumin is not very sensitive to short-term changes in protein status. It has a large body pool, a long half-life (20 days), and is affected by many factors other than protein energy nutritional status. A large propotion of albumin is present in extravascular compartments, and can be mobilized during periods of protein depletion. Albumin level is also sensitive to variations in hydration and liver function.8,9
On the other hand, prealbumin has a short half-life (2 days) and a small body pool, which makes it sensitive to fairly rapid changes in protein energy status and responds more rapidly to dietary treatment. Prealbumin level is not affected by hydration status, and is less affected by liver disease compared to other serum proteins.7,9 In patients who are receiving nutritional support, a response in prealbumin level can be anticipated as early as four days after supplementation is started, with a definite response at the 8th day.7
Seven days after admission there was a decline in were significantly greater in the intervention group (1.6 g/kg per day vs 0.9 g/kg per day). This fact suggested that dietary high protein could maintain albumin level, and improve prealbumin level.
The catabolic state and associated neuroendocrine response that is likely to follow acute stroke may lead to altered serum albumin concentration in the period immediately after the stroke. There was already an evidence linking high stress reaction during the first week after the stroke and undernutrition.10 In this study, serum albumin was used to indicate the degree of stress, while serum prealbumin was used to observe response to dietary treatment. Stroke patients with hypoalbuminemia had greater risk of infective complications and poor functional outcome during hospitalization compared to those with normal or higher serum albumin concentrations.11
Urinary urea nitrogen excretion in the intervention group was higher than the control group. This phenomenon was caused by more substantial protein intake from HPEN. Raised UUN may come from some of ingested protein that is catabolized and converted to UUN.3 In this study, there was negative nitrogen balance since the 1st day. Usually, metabolic response to stress is characterized by an accelerated catabolism of lean body or skeletal mass that clinically results in negative nitrogen balance. To meet the increased metabolic demands, higher levels of both calories and protein are required.12 A report indicated that aggressive nutritional support did not prevent substantial body protein loss during severe catabolic illnesses.10 However, aggressive nutritional support decreases negative nitrogen balance by supplying the liver with substrates for protein synthesis and subsequently reducing the need for endogenous proteins from peripheral tissue.3
of the metabolic stress occurred after the 4th day of the onset of stroke, therefore patients with acute stroke must be considered to be reevaluated for energy-protein requirement after the 4th day.
In conclusion, in the intervention group, there was a slihgt increase in prealbumin level, while in the control group the prealbumin level was markedly decreased. The albumin level was decreased in both groups, but albumin level in the intervention group decreased less than the control group. In the intervention group, urinary creatinine excretion decreased significantly, but UUN and nitrogen balance did not show any improvement. Therefore, HPEN in a certain period was able to improve the protein status of acute stroke patients.
Acknowledgment
The authors would like to acknowledge the contribution of PT Sanghiang Perkasa for the financial support of this study. We also would like to thank Dr. Widjaja Lukito for his suggestions in conducting good clinical trial. We also gratefully acknowledge the staff members of the Department of Neurology for preparing and monitoring the enteral feeding. Finally, we are indebted to the patients who are willing to participate in this study.
REFERENCES
1. Gariballa SE, Parker SG, Taub N, Castleden CM. A randomized, controlled, single-blind trial of nutritional
suplementation after acute stroke. J Parenter Enteral Nutr 1998; 22 : 315-9.
2. Unosson M, Christina A, Bjurulf P, Von Schenck H, Larsson J. Feeding dependence and nutritional status after acute stroke. Stroke 1994; 25 : 366-71.
3. Heimburger DC, Weinsier RL. Handbook of Clinical Nutrition. 3rd ed. St Louis: Mosby; 1997.
4. Ranakusuma TAS, Soesanto I, Sjamsudin T, Shahab A, Nasution M. Nutritional support of patients with acute stroke. 2nd Clinical Nutrition Expert Meeting; 2000 Feb 25-26; Bali, Indonesia.
5. Laquatra I. Energy. In: Mahan LK, Arlin MT, eds.
Krause’s food, nutrition & diet therapy. 9th ed. Philadelpia: WB Saunders Company; 1996. p.17-30. 6. Finestone HM, Greene-Finestone LS. Nutrition and diet in
neurologic rehabilitation. In: Lazar RB, ed. Principles of neurologic rehabilitation. New York: McGraw-Hill; 1998. p.401-29.
7. Beck FK, Rosenthal TC. Prealbumin: a marker for nutrition evaluation. Am Fam Physician 2002; 65:1575-8.
8. Potter MA, Luxton G. Prealbumin measurement as a screening tool for protein calorie malnutrition in emergency hospital admissions: a pilot study. J Clin Invest 1999; 22:44-52.
9. Gibson RS. Assessment of protein status. In: Gibson RS. Principal of nutritional assessment. New Yok: Oxford University Press; 1990. p.307-48.
10. Davalos A, Ricart W, Gonzales-Huix F, Soler R, Marrugat J, Molins A, et al. Effect of malnutrition after acute stroke on clinical outcome. Stroke 1996;27:1028-32.
11. Gariballa SE, Sinclair AJ. Assessment and treatment of nutritional status in stroke patients. Post Med J 1998; 74:395-9.
12. Winkler MF, Manchester S. Nutritional care in metabolic stress: sepsis, trauma, burns, and surgery. In: Mahan LK,