I N T RODUCT ION
Paddy irrigation is used not only to supply water, but also to create various environmental effects, includ-ing groundwater recharge, purification of the polluted water, flood mitigation, nitrogen cycle control, mitigation of local climate, preservation of ecosystem, and so on. The effect of the paddy irrigation on the groundwater is one of the most important functions. Anan et al. (2007) quantified the effect of the paddy irrigation water on the ground water recharge. Groundwater is a very signifi-cant water resource for industry, agriculture, and the general population. Therefore, it is very important to monitor groundwater quality for preservation and purifi-cation purposes.
The paddy soil effect on the purification of irrigation water has been studied previously (Ogawa and Sakai, 1985; Ishikawa, 1992). However, the paddy irrigation effect on the groundwater quality has not yet been clari-fied. The objective of this study is to evaluate the effect of the paddy irrigation on the groundwater quality. The groundwater and the canal water qualities were sur-veyed in a 600 ha study site, which is located in Kyushu Island, southwest of Japan. The groundwater analysis and particle tracking were conducted to clarify the pol-lution source of the groundwater. Additionally, the con-taminant transport with the groundwater flow was simu-lated to predict the contaminant expansion.
F I EL D OB SERVAT ION Study site
To evaluate the effect of the paddy irrigation water on the groundwater quality, measurement and the simu-lation of the groundwater quality were conducted in a 600 ha study site, which is located on the left bank of the Chikugo River (Fig. 1). The Chikugo River flows in Kyushu Island (southwest of Japan), and the basin area and length of the Chikugo are about 2860 km2
and 143 km, respectively. About 60,000 ha paddy fields are supplied with irrigation water by this river. The south border of the study site is formed by a drainage canal. Irrigation water in the study site is supplied from Ohishi diversion weir. Following the permitted water right, a maximum 16 m3
/s of water is allowed to be diverted dur-ing the irrigation period. The irrigation period in the study site is from June to October.
Farmland areas in the study site accounted for about 380 ha. The paddy field, upland field, and fallow field areas were about 240 ha, 110 ha, and 30 ha, respectively. The remaining areas were used for residences, roads, and other urban uses.
Evaluation of the Effect of Paddy Irrigation on the Groundwater Quality
Kozue YUGE*, Mitsumasa ANAN1, Satyanto Krido SAPTOMO2 and Ken MORI3
Laboratory of Irrigation and Water Utilization, Division of Regional Environment Science, Department of Bioproduction Environmental Sciences, Faculty of Agriculture,
Kyushu University, Fukuoka 812–8581, Japan
(Received November 9, 2007 and accepted November 30, 2007)
The objective of this study is to evaluate the effect of the paddy irrigation on the groundwater quality. The groundwater and the canal water qualities are surveyed in a 600 ha study site, which is located in Kyushu Island, southwest of Japan. Total nitrogen (TN) of groundwater, irrigation canal water, and the drainage canal water are measured. The TN values of the groundwater are higher than the canal water. The measurement results indicate that the pollutant of the groundwater is transported from the outside of the study site. The groundwater flow simulation and particle tracking are conducted to clarify the pollution source of the study site. The results indicate that the groundwater quality is affected by the flow from the outside of the study site. The contaminant transport with the groundwater flow is simulated using the sim-ulation model to predict the contaminant expansion during a year. To clarify the effect of the paddy irriga-tion of the contaminant transport, the pollutant expansion is simulated under present land use condiirriga-tion, and the land use condition assuming that all paddy fields are used as the upland field. The simulation result indicated that the paddy irrigation prevents the diffusion of pollutant expansion.
1
Takasaki Sogo Consultant Co., Ltd. 2
Faculty of Agricultural Engineering, Bogor Agricultural University
3 Laboratory of Bioproduction and Environment Information Sciences, Division of Bioproduction and Environment Information Sciences, Department of Bioproduction Environmental Sciences, Faculty of agriculture, Kyushu University
* Corresponding author (E–mail: [email protected]–u.ac.jp) 209
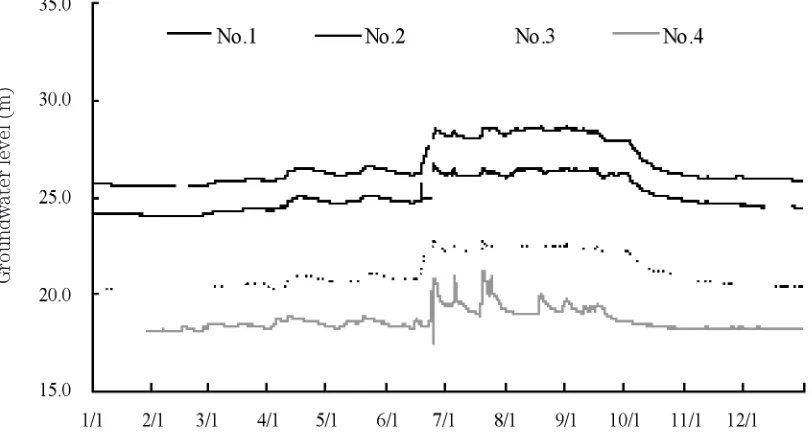
Groundwater and river water levels measurements There were four groundwater level gauges (No. 1 to No. 4) and four river water level gauges (No. 5 to No. 8) in the study site, as shown in Fig. 1. The diameters and depths of the observation wells were 0.15 m and 5.5 m, respectively. Water levels were recorded automatically in the data logger at one–hour intervals during the entire year. The distance between the wells and the river was 500 m to 700 m, except for the downstream well, which was 50 m from the Chikugo River. Figure 2 shows the observed groundwater levels during one year (2006). The groundwater levels at all wells increased abruptly when irrigation began. The maximum increases were from 2 m to 2.5 m during the irrigation period. When the irrigation period was complete, the groundwater level gradually decreased.
Groundwater and river water quality survey The groundwater was sampled in four points (shown in Fig. 1) every week or two. Additionally, the water
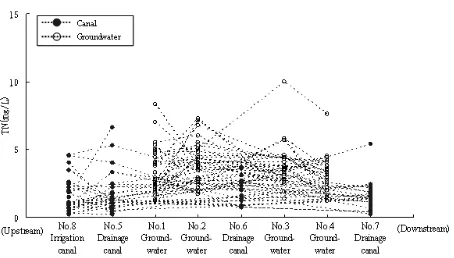
sampling was done at a drainage canal at No. 5, No. 6, and No. 7 (shown in Fig. 1). Irrigation water was sam-pled at No. 8 (shown in Fig. 1). Total nitrogen (TN) was measured by the persulfate digestion method. The peri-od of survey was from 27th November 2005 to 19th December 2006. The TN measurements are shown in Fig. 3. Additionally, the precipitation during this period is shown in Fig. 4
The TN of the downstream drainage canal is larger than the upstream. The values of the drainage canal water are lower than the groundwater values. The TN of the groundwater changes drastically during the non–irri-gation period, compared with the values of the irrinon–irri-gation period.
Figure 5 shows the spatial changes of TN. The ten-dencies of the water quality variation from the upstream to the downstream are not shown in this figure. The result indicates that the pollutant of the groundwater is transported from outside of the study site.
Fig. 2. Changes of the groundwater levels at the 4 observation wells.
Fig. 3. Changes of the total nitrogen of groundwater and canal water.
Fig. 4. Daily precipitation of the study site.
M ET HODL OGY h is sectional length of the groundwater flow or the satu-rated thickness (m); x, y, and z are the rows, columns, and layers of the modeled system, respectively; Q is the infiltration of water from surface (m/d); and L is the out-flow rate from the region (m/d) (McDonald and Infiltration of water from surface Q (m/d) can be calcu-lated by substituting R, A, E, and O for eq. (2).
In the calculation, the land use conditions were clas-sified as paddy fields, upland fields, and residential areas. Most of the fallow fields were classified as upland fields. The ponded fallow fields used for weed control were classified as paddy fields.
During the irrigation period (from June 1 to September 30), the amount of the irrigation water A was set as 30 mm/d, which was observed as the lot water requirement reported by Anan et al. (2004). Like the paddy fields in the non–irrigation period, the other land during one year did not take in water, so irrigation water A was assumed to be 0.
The Kc of the rice paddy in Kyushu Island, including the study site, was estimated during the paddy growth period by National Agricultural Research Center for Kyushu Okinawa Region (1999). ETp was estimated by the Penman method:
ETp= +
f
(
u
2)(
e
sa–
e
a)
(4)where Rnet is net radiation (MJ/m2
), l is latent heat of vaporization of water (MJ/kg), Δ is rate of change of sat-uration vapor pressure with temperature (hPa/deg), γ is psychrometer constant (hPa/deg), ea is partial pressure of water vapor in air (hPa), esa is saturation vapor pres-sure of water vapor (hPa), and f(u2) is wind function described using the wind velocity at 2 m height u2 (m/s). The meteorological data stated as above is obtained from Amagi weather station.
Runoff O was calculated as a fraction of rainfall by the following equation:
O=aR (5)
where a is the runoff coefficient. The average values of a in paddy, upland, and residence are assumed were 0.7, 0.52, and 0.9, respectively. During the non–irrigation period, a of paddy fields was replaced by 0.52. The pre-cipitation R was obtained from the weather station data-base. tracking method. Contaminants are transported in groundwater by advection, i.e., the movement of a solute at the speed of the average linear velocity of groundwa-ter (v).
v=K/ne (6)
where K is the hydraulic conductivity tensor and ne is the effective porosity.
Particles are tracked along pathlines by solving dx/dt=νx (7a) dy/dt=νy (7b) dz/dt=νz (7c) A semianalytical solution of eq.(7) is possible if a lin-ear velocity interpolation scheme is used. Then the solu-tion of eq.(7a) can be described as follows:
xp=x1+(1/A)・νxp・exp(AxΔt) – νx2 (8)
Fig. 5. Spatial variation of the total nitrogen.
Δ
Δ
+
γ Δγ+
γcell. In eq.(8), x is the x coordinate of the edge of the cell and xp is calculated directly from eq.(8).
Contaminant transport
To predict the pollutant expansion with the ground-water flow, the contaminant transport simulation was conducted. The governing equation of the contaminant transport pollutant of the groundwater can be described as follows:
– (νiC)+
(
Dij)
–λ(
C+
b)
±
Cs=R (10)
where C is the concentration, Dij is the diffusion tensor, R is the retardation factor, S is the sorbed, qs is the flow,
θ is the volumetric water content, is the density, and
ν is the groundwater velocity. Each term describes the advection, dispersion, reaction, sink (or source), and retardation, respectively.
R ESU LTS A N D DI SCUS SION Flow pathlines estimation
The groundwater flow simulation and the particle tracking were conducted using the MODFLOW.
The particles were set at the south and east ends of the study site to clarify the pollution source of the groundwater, as shown in Fig. 7. Figure 8 shows the result of the particle tracking. The flow paths are bent toward to the Chikugo River, at the vicinity of No. 1. At the upstream part of No. 2, the particles set at the south
part of the study site run the length of the study site. And at the downstream of No. 2, the particles gradually move toward the Chikugo River. The result indicates that the groundwater quality in the study site is affected by the south land use condition.
Effect of the paddy irrigation on the contaminant transport
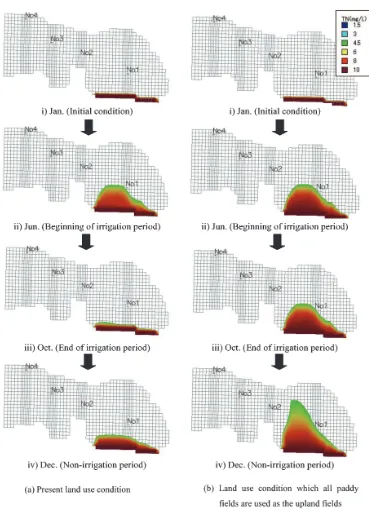
The contaminant transport simulation was conduct-ed using the advection and dispersion terms describconduct-ed in eq.(10), and the other terms are neglected. To clarify the effect of the paddy irrigation of the contaminant transport, the pollutant expansion was simulated under present land use condition, and the land use condition assuming that all paddy fields are used as the upland field. Figure 9 shows the concentration condition using the simulation. Considering the land use condition out of the study site, a high–concentration load was given to the area shown in Fig. 9. This area is categorized as the residential area and the orchard. The changes of the concentration distribution simulated by this method are shown in Fig. 10. The simulation was conducted during a year. In the study site, the irrigation period starts in June 1, and goes to September 30. Figure 9 shows that, under the present land use condition, the diffusion is prevented from June to October, because the paddy irri-gation water recharges the groundwater, and the groundwater flow is active. In December, the groundwa-ter level is at the lowest of the year, and the pollutant is transported gradually toward the Chikugo River.
Fig. 7. Positions of the particles for tracking. Fig. 9. Position of the pollution source.
∂ ∂xi
qs
θ
∂C
∂xj
∂ ∂xj
∂C
∂t
S
θ
Fig. 6. Schematic view of the particle tracking.
Under the land use condition assuming that all paddy fields are used as the upland field, the pollutant expansion in June is remarkable because there is no the groundwater recharge by the paddy irrigation. The area of the pollutant transport is larger than the one under the present land use condition. In October, the pollut-ant reaches around No. 1. The pollutpollut-ant is transported near the Chikugo River in December.
CONCLUSIONS
To evaluate the effect of the paddy irrigation on the groundwater quality, the groundwater and the canal water qualities were surveyed. The measurement result
indicated that the TN of the groundwater is higher than that of the irrigation and drainage canal water during the irrigation period. The effect of paddy irrigation on the groundwater quality could not be verified. The result indicates that the pollutant of the groundwater is trans-ported from the outside of the study site.
Groundwater flow simulation and particle tracking were conducted in the study site to clarify the pollution source of the groundwater. The result indicated that the groundwater quality was affected by the flow from the outside of the study site. The management of the groundwater quality should be conducted at the south part of the study site.
The contaminant transport was simulated to predict
the contaminant expansion during a year. To clarify the effect of the paddy irrigation of the contaminant trans-port, the pollutant expansion was simulated under present land use condition, and the land use condition assuming that all paddy fields are used as the upland field. The simulation result indicated that the paddy irri-gation is effective for not only the groundwater recharge, but also for the prevention of the expansion of the groundwater pollution and preservation of the Chikugo River water quality.
The method introduced in this study is effective for the clarification of the pollution source of the groundwa-ter, and the prediction of the pollutant expansion of the groundwater.
R EF ER ENCES
Anan, M, K. Yuge, Y. Nakano, T. Funakoshi and T. Haraguchi 2004 The relationship between water intake rates, paddy ponding depth, and farmers’ water management techniques,
Paddy and Water Environment, 2(1): 11–18
Anan, M., K. Yuge, Y. Nakano, S. K. Saptomo and T. Haraguchi 2007 Quantification of the effect of rice paddy area changes on recharging groundwater, Paddy and Water
Environment, 5(1): 41–44
Bair, E. S., Sheets, R. A., and Eberts, S. M. 1990 Particle– tracking analysis of flow paths and travel times from hypo-thetical spill sites within the capture area of a wellfield,
Ground Water, 28(6): 884–892
Eberts, S. M., and Bair, E. S. 1990 Simulated effects of quarry dewatering near a municipal well field, Ground Water, 28(1): 37–47
Ishikawa, M., Tabuchi T., Yamaji E., and Nakajima J. 1992 Influence of concentration of nitrogen and percolation on water quality purification and growth of rice, Transactions of the Japanese society of irrigation, drainage and
recla-mation engineering, 159: 91–99 (in Japanese)
McDonald, M. G. and Harbaugh, A. W. 1988 A modular three–
dimensional finite–difference ground water flow model.
Techniques of water–resources investigations of the U. S. Geological Survey, Book 6
National Agricultural Research Center for Kyushu Okinawa Region 1999 Research Bulletin of the National Agricultural Research Center for Kyushu Okinawa Region, 14: 553–554 (in Japanese)
Ogawa, Y. and Sakai, K. 1983 Effects of nitrate enrichment of irrigation water on nitrogen balance in a paddy field,
Journal of the science of soil and manure, Japan, 56(1):
1–9 (in Japanese)