DOI 10.1007/s10333-006-0059-1 A RT I C L E
Quantification of the effect of rice paddy area changes
on recharging groundwater
Mitsumasa Anan·Kozue Yuge·Yoshisuke Nakano· Satiant Saptomo·Tomokazu Haraguchi
Received: 20 December 2005 / Accepted: 30 October 2006 / Published online: 20 January 2007
C
Springer-Verlag 2006
Abstract This study quantifies the effects of paddy irri-gation water on groundwater recharge. A numerical model of groundwater flow was conducted using MODFLOW in a 600 ha study site in an alluvial plain along the Chikugo River, located in southwestern Japan. To specify the surface boundary condition, data on the land use condition stored in the GIS database were transferred into a numerical model of groundwater flow. The simulated results were consistent with the observed yearly changes of groundwater level. Thus, it was appropriate to use the model to simulate the effects of paddy irrigation on groundwater. To quantify these effects, the groundwater level was simulated during the irrigation period when all farmlands in the study site were ponded. In this situation, the groundwater level was 0.5 to 1.0 m higher, the ground water storage 20% larger, and the return flow of the groundwater to the river 50% larger than in the present land use condition.
Keywords Numerical model . GIS application . Land use condition . Groundwater storage . Return flow to river
M. Anan ()
Takasaki Sogo Consultant Co. Ltd.,
3-7-5 Higashiaikawa, Kurume-Shi, Fukuoka 839-0809, Japan e-mail: [email protected]
K. Yuge·Y. Nakano
Faculty of Agriculture, Kyushu University,
6-10-1 Hakozaki, Higashi-Ku, Fukuoka-Shi, Fukuoka 812-8581, Japan
S. Saptomo
Faculty of Agricultural Technology, Bogor Agricultural University,
Kampus IPB Darmaga, Bogor 16680, Indonesia T. Haraguchi
Faculty of Agriculture, Saga University, Honjo-cho, Saga-Shi, Saga 840-8502, Japan
Introduction
Paddy irrigation has multiple functions. It is used not only to supply water, but also to create various environmen-tal effects including groundwater recharge, flood mitiga-tion, nitrogen cycle control, mitigation of local climate, carbon sequestration, etc. Ground water recharge is one of the most significant contributions of irrigation to the environment.
The area of the paddy field has drastically de-creased due to rice production regulation in Japan. Approximately 40% of regulated fields are used pri-marily for upland crop production. Additionally, about 10% of total agricultural fields are now residential ar-eas, factories, or roads. These drastic changes of the land use condition have affected groundwater level formation.
Researchers have studied the relationship between groundwater and irrigation. Effects of irrigation on the groundwater quality were reported by Knisel and Leonard (1989). A simulation model to analyze the effects induced by different rice irrigation management schemes on ground-water levels was created by Saleh et al. (1989). An integrated water management model for decision-making in irrigation water management, used to maintain the groundwater table, was developed by Kumar and Singh (2003). The groundwa-ter flow and recharge under paddy areas was examined by Walker and Rushton (1984), Bouman et al. (1994), Tuong et al. (1994), Elhassan et al. (2001), Chen and Liu (2002), and Chen et al. (2002). These studies revealed significant ef-fects of irrigation on groundwater; however, the effect of the land use condition on the groundwater recharge was unclear.
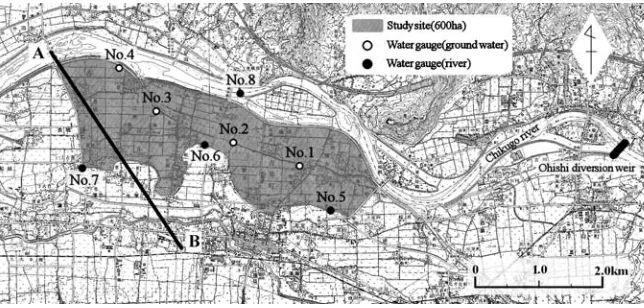
Fig. 1 Map of study site (Line A-B shows geological section in Fig.2)
evaluation of the influence of the land use condition on the groundwater recharge. The groundwater analysis was conducted using MODFLOW (McDonard and Harbaugh 1988). MODFLOW is one of the most frequently used models in groundwater hydrology (Anderson and Woess-ner 1992; Lieuallen-Dulam and Sawyer 1997). A numer-ical model of groundwater flow using MODFLOW was conducted in a study site to quantify the groundwater recharge by paddy irrigation. To specify the surface bound-ary condition, data on the land use condition stored in the GIS database were transferred into the groundwater model.
Study site
Geography and geological feature
A groundwater analysis was conducted in a 600 ha study site located on the left bank of the Chikugo River (Fig.1). The Chikugo flows in Kyushu island (southwest of Japan). The basin area and length of the Chikugo are about 2860 km2
and 143 km, respectively. About 60,000 ha paddy fields are supplied with irrigation water by this river. The south border of the study site is formed by the Mitsuru river, which is used as a drainage canal. Irrigation water in the study site is supplied from Ohishi diversion weir. Following the permitted water right, a maximum 16 m3/s of water is allowed to be
diverted during the irrigation period.
The study site is located between two mountain ranges. The alluvial plain, around 6 km width, was formed along the river about five million years ago. The schematic view of the geological condition around the study site is shown in Fig.2. The study site is classified as a flood plain, result-ing from the frequent floodresult-ing of the Chikugo. A relatively shallow layer is composed of gravel and sand; unconfined groundwater is formed in this layer. As shown in Fig.2, there is an impermeable layer of clay at about 10 m to 13 m below the ground surface.
30.0
20.0
10.0
0.0
-10.0
0.0 1000.0
Sand gravel
Sand gravel with pebble
Clay
Distance(m) Elevation (m)
A
B
2000.0 3000.0 4000.0
Fig. 2 Schematic view of the geological conditions across the study site (Line A-B in Fig.1)
Observation of water levels
There were four groundwater level gauges (No. 1 to No. 4) and four river water level gauges (No. 5 to No. 8) in the study site, as shown in Fig.1. (The type of the water level gauge used in this study was SS-202-2M-30.) The diameters and depths of the observation wells were 0.15 and 5.5 m, respectively. Water levels were recorded automatically in the data logger at 1-h intervals during the entire year. The distance between the wells and the river was 500 to 700 m, except for the downstream well, which was 50 m from the Chikugo river.
Historical changes of agricultural conditions
Table 1 Land use changes in Yoshii Town during the past 30 years Unit: ha Paddy field
Fallow
paddy field Upland field Residence
1970 1,111 187 79 166
1980 1,061 193 60 264
1990 910 246 62 285
2000 708 218 55 317
condition has drastically changed in this area following the administrative policy of rice production during the last 30 years. The paddy field areas have decreased, and the per-centage of (paddy) fields used for producing upland crops, such as soybean, eggplant, and various vegetables during the summer irrigation period, has been gradually increas-ing. Some paddy fields lie fallow because of the agricul-tural labor shortage; fallow fields have been gradually in-creasing. Additionally, the residential area has increased during the past 30 years, so there is a large demand for domestic water in this area. The uses of irrigation wa-ter have also been affected by the change of the land use conditions.
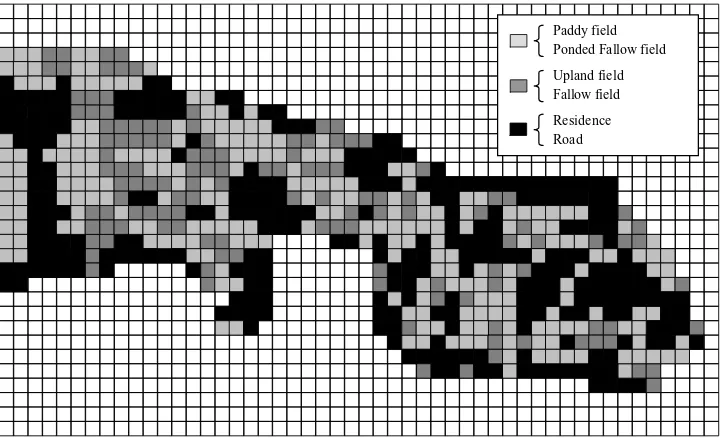
The investigated land use condition of the study site in 2001 is shown in Fig. 3. Using the geographic in-formation system software (GIS), the land use condi-tions were estimated with a resolution of 100 m squares. The land uses were classified into four categories: paddy fields, upland fields, residential areas, and roads. Farm-land areas in the study site accounted for about 380 ha. The paddy field, upland field, and fallow field areas were about 240, 110, and 30 ha, respectively. The remaining areas were used for residences, roads, and other urban uses.
Methodology
Governing equation
MODFLOW was used for groundwater analysis. In this model, groundwater flow can be described using a three-dimensional equation as
S∂H
∂t =
∂ ∂x
kxh
∂H
∂x
+ ∂ ∂y
kyh
∂H
∂y
+ ∂ ∂z
kzh
∂H
∂z
+Q+L (1)
whereSis the effective porosity (−);His the hydraulic head (m);tis the time (d);kis the hydraulic conductivity (m/d);his the sectional length of the groundwater flow or the saturated thickness (m);x,y, andzare the rows, columns, and layers of the modeled system, respectively;Qis the infiltration of water from surface (m/d); andLis the outflow rate from the region (m/d) (McDonard and Harbaugh1988).
Initial condition and boundary conditions
The initial groundwater levels at all nodes are given as the initial condition. These values were estimated from ground-water levels measured in the observation wells (Fig.1) and from the contour map, interpolating between the known lev-els.
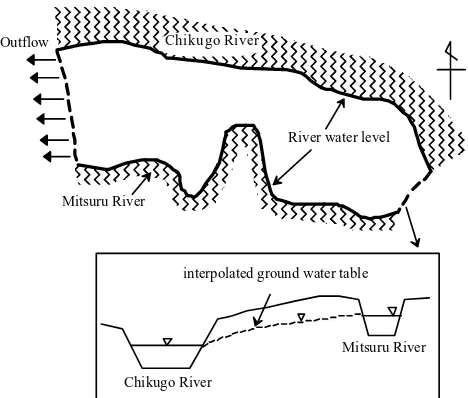
Figure4shows a schematic of the boundary conditions. Northern and southern boundaries are specified by the water levels of the Chikugo and Mitsuru rivers, respectively. Using observed river water levels with four gauges and longitudi-nal slopes of the riverbeds, the river water levels at nodes
Paddy field Ponded Fallow field
Upland field Fallow field
Residence Road
Mitsuru River
Chikugo River
River water level
Mitsuru River
Chikugo River
interpolated ground water table Outflow
Fig. 4 Schematic view of the boundary conditions
were estimated and used as specified head boundaries. At the eastern ends, the groundwater tables were interpolated by the water levels of the Chikugo and Mitsuru rivers. At the western ends, the flow boundary was specified as the general head boundary.
Recharge boundary condition
The water balance at the ground surface can be described as
(R+A)−(E+O+Q)=0 (2)
where R is precipitation (m/d), A is irrigation (m/d), E is evapotranspiration (m/d), andOis runoff (m/d). Infiltration of water from surfaceQ(m/d) can be calculated by substi-tutingR,A,E, andOforEq. (2).
In the calculation, the land use conditions are classified as paddy fields, upland fields, residential areas, and road areas. Most of the fallow fields were classified as upland fields. The ponded fallow fields used for weed control were clas-sified as paddy fields. When rainfall was less than 5 mm/d, the infiltration of waterQin the upland field was set as 0 because the rainfall or irrigation water was consumed by the evapotranspiration. Also, the infiltration is assumed as 0 in the residential and road areas.
During the irrigation period (from June 1 to September 30), the amount of the irrigation waterAwas set as 30 mm/d, which was observed as the lot water requirement reported by Anan et al. (2002). The irrigation water demand was great because the amount of paddy field infiltration was significant. As the study site was in the flood plain originating from the Chikugo river, the ground surface layer was classified as the sand gravel or gravel (Fig.2), and the soil water conductance
was high. Like the paddy fields in the nonirrigation period, the other land during one year did not take in water, so irrigation waterAwas assumed to be 0.
EvapotranspirationEinEq. (2)was calculated as
E =KcE Tp (3)
where Kc is the crop coefficient andETp is the reference
evapotranspiration.
TheKcof the rice paddy in Kyushu island, including the
study site, was estimated during the paddy growth period by National Agricultural Research Center for Kyushu Okinawa Region (1999).ETp was estimated by the Penman method
as
E Tp=
+γ
Rnet
l +
γ
+γ f(u2)(esa−ea) (4)
whereRnetis the net radiation (MJ/m2),lis the latent heat
of vaporization of water (MJ/kg), is the rate of change of saturated vapor pressure with temperature (hPa/deg),γis the psychrometer constant (hPa/deg),ea is the partial
pres-sure of water vapor in air (hPa),esa is the saturation vapor
pressure of water vapor (hPa), andf(u2) is the wind function
described using the wind velocity at 2 m heightu2(m/s). The
meteorological data stated as above is obtained from Amagi weather station.
RunoffOwas calculated as a fraction of rainfall by the following equation:
O=a R (5)
whereais the runoff coefficient. The average values ofain paddy, upland, residence, and road areas are assumed as 0.7, 0.52, 0.9, and 0.85, respectively (Japan River Association 1997). During the nonirrigation period, a of paddy fields was replaced by 0.52. The precipitationRwas obtained from the weather station database.
Figure5shows the simulation model introduced by cou-pling the ground water analysis and the land use information. To specify the surface boundary conditions at all nodes, data on the land use condition stored in the GIS database were transferred into the groundwater model using MODFLOW by two dimensional.
Results and discussion
Model accuracy
Paddy field
Fig. 5 Schematic view of simulation model for ground water analysis coupled with land use information
100 m2. The finite difference method was used to solve the
governing equation in MODFLOW. The calculation was pur-sued with the Bi-Conjugate Gradient Stabilized method. The initial conditions were set using data from 1 January 2001. Boundary conditions were specified by daily average data from 1 January to 31 December. The size of time step (t) was reduced any time during the simulation, computed by MODFLOW code as the simulation progressed (McDonard and Harbaugh1988). This code computes the initial time step using the number and the multiplier of time step specified by the users.
As calculation groundwater levels agreed with those ob-served at four points, the model’s parameters, which were hydraulic conductivity and effective porosity, were in accor-dance with the observed boundary conditions.
Figure 6 shows the comparison between observed and simulated groundwater levels during one year. The ground-water levels at wells No. 1, No. 2, and No. 3 increased abruptly when irrigation began. The maximum increases were from 2 to 2.5 m during the irrigation period. When the irrigation period was complete, the groundwater level gradually decreased. The change in the groundwater level at well No. 4 between the irrigation and the nonirrigation pe-riods was unremarkable. This well was affected by the river water level because of its proximity to the Chikugo river at 50 m. The root mean squared error in this estimation was
1/1 3/1 5/1 7/1 9/1 11/1 12/31
Fig. 6 Comparison of simulated and observed daily groundwater lev-els at the four observation wells
12%; there were some errors in the irrigation period as to the peak of groundwater levels. Possible causes of these errors were the geologic features, which were too complicated to capture completely. These results indicated that it was ap-propriate to use this model to simulate the contribution of paddy irrigation to groundwater.
Groundwater movement during one year
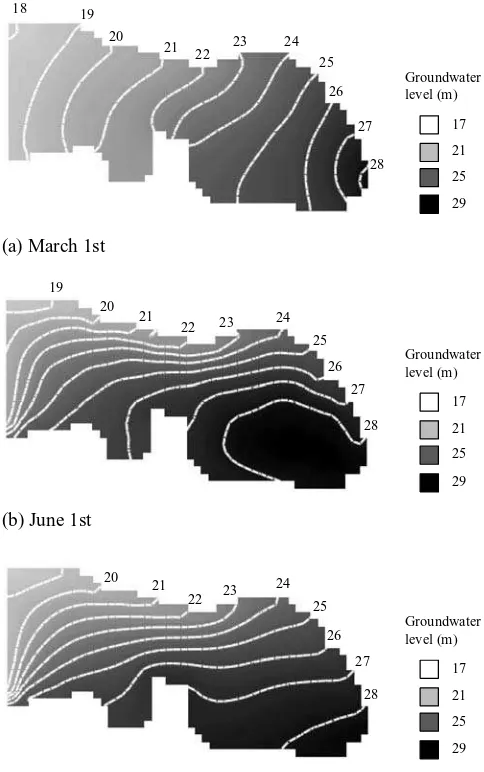
Figure 7 shows the changes of the spatial distribution of the groundwater level with the paddy irrigation schemes. During the nonirrigation period, contours crossed the river boundary at a right angle (Fig. 7a). Figure 7b shows the spatial distribution of the groundwater level at the begin-ning of the irrigation period. The bended contours indicate that the groundwater flow was obviously affected by the irrigation water. The groundwater level was higher at the up-ward fields than at the downup-ward fields. Figure7cshows the groundwater contours of the middle irrigation period. The densely formed contours indicate that the hydraulic gradient was high. In the irrigation period, the groundwater level rose rapidly and was higher than river water level. As a result, the groundwater flows to the river decreased. Thus, a large amount of groundwater returned to the Chikugo and Mitsuru rivers.
Contribution of paddy fields to groundwater storage
Groundwater recharge
Groundwater
Fig. 7 Spatial distribution of the groundwater level with the paddy irrigation schemes
Figure8shows the groundwater levels when the present land use condition was maintained and all farmlands were ponded during the irrigation period. As shown in Fig.8, differences in the groundwater level between both situations occurred in
1/1 3/1 5/1 7/1 9/1 11/1 12/31
Present land use condition Irrigation in all farmlands
Fig. 9 Groundwater storage for the present land use condition. All farmlands were ponded during the irrigation period
wells No. 1 and 3 as soon as irrigation began. The maximum difference of the groundwater level ranged from 0.5 to 1.0 m. The difference in the groundwater level was greater at the downward well because the groundwater inflow from the up-ward fields increased. The difference was not apparent in the No. 4 well. This indicates that the groundwater at the No. 4 well was recharged by water from the nearby Chikugo river. Figure9shows the total amount of groundwater retained in the permeable layer. The volume of storage was transformed from the saturated thickness calculated daily. In the present land use condition, about 2.5 million m3water was stored as
groundwater. When all farmlands were irrigated, the storage groundwater was estimated at about 3.0 million m3.
Considering that the residential area has increased around the study site, the additional storage water could supply the domestic water demand. Additionally, storage water could be used for rural life, fire fighting, snow clearing, amenity, and recreation.
Return flow of groundwater to the river
Figure 10shows the return flow from groundwater to the Chikugo and the Mitsuru rivers, or the amount of water flowing out in the north and south sides, calculated when the
1/1 3/1 5/1 7/1 9/1 11/1 12/31
Present land use condition
Irrigation in all farmlands
1/1 3/1 5/1 7/1 9/1 11/1 12/31
Return flow rate (
×
10
3m 3/d)
Present land use condition Irrigation in all farmlands
Fig. 10 Return flow rate of groundwater from the study site to the river. Established land use condition was maintained and all farmlands were ponded during the irrigation period
present land use condition was maintained and all farmlands were irrigated.
At present, 20,000 m3/d water flows to the rivers in the
irrigation period. This is equal to 20% of the water require-ment of 240 ha paddy fields in the study site, assuming that the water requirement is 30 mm/d. The return flow to the rivers increases up to 30,000 m3/d water when all farmlands
are irrigated. To the south of this site is a mountain chain; the topography slants to a south–north direction. Some small rivers and canals flow from the mountain to the Chikugo river. Therefore, almost all of the groundwater would stream toward the Chikugo river. Increased return water to the river could be used for irrigation or domestic and industrial use.
Conclusions
To evaluate the effect of the land use condition on groundwa-ter recharge, the simulation model was introduced by cou-pling the groundwater analysis using MODFLOW and the land use information using GIS. Model accuracy was gauged by the groundwater levels observed at four observation wells. The results calculated with present land use condition during one year were relatively consistent with the observed data. The groundwater levels increased abruptly when irrigation began. The maximum increases were from 2 to 2.5 m dur-ing the irrigation period. When the irrigation period ended, the groundwater levels gradually decreased. This indicates that the paddy field irrigation affected the groundwater level. The simulation model introduced here was appropriate for simulating the effects of paddy irrigation on groundwater.
Using this model, the groundwater level was simulated, assuming that all farmlands in the study site were paddy fields. The groundwater level in this situation was about 0.5– 1.0 m higher than established conditions. After 40% of the fields became upland fields or wild lands, the groundwater storage increased by about 20%. Additionally, the return flow
of the groundwater to the rivers increased by about 50% when all farmlands in the study site were irrigated. These results indicate that the paddy irrigation water was an important local water resource. Because the number of fallow fields in Japan is increasing, ponding could significantly contribute to groundwater recharge. Paddy irrigation should be planned with regard to not only paddy production, but also to water resource conservation.
Acknowledgements The authors express their deep appreciation to the project staff of the Ministry of Agriculture, Forestry, and Fisheries of Japan for their cooperation.
References
Anan M, Yuge K, Nakano Y, Funakoshi T, Haraguchi T (2002) Study on the actual and optimum water use in Ohishi diversion weir command area (1). Sci Bull Fac Agr, Kyushu Univ 56(2):171–178 (in Japanese)
Anderson MP, Woessner WW (1992) Applied groundwater modeling simulation of flow and advective transport. Academic, New York Bouman BAM, Wopereis MCS, Kropff MJ, ten Berge HFM, Tuong TP (1994) Water use efficiency of flooded rice fields. (II) Percolation and seepage losses. Agric Water Manage 26:291–304
Chen SK, Liu CW (2002) Analysis of water movement in paddy rice fields. (I) Experimental studies. J Hydrol 260:206–215
Chen SK, Liu CW, Huang HC (2002) Analysis of water movement in paddy rice fields. (II) Numerical simulations. J Hydrol 265:259– 271
Elhassan AM, Goto A, Mizutani M (2001) Combining a tank model with a groundwater model for simulating regional groundwa-ter flow in an alluvial fan. Trans Jpn Irrig Drain Reclam Eng 69(5):583–591
Japan River Association (1997) Manual of river works in Japan. Sankaido, Tokyo (in Japanese)
Knisel WG, Leonard RA (1989) Irrigation impact on groundwater: model study in humid region. J Irrig Drain Eng 115(5):823–838 Kumar R, Singh J (2003) Regional water management modeling
for decision support in irrigated agriculture. J Irrig Drain Eng 129(6):432–439
Lieuallen-Dulam KK, Sawyer CS (1997) Implementing intrawell, inter-cell flow into finite-difference ground-water flow model. J Hydrol Eng 2(3):109–112
McDonard MG, Harbaugh AW (1988) A modular three-dimensional finite-difference ground water flow model. Techniques of water-resources investigations of the US. Geological survey, book 6 Ministry of Agriculture, Forestry and Fisheries (1971, 1981, 1991,
2001) Agricultural census. Association of agriculture and forestry statistics (in Japanese)
National Agricultural Research Center for Kyushu Okinawa Region (1999) Research bulletin of the National Agricultural Research Center for Kyushu Okinawa region. 14: 553–554 (in Japanese) Saleh AF, Steenhuis TS, Walter MF (1989) Groundwater table
sim-ulation under different rice irrigation practice. J Irrig Drain Eng 115(4):530–544
Tuong TP, Wopereis MCS, Marquez JA, Kropff MJ (1994) Mechanisms and control of percolation losses in irrigated puddle rice fields. Soil Sci Soc Am J 58:1794–1803