ISSN 0854-8587
Quantitative Trait Loci (QTL) Analysis for Production Traits of Birth
Weight and Weight 360 days in Backcross Sheep
ENDANG TRI MARGAWATI1*, HERMAN WILLEM RAADSMA2, HARIMURTI MARTOJO3,
SUBANDRIYO4, MULADNO3
1Research Centre for Biotechnology, the Indonesian Institute of Sciences, Jalan Raya Bogor Km. 46, Cibinong 16911 2Faculty of Veterinary Science of the University of Sydney, Australia
3Department of Animal Production, Bogor Agricultural Institute, Darmaga Campus, Bogor 16680 4Research Institute for Animal Production, Jalan Raya Pajajaran, P.O. Box. 308, Bogor 16003
Diterima 23 Maret 2005/Disetujui 15 Maret 2006
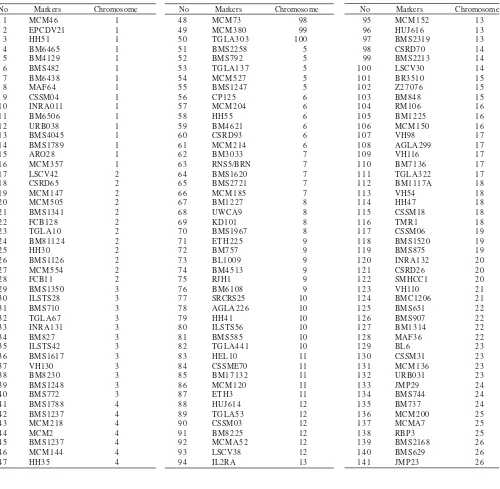
Four half-sib families (n = 382) consisting predominantly of ITT x Merino x Merino backcross progeny, including some F2 progeny were used to analyze QTL for two production traits (Birth weight = BW1 and Body weight at 360 days = BW360). The study exploited differences in weight performance between the Merino and ITT sheep. A total of 141 informative microsatellite markers were used in a genome-wide scan covering the 26 autosomal sheep chromosomes. QTL analysis was conducted online using QTL Express. This study reports the effect of QTL for birth weight on Chromosomes 5 (p < 0.05) at 112cM (0cM-128cM). Location of candidate genes for birth weight was predicted at the region of flanking markers MCM527-BMS1247. A QTL for BW360 days existed on Chromosome 18 (p < 0.01) at 104cM (25.0-125cM). Location of candidate genes related to production traits for body weight 360 days was predicted at the segment of flanking markers of CSSM018-TMR1. Only the QTL on Chromosome 18 retained significance (p < 0.01) under experiment-wide significance testing. This QTL region is being examined for candidate genes by investigating to the homologous human chromosomal segments.
Key words: Quantitative trait loci, production traits, birth weight, weigh 360, backcross sheep
___________________________________________________________________________
_________________
∗ ∗ ∗ ∗
∗Penulis untuk korespondensi, Tel. +62-21-8759300,
Fax. +62-21-8754587, E-mail: [email protected] INTRODUCTION
Currently there is much interest in the use of molecular markers to analyze the genetic basis of quantitative or complex traits. Development of large numbers of molecular markers and internal-mapping methods furnished the means of quantitative trait loci (QTL) mapping for identification of economic traits in livestock population. Current research in identification of any species has used polymorphic molecular markers. The marker has capability in looking for inheritance from genome segment of a pedigree. There is obviously correlation between the inheritance of specific marker allele and measured quantitative traits (Haley 2000). There is linkage between genetic markers to certain genes for production traits (Kinghorn & van der Werf 2000). Molecular approaches firstly have been applied in plant to determine QTL controlling the differences genetically among lines (Paterson et al. 1988). Last decade in animal livestock, it has been identified for milk production traits in Holstein population (Georges et al. 1995) and nowdays has been studied within inbred and outbred population.
As stated by Kinghorn and van der Werf (2000) that genotyping animal with a number of genetic markers is an investation in breeding to analyze accurately genetic traits of animals that have genetic merit. Application of molecular biology and biotechnology towards animal breeding to accelerate development and solve the problems for production
improvement called as molecular breeding. Recent inprovement in breeding was dominated by advanced technology and science (Kinghorn & van der Werf 2000) and even conducted by large industries. Advances in computerizing have provided software for QTL analysis such as online QTL Express. Seaton et al. (2002) suggested that a suitable population for QTL analysis is halfsib outbred population which consists of many sires with each sire generates a number of offspring or F2 population originated from crossing between inbred or outbred. Mapping QTL in crossing between lines which different genetically has shown availability of many QTL, that also happens within animal population. QTL analysis provides information associated with a number of genes that plays a role in complex traits or polygenic genes, QTL location, and the effect of genes. QTL data provides worth knowledge in a number of interested genes affecting interest and economic traits in livestock and gene position on chromosomes and strength of each QTL.
MATERIALS AND METHODS
Reference Families and Backcross Population. Four reference families (F1 Sires of 1261, 1262, 1263, and 1273) were designed to establish a number of 382 halfsib backcross progeny population. Crossing of two differences genetically was suggested for QTL studies (Evans et al. 2003). Therefore this study involved ITT sheep which presented a small type while Merino as a large type in body weight. A large population of sheep is needed for QTL study in term to map a specific chromosomal region when the location of genes has not been known (Cockett et al. 2001; Raadsma et al. 2002).
Genomic DNA. Individual DNA of the population was collected based on a modified method of Montgomery and Sise (1990). The modification was performed in reagent concentrations and the dye as we used a Li-COR DNA Analyzer Gene ReadIR 4200. DNA was also collected from all F1 Sires (ITT x Merino), all their GrandSires and GrandDams.
Polymerase Chain Reaction (PCR). DNA was amplified by 35 cycles of PCR. A robotic PCR (Beckman) machine and a manual MJ PCR Machine were used to accelerate the PCR works. The same PCR program was designed to all markers, the program was set up as follows: warm up the machine at
95 oC for 5 minutes, denaturation at 95 oC for 45 seconds,
annealing at 58 oC for 90 seconds, extension 72 oC for 60
seconds and kept at 4 oC until being used. The reagent was
prepared in the laboratory with composition as follows:
10x NZ buffer 1 µl, MgCl2 (2.5 mM-25 mM) 1 µl, dNTP 200 µm
0.4 µl, IR 700 (dye) 1 pmol/µl 0.2 µl, Forward primer 0.8 pmol/ reaction 0.04 µl, Reverse primer 0.8 pmol/reaction 0.04 µl,
ddH2O 7.28 µl, Taq Zung32 (5 units) 0.08 µl.Each individual
DNA sample of 1 µl (DNA template) needed 10 µl PCR reagent for PCR running.
Genotyping and Microsatellite Markers. A number of 250 preselection polymorphic microsatellite markers were screened to get informative markers. A number of 141 informative markers out of 250 were obtained from the marker screening. Those informative markers were used for a genome-wide scan covering the 26 autosomal sheep chromosomes and called genotyping (to genotype allele). Allele scorring was carried out by at least two researchers (Crawford et al. 1995) or using a specific software. Genotyping was conducted using a semi-automatic Li-COR DNA Analyzer Gene ReadIR 4200. A number of 3 to 16 markers for each chromosome were used for marker analysis (Table 1).
Phenotyping. Quantitative measurements of birth weight
(BW1) and weight at age of 360 days (BW360) were conducted
to all backcross progeny that collected from 1999 to 2002. Four reference families were established within four years in
four periodes and weights were measured twice (i.e., BW1
and BW360) for each year. Therefore, the weight measurements
were conducted eight times for both traits during the study (1999 to 2002). The age of animal population was from birth up to 360 days. Weight data were not corrected since the software program would read the file inputs with fixed factors. The study of QTL analysis more concerns on the number of
population rather than the sex of animals. Therefore, this study neglected the sex of animals.
Genetic and Statistic Analyses. Markers and genetic marker distances were referred from Maddox et al. (2001) and updating sheep genome map can be checked through http:// rubbens.its.unimelb.edu.au for QTL analysis. Online QTL Express software through website http://qtl.cap.ed.ac.uk was accessed for QTL Analysis with elicidation of Seaton et al. (2002). Three input data of Genotype file, Marker file and Phenotype file were prepared in textfile. Time of dropped population, genotype, sex and type of birth were considered as fixed factors. Three tests of Permutate Experiment Wide, Permutate chromosome wide and Bootstrap with resampling were performed at levels of 5 dan 1%. A chromosome wide threshold for statistical significance was calculated for each chromosome based on a permutation test of 1000 iterations.
RESULTS
QTL for Birth Weight. QTL location for birth weight was predicted to exist (p < 0.01) at chromosome 5 after permutate-chromosome wide. Summary of QTL analysis results for birth
weight (BW1) was presented at Table 2. The effect of QTL for
birth weight traits was located at 112cM (0-128cM) of chromosome 5. Confident Interval (CI) for interest chromosome 5 was predicted on 128cM which is the most likely position of the QTL. Graphs from the Bootstrap test showed that QTL location at chromosome 5 for birth weight trait was more predicted from population of 1263 (Figure 1). Bootstrap analysis showed that t-value for birth weight came out from the population of family 1263 (Figure 1). This graph ilustrates that segregation of genes associated with production traits might be occurred the highest in population of 1263. Location of candidate genes for birth weight was predicted at the region of flanking markes MCM527-BMS1247 (Table 2). Candidate genes associated with production traits of birth weight are being investigated.
QTL for Weight 360. Significant effects of QTL were detected in four different chromosomal regions for production
traits of body weight 360 days (Table 3).This study reported
that QTL location at chromosome 18 was strong supported (p < 0.01) after permutate-chromosome wide test and even pertained strongly (p < 0.01) after permutate-experiment wide test. The other chromosomal regions at 7, 8, and 23 showed significant effects (p < 0.05) after permutate-chromosome wide
test. The major QTL for BW360 was located at 104 cM of
chromosome 18 with 95% Confidence Interval of QTL location was between 25-125 cM (Table 3). Figure 2 showed graphs of t-values from Bootstrap test for chromosome 18 and predicted from the population of family 1261. The t-value indicated that population of backcross progeny from reference family of 1261 seems to be more concerned since the graph (1.0) presented higher than other reference families (2.0, 3.0, and 4.0). Therefore it needs to be more emphasized for 1261 family in the next QTL analysis since the test of chromosome wide resulted a strong support QTL (p < 0.01) for production traits
DISCUSSION
QTL for Birth Weight Traits. QTL analysis for birth weight traits showed that there was a chance of QTL for birth weight trait locating at chromosome 5. Compared to the previous finding (Margawati & Subandriyo 2004), this study on QTL analysis showed a more powerful tool in detecting the present of candidate gene(s) or markers flanking for the loci of complex traits. It may be this study involved markers and quantitative characters while the previous study was only using quantitative character data. Previous finding had not found significantly the presence of major gene for birth weight, while this study found more significant in detecting the location of candidate gene(s) that affects on birth weight trait.
This finding agreed with Haley (2000), Kinghorn and var der Werf (2000) in livestock, and Evans et al. (2003) in pig that high costs associated with collection of samples, phenotypes and genotyping the large number of animal showed more powerful tool by using QTL mapping. There is an indication that segregation analysis without involving DNA markers showed less powerfull results. The segregation analysis using a mixed-model calculation is impractical and computationally difficult when the data set under analysis contains many animals (Davis & DeNise 1998). Therefore, this QTL study showed better improvement in findings that could state the effect of QTL for birth weight traits of sheep was located at chromosome 5. This finding supported previous reports (Davis & DeNise 1998; Dekkers 2004) that involving the genetic markers in combining with the phenotypic data could improve on selection in term to state a specific chromosomal region. The study also supported the previous studies of Lande and Thompson (1990) that proposed to use a selection index to combine phenotypic and marker data.
Table 2. Summary of permutate chromosome wide and bootstrap tests for birth weight (BW1) of backcross lambs (ITTxMerinoxMerino)
Bootstrap summary
Bootstrap sample Av QTL Loc (cM) 95% Cl of QTL Loc (cM) Length of Cl (cM) Chr no QTL location (cM) Flanking markers
5 * * 1 1 2 MCM527-BMS1247 6 2 3 98.028 0.0-128.00 128.0
**P < 0.01
Table 3. Summary of permutate chromosome wide and bootstrap tests for birth weight 360 (BW360)
Bootstrap summary
Bootstrap sample Av QTL Loc (cM) 95% Cl of QTL Loc (cM) Length of Cl (cM) Chr no QTL location (cM) Flanking markers
7* 8* 18** 2 3 *
RNS5-BMS1620 KD101-BMS1967 CSSM018-TMR1 CSSM31-MCM136
6 3 4 6 2 5 6 4 6 6 0 9
65.873 96.384 95.857 52.328
0-132.00 6.0-128.00 25.0-125.00 20.0-76.00
132.0 122.0 100.0 56.0 80
1 0 4 1 0 4 52 *p < 0.05, **p < 0.01
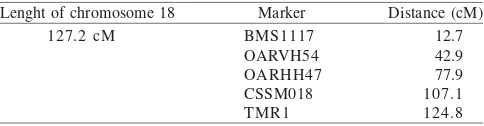
Table 4. Markers used on sheep chromosome 18
Lenght of chromosome 18 Marker Distance (cM) BMS1117
OARVH54 OARHH47 CSSM018 TMR1
12.7 42.9 77.9 107.1 124.8 127.2 cM
This study indicated the effect of candidate genes for birth weight at the region of flanking markers MCM527-BMS1247 on chromosome 5 (Table 2). Candidate gene(s) associated with production traits of birth weight at sheep chromosome 5 was Calpastatin (cast) gene that associated with meat toughness (Margawati 2005). The cast gene is predicted at 125.5-157cM of sheep chromosome 5.
Previous study in Hereford cattle identified the estimated QTL for birth weight traits on chromosome 2 (Grosz & MacNeil 2001). The finding is genetic antagonist as higher birth weight will affect on birth difficulty or dystocia. On the other hand, a higher birth is needed in animal selection to obtain a higher yearling weight.
QTL for Body Weight 360 Traits. The effect of QTL for production trait was detected at the chromosomes of 7, 8, 18, and 23 in the backcross population of Indonesian Thin Tail (ITT) sheep crossed to Merino and backcrossed to Merino. The strong finding at the chromosome 18 supported the recent report of Walling et al. (2004) that QTL location for growth and carcass was identified on chromosome 18 in commercial crossbred of Suffolk and Texel. In addition, they predicted that the QTL location is close to Callipyge (clpg) and Carwell
genes. Callipyge gene is associated with meat production
traits in Dorset (Cockett et al. 1996) while Carwell gene has
function on development of Rib Eye Muscle (REM) in
Australian Poll Dorset (Broad et al. 1998). Cockett et al. 2005 reviewed that Australian Poll Dorset ram posses unusual large rib-eye (longissimus dorsi) areas. McEwan et al. (1998) detailed that carwell gene in sheep has been localized to the distal end of OAR18 near clpg.
marker linked to loci relating to clpg gene. This location of gene lies at the end of sheep chromosome 18. Freking et al. (1998) studied on position of the clpg gene and to test gene action, their finding was consistent with previous assignment of the clpg locus to the telomeric region of chromosome 18. Based on the gene investigation of Margawati (2005), it was reported that there were some QTL relating with the production traits in sheep. These QTL located on chromosome 7, 18, and 23 for growth traits. The candidate genes were predicted as Calpain3 (cap3) and Somatostatin receptor1 (sstr1) on chromosome 7, predicted genes of clpg and Carwell located in chromosome 18 and did not find the candidate genes on chromosome 23. The strong existance of putative genes relating with body weight at 360 days was indicated on the population of family 1261 (Figure 2).
When the markers or the genes can be identified, genetic merit of superior breeding stock therefore can be known more accurate and efficient. The approaches of using markers relating to certain complex traits in animal selection for breeding programs is called a marker assisted selection (MAS). When gene is used as approaches it is called as a gene assisted selection (GAS). Since the QTL was a strong evident obtained on chromosome 18, this study suggests to put more markers on chromosome 18 to obtain markers that can be used as MAS for economic traits in livestock production.
ACKNOWLEDGEMENT
Authors appreciated to ACIAR (Australian Centre for International Agricultural Research) project of the diseases resistance to internal parasites in ITT sheep for making this research possible. Special appreciation was extended to Karen Fullard at the University of Sydney, Australia for her excellent assistant in QTL analysis.
REFERENCES
Broad TE, Hill DF, Maddox JF, Montgomery GW, Nicholas FW. 1998. The sheep gene map. ILAR Journal 39:2-3.
Cockett NE et al. 1994. Chromosomal localization of the callipyge gene in sheep (Ovis aries) using bovine DNA markers. Proc Natl Acad Sci USA 91:3019-3023.
Cockett NE et al. 1996. Polar overdominance at the Callipyge locus in sheep. Science 273:236-238.
Cockett NE et al. 2005. The callipyge mutation and other genes that affect muscle hypertrophy in sheep. Genet Select Evol 37:S65-S81 (Suppl 1).
Cockett NE, Shay TL, Smit M. 2001. Analysis of the sheep genome.
Physiol Genome 7:69-78.
Crawford AW et al. 1995. An autosomal genetic linkage map of the sheep genome. Genetics 140:703-724.
Davis GP, DeNise SK. 1998. The impact of genetic markers on selection. J Anim Sci 76:2331-2339.
Dekkers JCM. 2004. Commercial application of marker- and gene-assisted selection in livestock: strategies and lessons. J Anim Sci
82:E313-E328 (E. Suppl).
Evans GJ et al. 2003. Identification of Quantitative Trait Loci for Production Traits in Commercial Pig Populations. Genetics
164:621-627.
Freking BA et al. 1998. Evaluation of the ovine callipyge locus: I. Relative chromosomal position and gene action. J Anim Sci
76:2062-2071.
Georges M et al. 1995. Mapping quantitative trait loci controlling milk production in dairy cattle by exploiting progeny testing.
Genetics 139:907-920.
Grosz MD, MacNeil MD. 2001. Putative quantitative trait locus affecting birth weight on bovine chromosome 2. J Anim Sci 79:68-72.
Haley C. 2000. Advances in Quantitative Trait Locus Mapping. http/ /agbio.cabweb.org [10 Feb 2005].
Kinghorn B, van der Werf J. 2000. Identifying and Incorporating Genetic Markers and Major Genes in Animal Breeding Programs. Course notes. Brazil: Belo Horizonte.
Lande R, Thompson R. 1990. Efficiency of marker-assisted selection in the improvement of quantitative traits. Genetics 124:743-756. Maddox JF et al. 2001. An enhanced linkage map of the sheep genome
comprising more than 1000 loci. Genome Res 11:1275-1289. Margawati ET. 2005. Pemetaan quantitative trait loci (QTL) sifat
pertumbuhan pada populasi domba silang balik ekor tipis dan merino [Disertasi]. Bogor: Fakultas Peternakan, Institut Pertanian Bogor. Margawati ET, Subandriyo. 2004. Analisa segregasi karakter berat lahir pada anak domba silang balik (Merino X Ekor Tipis X Merino).
Prosiding Presented paper pada Simposium PERIPI
(Perhimpunan Pemuliabiakan Indonesia). Bogor, 5-6 Agu 2004. p 8 (In Press).
Margawati ET, Subandriyo, Muladno, Martojo H, Raadsma HW. 2004. Analysis of Candidate major gene for pre-weaning growth traits in sheep. Proceeding The 3rd Indonesian Biotechnology Conference.
Bali, 1-3 Des. p 9 (In Press).
McEwan JC et al. 1998. Localization of a QTL for rib-eye muscling on OAR18. Anim Genet 19:66 (Suppl 1).
Montgomery GW, Sise JA. 1990. Extraction of DNA from sheep white blood cells. New Zealand J Agricult Res 33:437-441. Paterson AH, Lander ES, Hewitt JD, Peterson S, Lincoln SE. 1988.
Resolution of quantitative traits into Mendelian factors by using a complete RFLP linkage map. Nature 355:721-728.
Raadsma HW et al. 2002. Towards molecular genetic characterization of high resistance to internal parasite in Indonesian Thin Tail (ITT) Sheep. Proceedings 7th World Congress on Genetic Applied to Livestock Production. Montpellier, France, 19-23 Aug 2002. p 13-19.
Seaton G, Haley CS, Knott SA, Kearsey M, Visscher PM. 2002. QTL Express: mapping quantitative trait loci in simple and complex pedigree. Bioinformatics 18:339-340.
Walling GA et al. 2004. Mapping of quantitative trait loci for growth and carcass traits in commercial sheep populations. J Anim Sci