L A L U A T I K D A R F I R M A N H A K I M
GRADUATE SCHOOL
BOGOR AGRICULTURAL UNIVERSITY BOGOR
I, Lalu Atikdar Firman Hakim states that thesis entitled:
SEA LEVEL CHANGE AND ITS IMPAT TO SUBMERGENCE AREA IN COASTAL AREA OF SEMARANG CITY,
CENTRAL JAVA
is result of my own work under supervision of supervisory committee during the period April 2011 – June 2012 and it has not been published. The content of this thesis has been examined by the advising committee and an external examiner.
Bogor, July 2012
ABSTRACT
LALU ATIKDAR FIRMAN HAKIM. Sea Level Change and Its Impact To Submergence Area In Coastal Area of Semarang City, Central Java.
Under the supervision of VINCENTIUS PAULUS SIREGAR and IBNU SOFIAN.
Sea level changing along the time with Mean Sea Level (MSL) shows increasing trend. Semarang City that facing subsidence also impacted by the change of sea level in term of sea level rise and tides. The recorded and reconstructed data (from CSIRO) shows that global sea level rose to 6.83 cm by Dec-2009. Regional sea level change data from University of Colorado also shows the increasing trend of sea level. Three months (Dec-2011 to Feb-2012) realistic tides model that has been generated using FVCOM shows the highest level of the sea surface was 0.473 m while measured sea level in coastal water area of Semarang City by 2010 was 94.669 cm. Measured sea level has to be corrected because the area where it measured experiencing land subsidence. Correction result shows isostatic mean sea level in 2010 was 52.070 cm. Subsidence rate in the location where sea level has measured (Tanjung Mas) can be estimate with the deviation between mean sea level data from tide gauge that experiencing subsidence and isostatic sea level. The result of estimation shows subsidence rate in Tanjung Mas is 7.1 cm/year. The impact of sea level change until 2011 has been formed 1,043.527 Ha of submergence area. Projection in the future shows that in next ten years submergence area will reach ± 3,627 Ha while in next 15 years submergence area will reach ± 4,364 Ha and in next 20 years submergence area will reach ± 4,641 Ha. When spring tides occur, the impact of sea level change will getting worst because area with altitude up to 0.47 from submergence area will be inundated by seawater.
ABSTRAK
LALU ATIKDAR FIRMAN HAKIM. Perubahan Paras Muka Laut dan Dampaknya Terhadap Genangan di Daratan Pesisir Kota Semarang, Jawa Tengah. Dibawah Bimbingan VINCENTIUS PAULUS SIREGAR and IBNU SOFIAN.
Paras muka laut terus berubah seiring dengan waktu dimana tinggi paras muka laut rata-rata (MSL) menunjukkan adanya kenaikan dari waktu ke waktu. Kota Semarang yang juga dilaporkan mengalami penurunan muka tanah juga telah terkena dampak dari kenaikan paras muka laut dan pasang surut. Data hasil perekaman dan rekonstruksi dari CSIRO menunjukkan bahwa paras muka laut secara global telah meningkat ke level 6.83 cm di atas 0 pada Desember 2009. Data paras muka laut regional perairan Indonesia dari Universitas Colorado juga menunjukkan pola yang sama yaitu kenaikan paras muka laut dari waktu ke waktu. Dengan menggunakan software FVCOM, model pasang surut selama tiga bulan (Dec-2011 to Feb-2012) juga telah dibuat. Selama rentang waktu tersebut nilai pasang tertinggi yang didapatkan adalah 0.473 m. Nilai rata-rata paras muka laut hasil pengukuran langsung di Kota Semarang pada tahun 2010 adalah 94.669 cm. Nilai ini harus dikoreksi karena stasiun pasang surut dilaporkan telah mengalami penurunan. Hasil koreksi menunjukkan nilai isostatic paras muka laut pada tahun 2010 adalah 52.070 cm. Penurunan muka tanah pada stasiun pengukuran pasang surut dapat diestimasi kemudian dengan menghitung deviasi antara nilai hasil pengukuran dengan nilai isostatic paras muka laut. Rata-rata tahunan penurunan muka tanah yang didapatkan adalah 7.1 cm/tahun. Dampak dari kenaikan paras muka laut pada 2011 adalah adanya 1,043.527 Ha daratan yang tergenang permanen. Hasil proyeksi juga menunjukkan bahwa pada 10 tahun mendatang daratan yang tergenang permanen akan mencapai ± 3,627 Ha, pada 15 tahun ke depan daratan tergenang permanen yang terbentuk akan mencapai ± 4,364 Ha dan pada 20 tahun yang akan datang akan mencapai ± 4,641 Ha. Ketika pasang tertinggi terjadi, dampak dari perubahan paras muka laut akan bertambah buruk karena daerah-daerah dengan ketinggian hingga 0.47 m dari daratan yang tergenang permanen juga akan dibanjiri oleh air laut.
S U M M A R Y
LALU ATIKDAR FIRMAN HAKIM. Sea Level Change and Its Impact To Submergence Area in The Coastal Area of Semarang City, Central Java.
Under the supervision of VINCENTIUS PAULUS SIREGAR and IBNU SOFIAN.
Since the middle of 19th century, sea level has been rising, primarily as a result of human-induced climate change. During the 20th century, sea level rose about 15-20 centimeters (roughly 1.5 to 2.0 mm/year), with the rate at the end of the century greater than over the early part of the century. Satellite measurements of sea level that taken over the past decade indicate that the rate of increase has jumped to about 3.1 mm/year, which is significantly higher than the average rate for the 20th century. Projections show that the rate of sea level rise is likely to increase during the 21st century, although there is considerable controversy about the level of the increases.
Most of the world’s coastal cities were established during the last few millennia, a period when global sea level has been near constant. Semarang city is one of the cities that founded and established before 19th century where nowadays some part of the land area of Semarang city itself always been flooding. The location of Semarang city is directly heading Java Sea with approximately 21 km of coastline length from east border to west. Coastline of Semarang city has change from 21 km in 2005 to 22.71 km in 2006. Most of coastal and water catchment area in Semarang City is low-lying area and much of it are a subject of inundation during peak tide and rainy season periods. These natural hazards represent a special challenging problem for communities in the coastal regions of Semarang city.
This research was focused on the prediction of sea level change and its impact to coastal area in term of flood. There are two kind of flood that caused by sea level rise i.e. submergence (permanent flood) and inundation (non-permanent flood). Submergence area was analyzed by analyzing regional mean sea level and inundation area was analyzed by combining the highest level of regional mean sea level change and local sea level change (tides).
There area so many factors that affecting sea level change where one of the majority factors is global warming. Global warming is the rise in average global surface temperature caused primarily by the build-up of human-produced greenhouses gases, mostly carbon dioxide and methane, which trap heat in the lower levels of the atmosphere (Lindsay, 2010). Global warming is the majoring factor of global climate change where global climate change is a change in the long-term weather patterns that characterize the regions of the world. Global warming occurs majoring as the effect of the increasing of glass house gasses (especially carbon dioxide) in the atmosphere that can absorb emitted infrared radiation by Earth and release that energy into the atmosphere rather than allowing it to escape to the space. As their atmospheric concentration has increased, the amount of energy "trapped" by these gases has led to higher temperatures. One of the most common energy/light reflectance is infrared where infrared can’t escape to the space by green houses gasses blocked. It makes earth temperature increasing and affecting weather characteristic and pattern in an area or even in the world whether it temperature, wind, and/or precipitation.
wind, and/or precipitation of a region (Merritts et al. 1998). The sun influences weather, where the sun heats the earth's atmosphere and its surface causing air and water to move around the planet. The result can be as simple as a slight breeze or as complex as the formation of a tornado. Some of the sun's incoming long wave radiation is reflected back to space by aerosols. In addition, some of the sun's energy that has entered Earth's atmosphere is reflected into space by the Earth’s surface (the reflectivity of Earth's surface is called albedo). Both of these reflective processes have a cooling affect on the planet.
Actually, sea level had been changing whole the time even there is no occurences of unnatural phenomenon. The change is called tides, the change in sea level a the impat of meteorological phenomenon.
Knowledge of the tides and their patterns dates back to at least 2300 BC in the ruins of coastal cities along the Gulf of Cambay in India. Here archaeologists have uncovered evidence of tidal docks, structures that allow boats to enter at high tide and, by means of a gate, trap the water and keep the boat afloat when the tide recedes. Indian religious texts from 300 400 BC suggest a link between the tides and the phases of the moon, a highly advanced claim for its time. Because tides may rise and fall in excess of 30 feet (10 meters) in this region, they obviously played an important role in the culture and commerce of these ancient people (Sawicki, 2005).
Several notable scholars advanced theories of the tides (including Galileo) but the first complete and fundamental correct explanation was published in 1687 by Sir Isaac Newton in his Principia. In his theory, Newton introduced the Law of Gravitation which states that the gravitational attraction between two planetary bodies is the product of their masses divided by the square of their distance, times the gravitational constant. Differences in gravity at different points on Earth’s surface cause vertical and horizontal forces but the vertical forces are much too small to generated using FVCOM (Finite-Volume Coastal Ocean Model). DTM (Digital Terrain Model) data as the survey result of City Planning Agency of Semarang City in 2008 were used to generate the submergence and inundated area. The RBI (Indonesian topographic) map combined with satellite images and field survey data were used as the base map to obtain several thematic maps that related to flood analysis and loss hazard estimation. Loss estimation involves the calculation of the vulnerable area with the landuse damage, road network and water channel. The estimation is only limited to the tangible damage or physical direct damage caused by tidal flood.
The result of correction found that isostatic mean sea level in 2010 was 52.070 cm with 2.54+0.6 cm/year of regional rising value.
This research was not measure subsidence rate, it can be estimated by the deviation between mean sea level data from tide gauge that experiencing subsidence and isostatic sea level. The result of estimation shows subsidence rate in Tanjung Mas area (location where tide gauge located) is 7.1 cm/year. This result is not so differ with latest research result (Abidin, 2010) that found the rate of subsidence in same area was 7.5 cm/year from October to December 2008.
As the impact of Sea level change (regional sea level rise and tides), submergence area that formed in 2011 was 1,043.527 Ha and predicted increase 4.4 times by spring tides. Seawater also covered ±149 km of road and ±67 km water channel, so that those facilities can run it function normally. Future projection shows that in next ten years submergence area will reach ± 3,627 Ha while in next 15 years submergence area will reach ± 4,364 Ha and in next 20 years submergence area will reach ± 4,641 Ha. When spring tides occur, the impact of sea level change will getting worst because area with altitude up to 0.47 from submergence area will be inundated by seawater.
Copyright © 2012, Bogor Agriculture University Copyright are protected by law,
1. It is prohibited to cite all of part of this thesis without referring to and mentioning the sources;
a. Citation only permitted for the sake of education, research, scientific writing, report writing, critical writing or reviewing scientific problem.
b. Citation does not inflict the name and honor of Bogor Agricultural University.
L A L U A T I K D A R F I R M A N H A K I M
A thesis submitted for the degree Master of Science in Information Technology for Natural Resources Management Program Study
GRADUATE SCHOOL
BOGOR AGRICULTURAL UNIVERSITY BOGOR
Name : Lalu Atikdar Firman Hakim
Student ID : G 051090091
Study Program : Master of Science in Information Technology for Natural
Resource Management
Approved by,
Advisory Board
Dr. Ir. Vincentius P. Siregar, DEA. Supervisor
Dr. Ir. Ibnu Sofian, M.Eng. Co-Supervisor
Endorsed by,
Program Coordinator
Dr. Ir. Hartrisari Hardjomidjojo, DEA
Dean of Graduate School
Dr. Ir. Dahrul Syah, M.Agr.Sc.
Date of Examination: Date of Graduation:
ACKNOWLEDGEMENTS
Alhamdulillahi Robbil ‘Alamiin, Praise be to ALLAH SWT The Greatest,
Lord of the Worlds, The All-Wise. Grateful for all of Your grace, I could
finish my thesis after passing all of the obstacles.
"Whenever ALLAH decides
to create something ALLAH has only to say, ‘Exist,’ and it come into existence.
All glory belongs to the Ones in Whose hands is the control of all things. To
Him you will all return."
(QS 36:82-83)
I would like to express my gratitude first to my supervisors: Dr. Ir.
Vincentius P. Siregar, DEA. and Dr. Ir. Ibnu Sofian, M.Eng. for their
assistance, comment, encouragement, and patience in guiding me to
completing my thesis. My gratitude also goes to Dr. Antonius B.W. for his
question, remark, correction and all of his input as the external examiner and
lecturer. To the M.Sc. in IT for Natural Resources Management program
coordinator, Dr. Ir. Haritasi Hardjomidjodjo, DEA, and all staff in
MIT-Biotrop, my gratitude also goes to them.
Sincerely thank is also extended to Ir. M. Helmi, M.Si and all friends in
Semarang for data sharing and survey guidance. To all of my colleagues,
friends, and all MIT students, there are too numerous to thank individually,
but thank’s guys.
Last but not least, to my lovely parents, brother, sister, cousin, auntie, uncle,
fiancée, and all of my family, thank you for always supporting me and being
there for me. I specially dedicated this thesis for you all.
CURRICULUM VITAE
The author was born on March 30th 1980 in Mataram, West Nusa
Tenggara as the oldest of three children. In 2003, the author
enrolled bachelor degree in Department of Marine Science and
Technology, Bogor Agriculture University and was graduated in
2008 with final research entitle ”Determination of marine tourism
potential zone in south coast of Lombok island, NTB, using
Geographical Information System (GIS)”. In September 2009, the author registered
in Graduate School of Bogor Agricultural University at Master of Science in
Information Technology for Natural Resources Management program. His M.Sc.
thesis entitled “Sea Level Change And Its Impact to Submergence Area in Semarang
City (Central Java) Coastal Area”. He was worked for some company in different
timescale as contracted staff and never been awarded by any kind scholarship during
TABLE OF CONTENTS
2.4.1. Eustatic and Isostatic Sea Level Change..………..……… 10
2.4.2. Factor Contributing Sea Level Rise..……….. 11
2.5. Sea Level Change Phenomenon in Indonesia………... 14
2.6. Land Subsidence.. ……… 15
III. MATERIALS AND METHOD 3.1. Research Location and Time………... 21
3.2. Data Used…………..……….... 22
3.3. Material Used…………..……….. 23
3.4. General Method..……….. 23
3.4.2. Estimating Land Susidence..……….………..……...……. 25
3.4.3. Digital Terrain Model……..……….………..……...……. 26
3.4.4. Landuse and Infrastructure Mapping…….………..……...……. 26
3.4.5. Ground Truth………...……..……….………..……...……. 26
IV. RESULT AND DISCUSSION 4.1. Sea Level Change…..……….. 31
4.1.1 Tides projection…..……….... 31
4.1.2 Regional Sea Level Change……….... 34
4.1.3 Global Sea Level Change…………..…..……… 36
4.1.4 Eustatic and Isostatic Sea Level Rise…..……… 38
4.2. Land Subsidence.…..……….. 39
4.3. Recent Impact of Sea Level Change to Land Area…..………..…. 40
4.3.1 Coastal Submergence by Sea Level Rise…..………. 41
4.3.2 Adaptation Strategy……….…..………. 42
4.3.3 Coastal Inundation at Spring Tide 2012.…..……….. 44
4.3.4 Comparison of Projection and Maximum Flood Occurrence…… 46
4.3.5 Projection Until The end of Long Term Development Plan……. 47
V. CONCLUSIONS AND RECOMMENDATION 5.1. Conclusions…..………..……. 53
5.2. Recommendations…..………...….. 54
REFERENCES…..………..………… 55
LIST OF FIGURES
Figure 2.1. Global temperature change (a) Land and Ocean (b)
Hemispheric………...
Figure 2.2. The increasing of global
temperature.………..
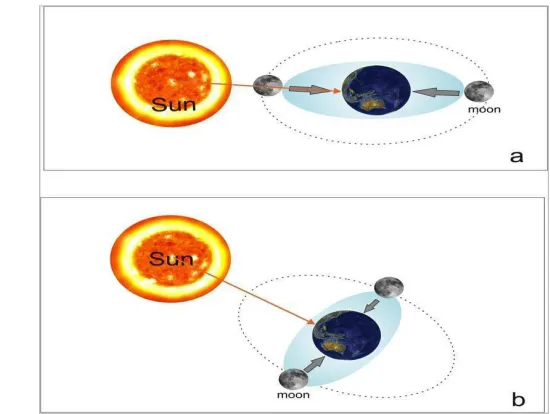
Figure 2.3. Sun-earth-moon system affecting spring tide (a) and neap tide (b)..
Figure 2.4. Daily inequality of tides .………..
Figure 2.5. Building and construction distribution over Semarang city in (a)
red in 1600, green is increasing until 1741, violet is increasing
until 1880, blue is increasing until 1927 and (b) yellow is
increasing until 2009………...
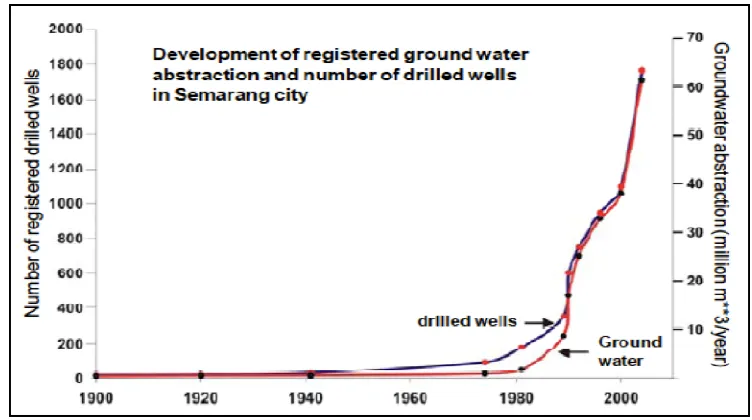
Figure 2.6. Ground water abstraction and registered drilled wells development
in Semarang City………
Figure 3.1. Research location...………...
Figure 3.2. Flowchart for daily sea level change modeling using FVCOM…...
Figure 3.3. Flowchart for terrain model of Semarang City coastal area………
Figure 3.4. Flowchart for landuse and infrastructure mapping..….…………....
Figure 3.5. Research framework……….
Figure 4.1. Sea level dynamic in Semarang city based on the day when spring
tide is occur ………...………..
Figure 4.2. Sea level variation at spring tide………..
Figure 4.3. Sea level variation at ebb tide………..
Figure 4.4. Trend of regional sea level around Indonesia (data from
University of Colorado)………...
Figure 4.5. Monthly average of global mean sea level pattern based on tide
gauge recorded and/or reconstructed data (data from
CSIRO)……….………...
Figure 4.6. Monthly average of global mean sea level pattern based on data of
Figure 4.7. Recent submergence area………
Figure 4.8. Various adaptation strategies in submergence area (a) plastic bed
cover is permanent flooded bedroom, (b) car try to passing road
that was transformed to submergence area, (c) working activity in
submergence area, (d) fishing activity in former warehouse of an
industry………...
Figure 4.9. Comparison of projected and calculated previous maximum
flooded area………….……….
Figure 4.10. Projecting submergence area in next 10, 15 and 20 years from
now………...………...
Figure 4.11. Projecting inundated area in next 10, 15 and 20 years from
now………...………... 37
42
43
47
48
LIST OF TABLES
Table 2.1. Principal body tide constituents.………
Table 2.2. Contribution to SLR………...………...
Table 4.1. Result of regional sea level change data processing……….
Table 4.2. Global rising average from tide gauge and satellite in specific time
scale………..
Table 4.3. Real sea level height in Semarang City………...
Table 4.4. Real sea level height in Semarang City and it deviation from tide
gauge data………..
Table 4.5. Properties that affecting by sea level rises and spring
tide……….………….
Table 4.6. Properties that affecting by sea level rises in next 10, 15 and 20
years……….…………..
Table 4.7. Properties that affecting by sea level rises and spring tide in next
10, 15 and 20 years..…....………... Page
10
13
35
38
39
40
45
49
Background
Since the middle of 19th century, sea level has been rising, primarily as a result
of human-induced climate change. During the 20th century, sea level rose about
15-20 centimeters (roughly 1.5 to 2.0 mm/year), with the rate at the end of the
century greater than over the early part of the century. Satellite measurements
taken over the past decade indicate that the rate of increase has jumped to about
3.1 mm/year, which is significantly higher than the average rate for the 20th
century. Projections suggest that the rate of sea level rise is likely to increase
during the 21st century, although there is considerable controversy about the size
of the increases.
Most of the world’s coastal cities were established during the last few
millennia, a period when global sea level has been near constant. Semarang city is
one of the cities that founded and established before 19th century where nowadays
some part of the land area of Semarang city itself always been flooding. The
location of Semarang municipality is directly heading Java Sea with
approximately 21 km of coastline length from east border to west. Coastline of
Semarang city is always changes along the time from 21 km in 2005 to 22.71 km
in 2006. Most of boundary between land and water (coastal and water catchment
area) is low-lying area and much of it is a subject of inundation during peak tide
and rainy season periods. These natural hazards represent a special challenging
problem for communities, large and small, in the coastal regions of Semarang city.
As population densities continue to increase in Semarang city, the flood hazard
unfortunately is increasing as well due to global sea level rise combined with
locally high rates of land subsidence in the area. In some areas, the combination of
sea level rise and land subsidence is doubly significant effect for flooding. High
rainy season that have not caused significant flooding in the past will begin to do
so, and with greater frequency as sea level, will give continues effect which is
Data, information, and prediction about sea level change and land subsidence
in Semarang City is very important in correlation with development aspects, urban
planning, facilities and infrastructure development plan, environmental
preservation, ground water mining and controlling, sea water intrusion control,
and civil prevention from the impact of those both phenomenon (mitigation plan).
Therefore, systematic and continuous monitoring is highly needed and must be
notice by planner because coastal planning and development not only looking
toward the future but also underscores the present need for emergency planning
and effective response measures when coastal inundation is imminent. Flood
hazard mitigation at a minimum requires an understanding of the land and
bay-ocean processes that contribute to it in complex and often unpredictable ways.
Objectives
The objective of this research is to identify and measure the rate of sea level
change in Semarang city coastal region and its effect as the basic information for
public generally and for planner and government especially about their living area
and the area that will be developed either structurally or spatially. This research
also predicted the impact of sea level change in specific time as the overview for
future condition.
Outputs
Through integrating of modeling, remote sensing and geographical information
system method, several outputs that has been gained are:
1. Sea level change pattern in the specific time scale.
2. Map informing the effect of sea level change to the land area.
3. Map of study area as the result of future projection that informing the effect of
sea level change to the land area in specific year in the future
4. Sea level change phenomenon and its effect to submergence and inundated
I I . L I T E R A T U R E R E V I E W
2.1 Global Warming
Global warming is the rise in average global surface temperature caused
primarily by the build-up of human-produced greenhouses gases, mostly carbon
dioxide and methane, which trap heat in the lower levels of the atmosphere
(Lindsay, 2010). Global warming is the majoring factor of global climate change
where global climate change is a change in the long-term weather patterns that
characterize the regions of the world. Global warming occurs majoring as the
effect of the increasing of glass house gasses (especially carbon dioxide) in the
atmosphere that can absorb emitted infrared radiation by Earth and release that
energy into the atmosphere rather than allowing it to escape to the space. As their
atmospheric concentration has increased, the amount of energy "trapped" by these
gases has led to higher temperatures. One of the most common energy/light
reflectance is infrared where infrared can’t escape to the space by green houses
gasses blocked. It makes earth temperature increasing and affecting weather
characteristic and pattern in an area or even in the world whether it temperature,
wind, and/or precipitation.
(a) (b)
Source: NASA GISS, 2012 Figure 2.1. Global temperature change (a) Land and Ocean (b) Hemispheric
Temperature in land is different with temperature in the water/ocean so that
GISS, since the first data recorded and/or reconstructed, mean temperature change
in land area was increased with the amount ± 1.4 °C per 5 years and in ocean was
increased with the amount ± 0.7 °C per 5 years or land area has double increasing
value than ocean (Figure 4.1 (a)). The warmer of land area can be because land
properties (soil, rock, sand etc.) is better conductor and can preserve heat that it
received than water properties even both object receive the same heat.
Data from NASA GISS also shows hemispheric temperature has been change
and linearly increase where the increasing in northern hemisphere is different with
southern hemisphere. Since the first year data record until 2010, the 5 years mean
of increasing in northern hemisphere was ± 1.25 °C and was ± 0.85 °C in southern
hemisphere (Figure 4.1 (b)). It can possibly caused by the land area in northern
hemisphere is larger than southern part so that human air pollution that can
trapped emitted energy (which is one of majoring factor in global warming) in
northern part is higher than in the southern part. That possibility can be supported
by data from World Bank (2011) that shows the air pollution contribution of each
country.
Developed countries are the countries with the highest contribution of CO2
emissions. In 2006, China contributed 6.103x10⁶ tons of CO2 emissions or 21.5%
of total CO2 emissions. United states contributed 5.752x10⁶ tons of CO2 emissions
or 20.2% of total CO2 emissions. Russia contributed 5.5 % of total CO2 emissions;
India contributed 5.3%, Japan contributed 4.6%, Germany contributed 2.8%,
United Kingdom contributed 2.0%, Canada contributed 1.9%, while South Korea
and Italy has the same contribution with 1.7% of total CO2 emissions per country.
Those top ten countries with the highest CO2 emissions are located in northern
from northern hemisphere is the countries with the highest contribution (exclude
emission, top ten most polluted cities by particulate matter, and ten countries with
highest carbon dioxide emission/capita can be seen completely in Appendix 1.
2.2 Global Climate Change
Global climate change is a change in the long-term weather patterns that
characterize the regions of the world. The term "weather" refers to the short-term
(daily) changes in temperature, wind, and/or precipitation of a region (Merritts et al. 1998). The sun influences weather, where the sun heats the earth's atmosphere and its surface causing air and water to move around the planet. The result can be
as simple as a slight breeze or as complex as the formation of a tornado. Some of
the sun's incoming long wave radiation is reflected back to space by aerosols. In
addition, some of the sun's energy that has entered Earth's atmosphere is reflected
into space by the Earth’s surface (the reflectivity of Earth's surface is called
albedo). Both of these reflective processes have a cooling affect on the planet.
The greenhouse effect is a warming process that balances Earth's cooling
processes. During this process, sunlight passes through Earth's atmosphere as
short-wave radiation. In atmosphere some of long wave radiation is absorbed by
certain gases (called greenhouse gases). Greenhouse gases include carbon dioxide
(CO2), chlorofluorocarbons (CFC's), methane (CH4), nitrous oxide (N20),
tropospheric ozone (O3), and water vapor. Each molecule of greenhouse gas
becomes energized by the long wave radiation. The energized molecules of gasses
then emit heat energy in all directions. By emitting heat energy toward Earth,
greenhouse gases increase Earth's temperature (Dasgupta and Meisner, 2009).
The greenhouse effect is a natural occurrence that maintains Earth's average
temperature at approximately 60 degrees Fahrenheit. The greenhouse effect is a
necessary phenomenon that keeps all Earth's heat from escaping to the outer
atmosphere. Without the greenhouse effect, temperatures on Earth would be much
lower than they are now, and the existence of life on this planet would not be
possible. However, too many greenhouse gases in Earth's atmosphere could
increase the greenhouse effect. This could result an increases in mean global
When weather patterns for an area change in one direction over long periods
of time, they can result in a net climate change for that area (the key concept in
climate change is time). The real threat of climate change lies in how rapidly the
change occurs. For example, over the past 120 years, the mean global temperature
appears to have risen 2 to 8 degrees Celsius. These temperatures changes are
depicted in the graph below from the IPCC (2001).
Figure 2.2. The increasing of global temperature
The geological record, the physical evidence of the results of processes that
have occurred on Earth since it was formed, provides evidence of climate changes
similar in magnitude to those in the above graph. This means during the history of
the earth, there have been changes in global temperatures similar in size to these
changes (Schlesinger, 1991). However, the past changes occurred at much slower
rates, and thus they were spread out over long periods of time. The slow rate of
change allowed most species enough time to adapt to the new climate. The current
and predicted rates of temperature change, on the other hand, may be harmful to
ecosystems. This is because these rates of temperature change are much faster
than those of Earth's past. Many species of plants, animals, and microorganisms
2.3 Tides
Knowledge of the tides and their patterns dates back to at least 2300 BC in the
ruins of coastal cities along the Gulf of Cambay in India. Here archaeologists have
uncovered evidence of tidal docks, structures that allow boats to enter at high tide
and, by means of a gate, trap the water and keep the boat afloat when the tide
recedes. Indian religious texts from 300 400 BC suggest a link between the tides
and the phases of the moon, a highly advanced claim for its time. Because tides
may rise and fall in excess of 30 feet (10 meters) in this region, they obviously
played an important role in the culture and commerce of these ancient people
(Sawicki, 2005).
Several notable scholars advanced theories of the tides (including Galileo) but
the first complete and fundamental correct explanation was published in 1687 by
Sir Isaac Newton (1642 1727) in his Principia. In his theory, Newton introduced
the Law of Gravitation which states that the gravitational attraction between two
planetary bodies is the product of their masses divided by the square of their
distance, times the gravitational constant.
Differences in gravity at different points on Earth’s surface cause vertical and
horizontal forces but the vertical forces are much too small to generate tides. The
tide causing forces result from the horizontal forces acting along the surface of
the Earth (i.e., tangential to the surface), causing motions of water towards points
directly beneath and on the opposite side of the Moon (and Sun).
2.3.1. Origin of the tides
In oceanography, tides are commonly defined as the periodic variations in sea
level that occur as a result of the gravitational forces of the Sun and the Moon.
Tides are a planetary phenomenon, caused by the gravitational attraction of other
planetary bodies on Earth (Sun and Moon). The force of this attraction creates a
very predictable rise and fall of sea level as the Earth rotates on its axis. When
sea level is at its greatest height, the tide is said to be high and when sea level is
at its lowest extent, the tide is said to be low. High tides bring water far up on
the shore, combines with high wave action, these high tides may damage homes
of the beach.
The moon is the primary factor controlling the temporal rhythm and height of
tides. The moon produces two tidal bulges somewhere on the Earth through the
effects of gravitational attraction. The height of these tidal bulges is controlled
by the moon’s gravitational force and the Earth’s gravity pulling the water back
toward the Earth. At the location on the Earth closest to the moon, seawater is
drawn toward the moon because of the greater strength of gravitational attraction.
On the opposite side of the Earth, another tidal bulge is produced away from the
moon. However, this bulge is due to the fact that at this point on the Earth the
force of the moon’s gravity is at its weakest. Considering this information, any
given point on the Earth’s surface should experience two tidal crests and two
tidal troughs during each tidal period.
The second factor controlling tides on the Earth’s surface is the sun’s gravity.
The height of the average solar tide is about 50 % the average lunar tide. At
certain times during the moon’s revolution around the Earth, the direction of its
gravitational attraction is aligned with the suns. During these times the two tides
producing bodies act together to create the highest and lowest tides of the year.
These spring tides occur every 14 15 days during full and new moons (Roos,
1997).
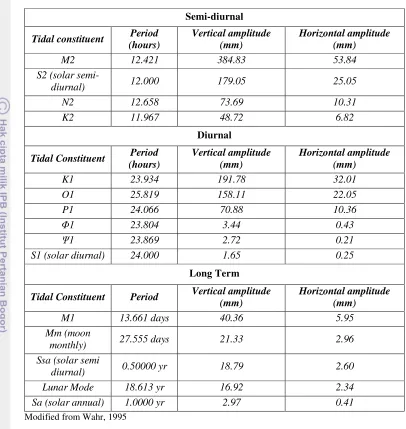
2.3.2. Tides Constituent
In most estuaries and seas, a periodic rise and fall of the water can be
observed, it is known as the vertical astronomical tides. The highest level of
tides called High Water level (HW) and the lowest level is called the Low Water
level (LW), whereas the difference between HW and LW is called tidal range.
When the vertical movement of the water level is measured for about one day,
than it can be observed that the second HW and LW differ from first HW and
LW. This difference in HW’s and LW’s is called the daily inequality.
Figure 2.4. Daily inequality of tides
When the water level is measured in “A” location and the wave move
horizontally, a periodic rise and fall of water level can be observed also. So,
associated with vertical movement of the water surface, there is also horizontal
movement of the water particles. In tidal analysis, the tidal signal (the observed
water level versus time) is decomposed into its constituents. Tidal constituent
generally can be distinguish into three main groups, and completely can be seen
Table 2.1. Principal body tide constituents
Tidal Constituent Period Vertical amplitude (mm)
2.4.1.Eustatic and Isostatic Sea Level Change
There are two kinds of sea levels change: eustatic and isostatic sea level change.
Eustatic sea level change is general or global sea level change, change in seawater
volume globally which is caused by factor like global warming. Isostatic sea level
change is change of sea level at specific site as the sum of sea level rise plus local
Many observations show that the ocean has been changing over the last
several decades. One aspect of these changing is the warming of ocean, resulting
in increase of ocean volume through thermal expansion. There has also been
addition of water from glacier and ice sheets and changes in storage of water on
or in the land (e.g. retention of water in man-made dams and extraction of water
from aquifers). These together result in changes in sea level
2.4.2.Factors Contributing Sea Level Rise
Since the concern about human-induced global warming in the 1980s was
emerged, sea-level rise and its impacts on the coastal areas have attracted
considerable concern. The large and growing concentration of people and assets
in coastal areas imply to the height of potential impacts. It is estimated that at
least 600 million people live within 10m of sea level in 2010, and these
populations are growing more rapidly than global trends. Populated deltaic areas
and many coastal cities are highly threatened by small rises in sea level. While in
global terms relatively small in number, the very existence of small-island nation
states makes them vulnerable to rises in sea level of the order of 1m (Nisholls et.
al., 2011).
The recent report of the Intergovernmental Panel on Climate Change (IPCC)
estimates that in response to rising temperatures (1.0°-3.5°C higher than 1990
levels in 2100), sea level will have risen from 15 to 95 cm by the year 2100.
IPCC AR4 Report (IPCC, 2007) identifies several major factors that currently
contribute to sea level rise. These are:
1. Ocean Thermal Expansion
Instrumental records shows that the world’s oceans have warmed since 1955,
accounting over this period for more than 80% of the changes in the energy
content of the Earth’s climate system. Further records also shows that during the
period of 1961 to 2003, ocean layer between 0 to 3000 m. has absorbed average
heating rate of 0.2 Watts/m2 (per unit area of the Earth’s surface). During 1993
to 2003, the corresponding rate of warming in the 0 to 700 m ocean layer was
higher, about 0.5 ± 0.18 W/m2. Therefore, between 1961 to 2003, the period
1993 to 2003 had much higher rates of warming, especially in the upper 700 m
2. Change in Glaciers and Icecaps
During the 20th century, glaciers and ice caps have experienced huge mass
losses. These losses (excluding those around the ice sheets of Greenland and
Antarctica) are estimated to have contributed 0.50 ± 0.18 mm/yr in sea level
equivalent (SLE) between 1961 and 2003, and 0.77 ± 0.22 mm/yr between 1991
and 2003.
3. Glacial melt from the Greenland and Antarctica ice sheets (GIS)
Whether the Greenland and Antarctic ice sheets had been growing or
shrinking over time scales of longer than a decade is not well established from
observations. Lack of agreement standard between techniques and the small
number of estimates preclude assignment of best estimates or statistically tight
error bounds for changes in ice sheet mass balances. However, acceleration of
outlet glaciers draining from the interior has been observed in both the
Greenland and Antarctic ice sheets.
According to the IPCC AR4 (IPCC, 2007), it is very likely (> 90%
probability) that the Greenland Ice Sheet shrunk from 1993 to 2003. An
assessment of the data suggests a mass balance for the Greenland Ice Sheet of –
50 to –100 Gigatons/year (a shrinkage contributing to rising global sea levels of
0.14 to 0.28 mm/yr) from 1993 to 2003, with even larger losses in 2005. The
estimated range in mass balance for the GIS from 1961 to 2003 is between a
growth of 25 Gt/yr and shrinkage of 60 Gt/yr (or –0.07 to +0.17 mm/yr SLE).
There are even greater uncertainties for Antarctica Ice Sheet (AIS). Again
according to the IPCC AR4 assessment of all the data yields an estimate for the
overall AIS mass balance ranging from growth of 100 Gt/yr to shrinkage of 200
Gt/yr (or –0.27 to +0.56 mm/yr of SLE) from 1961 to 2003, and from +50 to –
200 Gt/yr (or –0.14 to +0.55 mm/yr of SLE) from 1993 to 2003.
4. Smaller contribution from snow on land and permafrost
Snow cover has decreased in most regions, especially in spring. Satellite
observations of the Northern Hemisphere snow cover from 1966 to 2005 show a
decrease in every month except in November and December, with a stepwise
drop of 5% in the annual mean in the late 1980s. In the Southern Hemisphere,
the past 40 years or more. Decreases in the snow pack have also been
documented in several regions worldwide based upon annual time series of
mountain snow water equivalent and snow depth.
Permafrost and seasonally frozen ground in most regions display large
changes in recent decades. Temperature increases at the top of the permafrost
layer of up to 3°C since the 1980s have been reported. Permafrost warming has
also been observed with variable magnitudes in the Canadian Arctic, Siberia, the
Tibetan Plateau and Europe. The permafrost base has been thawing at a rate
ranging from 0.04 m/yr in Alaska to 0.02 m/yr on the Tibetan Plateau.
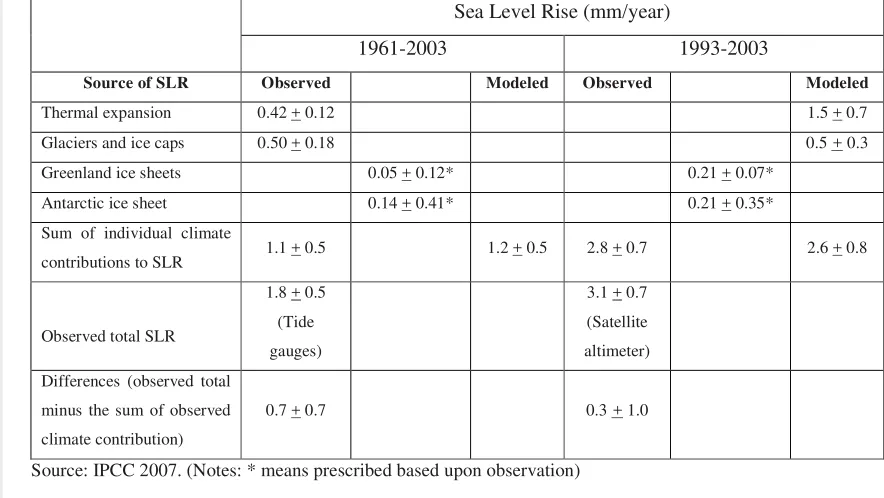
The complete summary that shows contribution of each parameter majority to
sea level rise based on upon observations as compared to model can be seen in
table 2.2.
Table 2.2. Contribution to SLR (Sea Level Rise)
Sea Level Rise (mm/year)
1961-2003 1993-2003
Source of SLR Observed Modeled Observed Modeled
Thermal expansion 0.42 + 0.12 1.5 + 0.7
2.5 Sea Level Change Phenomenon in Indonesia
Climate change has and will continue to impact Indonesia where one of the
impacts is sea level change in term of rising. All Indonesia’s coastal area will be
impacted by sea level rise with different scale of impact because the rate of
increase varies with locations (Sofian in ICCRS, 2009). A recent mapping
vulnerability assessment shows that the western and eastern areas of Java Island
(including Jakarta) are at particular threat to droughts, floods, landslides, and
sea-level rise.
Jakarta as one of the most densely populated areas in Southeast Asia is at high
risk of climate impacts because it is frequently exposed to significant flooding and
subsided. The wet season in Jakarta has become wetter, mean sea level rising by
the time, and therefore the city experiences more flooding, which is compounded
by clogged drainage and the fact that major part of the city is at or near sea level.
Previous floods as the combination from all of those factors have occurred in
Jakarta where major flood events in 1996 and 2007 submerged 5,000 hectares of
land with losses from infrastructure damage and state revenue estimated at
US$572 million. These two floods also killed at least 85 people and forced about
350,000 people from their homes (WWF, 2009). More specific, the impact of sea
level change also threaten human life because peak tide has reached it usual peak
tide level. Governor of DKI Jakarta in KOMPAS (2011) states that peak tide has
reached 2.5 meters or 30 cm higher than it normal so that tidal flood inundated
some area in North part of Jakarta. Clear example can be seen in Pantai Muara
and it surrounding area that has been inundated up to 80 cm by this occurrence.
Banjarmasin City as the capital of South Kalimantan Province with 72 km2
area of land where some part of land is low lying area and it City crossing by
Barito river that becomes ship route to reach Java Sea also impacted by sea level
change. When level of ebb tide is lower than normal, ship can come in/out from
Banjarmasin. The impact of sea level rise for specific time period also has been
projected by Susandi et.al. In 2010 sea level will be emerge area that lower than
0.37 m (land area loss around 0.53 km2), in 2050 will emerge land area that lower
than 0.48 m (land area loss around 1.039 km2), and will emerge land area that
the economic loss of each land area loss where in 2010 the economic losses will
reach $0.03x10⁶, in 2050 economic losses will reach $0.14x10⁶, and in 2100
economic loss will reach $0.69x10⁶.
2.6 Land Subsidence
Land subsidence is a gradual settling or sudden sinking of the Earth’s surface
owing to subsurface movement of earth Materials. Land subsidence is merely the
surface symptom of a variety of subsurface displacement mechanisms. Not all of
these mechanisms are well understood. Subsidence processes are hiding below
ground, their development to the point of surface deformation may involve long
periods of time, and for at least some mechanisms, significant evidence may lie
outside the area directly beneath the surface subsidence. Furthermore, at some
sites more than one condition favorable to subsidence occurrence may be present
and require consideration in analyzing causal mechanisms and devising remedial
procedures (USGS, 2000).
Subsidence is a familiar accompaniment of a variety of natural events that
comprise the geologic history of many areas. For practical reasons geologic
processes that are accompanied by subsidence have been examined for evidence
that the range in their rates of progress extends into a time frame that may produce
damaging effects in terms of man’s time scale. The processes investigated are
those that remove or withdrawal subsurface materials to produce void space or
significant volume reduction-solution, underground erosion, lateral flow, and
compaction-or, in the case of tectonic activity, deep-seated downward
displacement. For all of these naturally occurring geologic processes, examples of
related surface subsidence have been found, though some are rare (Allen, 1970).
The incidence of subsidence is greater where some of these geologic processes are
set in motion or accelerated by man’s engineering activities that involve
excavation, loading, or changes in the ground-water regime.
The term "subsidence" is used because it representing the sinking in a broad
sense to include both slows downwarping and the collapse of discrete segments of
the ground surface. Displacement is principally downward, although the
term is not restricted on the basis of size of area affected, rate of displacement, or
causal mechanism.
Land subsidence in Semarang city had been occurring with northern part of its
city as the main region of subsided. There are three major factors that causing land
subsidence in Semarang City i.e.; geological structure of soil, groundwater
withdrawal, and building/construction load.
Geologically, Semarang has three main lithologies, namely, volcanic rock,
sedimentary rock, and alluvial deposits. According to Sukhyar (2003), the basement of Semarang consists of Tertiary Claystone of the Kalibiuk Formation.
Overlying this Formation is the Notopuro Formation, which consists of
Quaternary volcanic material. Those two formations crop out in the southern part
of the Semarang area. The northern part of the Semarang area is covered by Kali
Garang deltaic alluvium up to a depth of 80 to 100 m in the coastal area. Aquifers
are found at depths ranging from 30 to 80 m in this alluvium. Van Bemmelen
(1949) reported that the shoreline of Semarang progresses relatively quick toward
the sea, namely about 2 km in 2.5 centuries or about 8 m/year. That “new” land
area is located in northern part of Semarang City (deltaic area) is composed by
very young alluvium with high compressibility. Alluvium, as the upset soil layer
in coastal area of Semarang City is not stabile and its density can be easily
changed. The instability of soil layers in deltaic area will easily change the pattern
of soil layer and without human factor it can causing land subsidence.
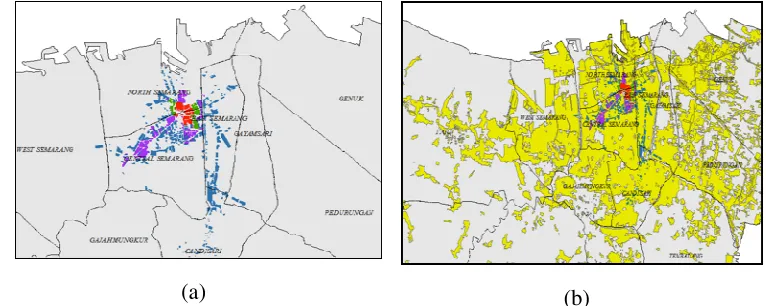
As development started to continue, there are some impacts that occur in
Semarang City, one of them is land conversion. Swamp forest, agriculture area
and human non-infrastructure use had been converting into houses, building and
infrastructure. In 1660, the first area that was converted into human uses (building
and infrastructure) is the area that nowadays known as Tanjung Mas harbor area.
Around 600 years ago, Tanjung Mas harbor area is not land area but it known as
the area that covered by seawater completely. Deltaic sedimentation, river deposit,
and sediment cover from tides process formed this land area so that the soil layer
in that area is still young. To supported Tanjung Mas harbor area as the central
area of development, the buffer area of Tanjung Mas also converted and becomes
Ha and it increased to 109.78 Ha (44.70%) in 1880. In 1927, the building area
expanded toward southern part of Semarang City with the increasing to348.14 Ha
and in 2009, building and infrastructure has covered all part of coastal area with
total area reach 37,984.41 Ha (more than 100 times than in 1927). Semarang City
especially coastal area, with very young unstable alluvium soil layer and can be
decrease without human factor, since 1660 started experience land subsidence
which also caused by building load as the impact of development. The illustration
of building and construction distribution increased over Semarang city, especially
coastal area, can be seen in Figure 2.5.
(a) (b)
Source: Interpretation of ALOS AVNIR-2 images and Helmi (2010) Figure 2.5. Building and construction distribution over Semarang city in (a) red in
1600, green is increasing until 1741, violet is increasing until 1880, blue is increasing until 1927 and (b) yellow is increasing until 2009
Development with the expansion in number and area of building and
infrastructure has been encouraged the increasing of population through
urbanization. Peoples started moved to the area near facilities (office building,
hospital, road, school, etc.) where all of facilities were centralized built in deltaic
area (had been knowing also as Semarang Bawah). As the effect of increasing
population, the needs of water also increase. Groundwater is one of the water
source that can be easily access by peoples and cheaper than other sources.
Peoples and industries started utilize ground water as their main water source.
When groundwater in the upper layer was not enough to supply human and
alternative. It can fulfill human and industries need of groundwater but in contrary
the side effect of groundwater pumping in instable soil layer like Semarang City
(especially Semarang Bawah) costly the decreasing of ground water level and
increasing the speed of subsided. Marsudi (2001) also found the similar things on
his research where tremendous amount of groundwater pumping in Semarang City
that exceed it aquifer capacity has led the occurrence of land subsidence. Figure
2.6. below shows the increasing amount of groundwater pumping in Semarang
city where it amount is increasing sharply since early 1990s, the era that has been
known as early industrial era in Semarang City (Abidin et.al., 2011).
Source: Murdohardono in Abidin et.al. (2011) Figure 2.6. Ground water abstraction and registered drilled wells development in
Semarang City
There area several former land subsidence research in Semarang i.e.;
I. Marsudi (2001) conducted land subsidence prediction research in Semarang
from geological point of view. Based on the (1-D) consolidation model, the
result of land subsidence prediction from his research conclude that for the
year of 2013 the ranges of subsidence will be between 87 to 190 cm from
annual condition. He also concluded that the amounts of land subsidence
become larger toward north-northeast direction and increases toward coastal
II. Kuehn et.al in 2009 conducted land subsidence research in Semarang using
Persistent Interferometery Scattered (PSI) technique. Persistent Scatterer
Interferometry technique (PSI) has been applied to improve land subsidence
mapping because former maps show an overall distribution of land
subsidence, but are inaccurate in detail. PSI measures ground motion using
SAR satellite images. For the PSI processing, 35 radar satellite images
acquired between 2002 and 2006 have been selected. Derived land subsidence
rates vary from fractions of 1 mm per year to values of 10 cm per year and
even beyond. Classification and visualization of the ground motion data
illustrate the boundary between mainly stable ground in the south of Semarang
and increasingly land-subsidence-affected land towards the coast (Kuehn et.al,
2009).
III. Abidin et.al in 2008 and 2009 conducted land subsidence investigation using
GPS survey method. By studying the characteristics and rate of change in the
height components of the coordinates from survey to survey, the land
subsidence characteristics can be derived. In order to achieve level of accuracy
the GPS static survey method based on dual-frequency carrier phase data
processing should be implemented, with stringent measurement and data
processing strategies. GPS surveys for studying land subsidence in Semarang
have been conducted on 7-13 July 2008 and 5-11 June 2009. The number of
observed points was 48 at first survey and 52 points at second survey. Results
from GPS show that land subsidence in Semarang has spatial variations,
ranging from 0.8 to 13.5 cm/year with the mean of 5.9 cm/year. Northern
region of Semarang city exhibits higher rates of subsidence compare to its
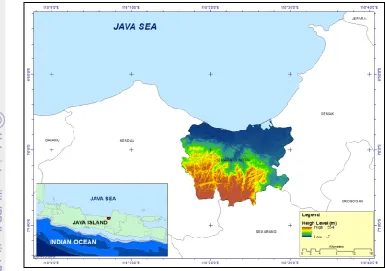
I I I . M A T E R I A L S A N D M E T H O D
3.1 Research Location and Time
Semarang city is the capital city of Central Java Province, which located in
North Coast of Java lane and connecting two biggest cities in Indonesia, Jakarta
and Surabaya. Geographically, Semarang city is located between 1090 35’ to 1100
50’ E and 60 50’ to 70 10’ S with total area around 373.70 km2 (BAPPEDA, 2005).
The borders of Semarang city administratively are:
North part: Java Sea
South part: Semarang region
East part: Demak region and Grobogan region
West part: Kendal region
Semarang is a coastal urban area situated on the lowland part/coastal area of
Central Java province. As a provincial capital city, Semarang has developed and
grown as a big city on Central Java. The residential growth and industrial
expanses in Semarang City contribute to the land subsidence and flooding.
Semarang has three different types of flooding. These are referred to as: banjir lokal (locally flooding), banjir kiriman (river flooding) and banjir rob (tidal flooding). Local and river flooding occur due to high rainfall intensity combined
with insufficient urban drainage system. Local flooding in particular places, like
in Tawang and Kaligawe, have been identified to be due to the drainage
malfunction and stoppage, as well as improper places for waste disposal.
Subsidences, which occur in Semarang, also increase the effect of flood that
seasonally happened in this city.
This research was conducted in IT (Information and Technology) for NRM
(Natural Resources Management) Research Laboratory (SEAMEO-BIOTROP
Bogor), Geomathics Research Geospatial Information Agency (Cibinong, Bogor),
and coastal area of Semarang City itself. The research was ran on October 2011
until March 2012. Research location can be seen in Figure 3.1, where the study
Figure 3.1. Research location
3.2 Data Used
This research used several different data. Those data are consisting of
landcover data, satellite images, sea level data, and bathymetry data. Each data
has different function and by combining the result of all data analysis, the goal of
the research can be achieve. Complete main and supporting data that used in this
research are:
(a) Coastline data from National Geophysical Data Center (NGDC)-NOAA
which can be accessed at http://www.ngdc.noaa.gov/mgg/shorelines/
shorelines.html. This coastline data has been accessed in October 2011.
(b) Bathymetry data as the projection of TOPEX with 30arcsecond of spatial
resolution (around 1 km) that has been accessed in October 2011. This data
can be accessed at http://topex.ucsd.edu/WWW_html/srtm30_ plus.html.
(c) Height points as the result of topographic and terrestrial survey from
(d) Topographic map (RBI) in scale of 1:25.000, produced by the National
Mapping and Coordination Survey Agency (BAKOSURTANAL). The RBI
map is map that released in 2002.
(e) Multispectral image (ALOS AVNIR-2), on June 17, 2009.
(f) BMKG’s tidal gauge annual report data of Semarang city.
(g) Data of global sea level rise from 1880 to 2009. This data has obtained from
CSIRO (http://www.cmar.csiro.au/sea level/sl_data_cmar.html) in December
2011.
(h) Regional sea level time series data in Indonesian area. This data has
obtained in December 2011 from http://sealevel.colorado.edu/
content/regional-sea-level-time-series.
(i) Result of observation at the potential inundation areas and interview to the
local resident. The interview has been conducted in February 2012.
3.3 Material Used
hardware that used in this research while software that used to for data collecting,
processing, and analyzing is divided into opensource and licensed software.
3.4 General Method
The research has been conducted using combination of spatial and numerical
modeling, remote sensing, and geographic information system. There are several
3.4.1. Measuring Daily Sea Level Change
One of the important factor affecting sea level change is tidal. Tidal level can
be estimate using tides harmonic analyst where on of tools that can deriving
realistic tide model is FVCOM (Finite Volume Coastal Ocean Model).
FVCOM has incorporated the Foreman tidal forecasting program (Chens,
2006) to compute realistic tidal elevation data for the initial conditions and on
the open boundary. It needs coastline and bathymetry as the data to build
boundary of study area. Unstructured triangular mesh has to generate as the
basic data to obtain tidal harmonic data as the input for the model. Up to six tidal
harmonic constituents can be included in the model. The six included tidal
constituents are: 1) S2 tide (period = 12 hours); 2) M2 tide (period = 12.42
hours); 3) N2 tide (period=12.66hours); 4) K1 tide (period = 23.94 hours); 5) P1
tide (period = 24.06 hours), and O1 tide (period = 25.82 hours).
The tidal forcing at the open boundary can be specified by either
amplitude/phase of each tidal constituent. The harmonic analysis is carried out
by using a least square fitting. In the second case, true clock time must be
specified and the results can be analyzed directly using Foreman’s harmonic
analysis program. All of data input must be in the same directory and format so
that model can be run. UNIX programing was used to obtain the result of the
model while some license software was used to displaying the result.
The general step of realistic tidal modeling using FVCOM can be seen in
Figure 3.2. Flowchart for daily sea level change modeling using FVCOM
Global and regional sea level rise as the other factor that causing sea level
change is taken from research institution. In this research, data of global sea
level rise was acquired from CSIRO, regional sea level change was acquired
from University of Colorado, and local sea level change was acquired from
Coastline Bathymetry
Editing Coordinate Transformation
Geoprocessing (Merge)
Extraction Extraction
Input data
UNIX Programing
Coordinate Transformation Coordinate Transformation
Format Conversion
Grid Generation - Create boundary - Define Resolution - Build Mesh
- Mesh Quality Control - Interpolate bathymetri based
on mesh pattern
UNIX Programing
BMKG Semarang. BMKG’s data is not corrected yet because tide gauge is
located in unstable soil which sinking linearly. To obtain real sea level,
BMKG’s data must be corrected with average of regional sea level change. The
period of data from BMKG and regional sea level change (from University of
Colorado) must be the same to obtained the correct result. Real sea level can be
calculated as given:
(1)
where is real sea level, SL is recent sea level from BMKG and Sreg is
average of regional sea level change.
3.4.2.Estimating Land Subsidence
This research estimating land subsidence level by calculating the deviation
from sea level which was recorded using tide gauge by BMKG in Semarang
City and isostatic sea level.
Isostatic sea level is obtained by add up yearly sea level value in first
recorded year with yearly change of regional sea level. By this calculation, the
isostatic sea level in next year can be calculated. Land subsidence level can be
calculated then by calculating the average of deviation in last year of data
recorded by BMKG and isostatic sea level in same year.
(2)
where is yearly land subsidence level, SLly is sea level in last year data
recorded from BMKG and SLr is real sea level value in the same year with SLly
and n is time period (year).
submergence area can be drawn easily based on height pattern of the research
Figure 3.3. Flowchart for terrain model of Semarang City coastal area
3.4.4.Landuse and Infrastructure Mapping
Landuse and infrastructure is the properties that related to human activity. It
change along the time whether it getting better or worse. In Semarang City, it
seems to be worse because the fact nowadays some of infrastructure has been
covered by water permanently and can’t be used anymore as it function. One
factors that causing its worse is flooding. Analyzing the change as the effect of
flooding, landuse and infrastructure map is needed and it will be easily to
analyzed if the format of map is in digital format.
To create digital landuse and infrastructure map, there are two sources that
can be used i.e. printed rupabumi map of Semarang City that has been released
by BAKOSURTANAL in 2002 and digital satellite images that derived from
ALOS-AVNIR in 2009 with 10 m of spatial resolution. The format of both data
source is different, one is digital and the other one is in analog format. To
convert analog map to be digital, it must be scanned, registered and digitized
where the result of digitizing is used as the baseline for correcting satellite image
geometrically. Once it corrected, it can be used to updating digital map as
digitizing result from 2002’s printed map. The steps of landuse and
infrastructure mapping in this research can be seen in Figure 3.4. 2008 Terrestrial Survey Result
Semarang City Public Work Office
Subsidence Point Survey
Interpolate/Gridding Interpolate/Gridding
Subsided area Digital Elevation Modeling
(DEM)
Figure 3.4. Flowchart for landuse and infrastructure Mapping
3.4.5. Ground Truth
Ground truth or field survey in this research in intended to refers of a
process in which form on a satellite image, result of data processing and
analysis is compared to what is in the reality (at the present time) in order to
verify the contents of the form on the image and result of analysis. Field survey
also intends to collect some other information, which will use in this research,
which cannot be derived from other sources and must be taken directly in the
research location.
Data that collected from ground majority truth will be used as reference for
infrastructure updating. Ground truth also utilized to comparing the result of
projection and previous occurrence of inundation. Preliminary result of data
processing was consulted to the expert as part of the research. All of that has
been conducted so that the final result will not be so differ from it reality. 2009 ALOS-AVNIR Images Printed Rupabumi 1:25.000
Geometric Correction Scanning
Registration
On Screen Digitizing Creating Color Composite Image
Landuse & Infrastructure Mapping
Field Survey
Figure 3.5. Research framework Spring Tide Sea Level Rise from
BMKG
Highest Sea Level
Semarang City Terrain Model
Recent Landuse and Infrastructure Map
Inundation
Model and Previous
Occurrence comparison Analysis
Expert Consultation
Final Result