PROFILE OF UNDERGRADUATE STUDY PROGRAMS IN INDONESIA
BASED ON EPSBED (SELF EVALUATION DOCUMENT)
(Case Study on Profile of MIPA)
YULIUS ANDRI SULISTYANTO
DEPARTMENT OF STATISTICS
FACULTY OF MATHEMATICS AND NATURAL SCIENCES
BOGOR AGRICULTURAL UNIVERSITY
ABSTRACT
YULIUS ANDRI SULISTYANTO. Profile of Undergraduate Study Programs in Indonesia Based on EPSBED (Self Evaluation Document) (Case Study on Profile of MIPA). At the direction of Dr. Ir. Asep Saefuddin, M.Sc and Dr. Ir. Hari Wijayanto, MSi.
This research developed analytical methods on EPSBED documents. EPSBED is briefly defined as an internal evaluation conducted by study program that can be used as supporting of BAN-PT accreditation and requirement of competition grant and any programs of Higher Education (Dikti). The EPSBED documents expand vastly and need to be managed then the result offer more information. The documents that consisted of institutions, study programs, lecturers and students were descriptively summarized into charts, tables, and graphs to know the profile, and so did for science field of MIPA and study program of Statistics.
It reveals that total institutions are 2,861 and 9,274 study programs in Indonesia. There are 7 study programs organized at most under MIPA and 15 institutions organized study program of Statistics. Spearman rank correlations show that ratio between number of students and lecturers at PTN and PTS for both science-field and region, ratio between number of candidate and target at PTN and PTS by science-field are independent at α level significant (α=0.10). However, ratio between number of candidate and target at PTN and PTS by region is directly related with
rs=0.404.
Globally, PTN is higher on performance than PTS, proven by some indicators such as percentage of reporting, academic title and last education of lecturers, and ratio between number of candidate and capacity (Rcc). At MIPA and Statistics, PTN is also higher indicated by ratio
between number of students and lecturers (Rsl) and ratio between number of candidate and
capacity (Rcc). Study Program of Statistics in ITS, IPB, and Brawijaya University are good in
performance.
PROFILE OF UNDERGRADUATE STUDY PROGRAMS IN INDONESIA
BASED ON EPSBED (SELF EVALUATION DOCUMENT)
(Case Study on Profile of MIPA)
By:
Yulius Andri Sulistyanto
G14051588
Final Research Report
For the partial fulfillment for the degree of Bachelor of Statistics
Faculty of Mathematics and Natural Sciences
Bogor Agricultural University
DEPARTMENT OF STATISTICS
FACULTY OF MATHEMATICS AND NATURAL SCIENCES
BOGOR AGRICULTURAL UNIVERSITY
Title
: PROFILE OF UNDERGRADUATE STUDY PROGRAMS IN
INDONESIA BASED ON EPSBED (SELF EVALUATION
DOCUMENT)
(Case Study on Profile MIPA)
Name
: Yulius Andri Sulistyanto
NRP
: G14051588
Approved by:
Advisor I,
Dr. Ir. Asep Saefuddin, M.Sc
(NIP. 195703161981031004)
Advisor II,
Dr. Ir. Hari Wijayanto, MSi
(NIP. 196504211990021001)
Acknowledged by:
Head of Department of Statistics,
Dr. Ir. Hari Wijayanto, MSi
(NIP. 196504211990021001)
BIOGRAPHY
PREFACE
I would like to thank God for everything I have experienced and also for kindness to finish this thesis. I would also like to say thank to Asep Saefuddin and Hari Wijayanto for guidance, attention, and patience so this final research report titled ‘Profile of Undergraduate Study Programs in Indonesia Based On EPSBED (Self Evaluation Document) (Case Study on Profile of MIPA)’ can be successfully finished. This report contains profile or existing condition of institutions and study programs in Indonesia based on EPSBED documents.
This thesis could not be completed without too many supports and sacrifices of my beloved family. I deliver my appreciation to everyone: Statistics Department’s lecturers and staff, Crescent staff, EPSBED team, and Dikti staff. I also want to share my love and happiness to Ardhita for loving and caring; friends at Statistics Department, KeMaKI (Keluarga Mahasiswa Katolik IPB), and KMK (Keluarga Mahasiswa Klaten) for togetherness; all of my friends, and to everyone in the world.
At last, I wish this thesis gives new experience and benefit to you read it. Once again, I thank you.
Bogor, November 2009
CONTENTS
Page
LIST OF TABLES ... ix
LIST OF FIGURES ... ix
LIST OF APPENDICES ... x
INTRODUCTION ... 1
Background ... 1
Objectives ... 1
LITERATURE REVIEW ... 1
Study Program Evaluation Based on Self-Assessment Evaluation... 1
Study Program ... 1
Spearman Rank Correlation ... 1
METHODOLOGY ... 2
Source of Data... 2
Methodology ... 2
DISCUSSION ... 2
Number of Institutions ... 3
Number of Study Programs... 3
Quality of Reporting ... 4
Data of Lecturers ... 5
Lecturers by Status ... 5
Lecturers by Academic Title and Last Education ... 6
Lecturers per Study Program ... 6
Data of Students ... 7
Students per Study Program ... 7
Ratio between Number of Students and Lecturers ... 8
Data of Alumni... 9
Ratio between Number of Alumni and Students ... 10
Ratio between Number of Candidate and Capacity ... 11
Comparison between Rsland Rcc ... 12
Science-Field of Mathematics and Natural Sciences (MIPA) ... 13
Data of Lecturers ... 13
Data of Students ... 13
Ratio between Number of Students and Lecturers ... 14
Ratio between Number of Candidate and Capacity... 15
Study Program of Statistics ... 15
Data of Lecturers and Students ... 15
Data of Candidate and Capacity... 16
CONCLUSIONS ... 17
REFERENCES ... 18
LIST OF TABLES
Page
1. Distribution of institutions by region ... 3
2. Distribution of study programs by science-field ... 3
3. Distribution of study programs by region ... 4
4. Average of number of study programs organized by an institution by region ... 4
5. Distribution of lecturers by last education ... 6
6. Ratio between number of students and lecturers per study program by science-field. ... 8
7. Ratio between number of students and lecturers per study program by region ... 9
8. Ratio between number of candidate and capacity per study program by science-field ... 11
9. Ratio between number of candidate and capacity per study program by region. ... 12
10. Distribution of study programs under MIPA based on reporting of year 2007-1 ... 13
11. Ratio between number of students and lecturers at MIPA ... 14
12. Ratio between number of candidate and capacity at MIPA ... 15
13. Ratio between number of students and lecturers at Statistics ... 16
14. Ratio between number of candidate and capacity at Statistics ... 17
LIST OF FIGURES Page 1. Scatter plot of institution and population percentage based on region ... 3
2. Percentage of study programs reported the result ... 5
3. Status reporting of PTN and PTS ... 5
4. Percentage of reporting by science-field ... 5
5. Percentage of reporting by region ... 5
6. Distribution of lecturers by status of lecturer... 6
7. Average of number of lecturers by academic title... 6
8. Average of number of lecturers per study program by science-field... 6
9. Average of number of lecturers per study program by region ... 7
10. Average of number of students per study program by science-field. ... 7
11. Average of number of students per study program by region ... 8
12. Scatter plot of Rsl of natural science-field at PTN and PTS. ... 8
13. Scatter plot of Rsl of social science-field at PTN and PTS. ... 9
14. Scatter plot of Rsl of region at PTN and PTS. ... 9
15. Average of number of alumni per study program by science-field ... 10
16. Average of number of alumni per study program by region ... 10
17. Scatter plot of Ras of science-field at PTN and PTS ... 10
18. Scatter plot of Ras of region at PTN and PTS ... 11
19. Scatter plot of Rcc of science-field at PTN and PTS ... 11
20. Scatter plot of Rcc of region at PTN and PTS ... 12
21. Scatter plot of natural science-field of Rsland Rcc. ... 12
22. Scatter plot of social science-field of Rsland Rcc... 13
23. Average of number of lecturers per study program under MIPA ... 13
24. Average of number of students per study program under MIPA ... 14
25. Scatter plot of Rsl of MIPA study programs at PTN and PTS ... 14
26. Scatter plot of Rcc of MIPA study programs at PTN and PTS ... 15
27. Proportion of lecturers according to academic title ... 15
28. Proportion of lecturers according to last education ... 16
29. Numbers of candidate and capacity for each institution of study program of Statistics ... 16
LIST OF APPENDICES
Page
1. Table of region code, provinces included and population ... 20
2. Names of public institution (PTN) based on region ... 21
3. Distribution of study programs by region and science-field ... 22
4. Percentage of reporting from year 2005-1 to 2007-2 for every science-field. ... 23
5. Average of number of lecturers per study program by science-field... 24
6. Box plot of number of lecturers per study program by science-field ... 25
7. Average of number of lecturers per study program by region ... 26
8. Box plot of number of lecturers per study program by region ... 27
9a. Average of number of lecturers per study program by science-field and region at PTN ... 28
9b. Average of number of lecturers per study program by science-field and region at PTS ... 29
10. Average of number of students per study program by science-field ... 30
11. Box plot of number of students per study program by science-field ... 31
12. Average of number of students per study program by region ... 32
13. Box plot of number of students per study program by region ... 33
14a. Average of number of students per study program by science-field and region at PTN ... 34
14b. Average of number of students per study program by science-field and region at PTS ... 35
15a. Standard measurement from Dikti ... 36
15b. Classification of science field ... 36
16a. Ratio between number of students and lecturers per study program by science-field and region at PTN ... 37
16b. Ratio between number of students and lecturers per study program by science-field and region at PTS ... 38
17. Box plot of number of alumni per study program by science-field ... 39
18. Box plot of number of alumni per study program by region... 40
19. Ratio between number of alumni and student by science-field ... 41
20. Ratio between number of alumni and student by region ... 41
21a. Ratio between number of candidate and capacity per study program by science-field and region at PTN ... 42
21b. Ratio between number of candidate and capacity per study program by science-field and region at PTS ... 43
22. Tables of descriptive statistics of number of lecturers per program study under MIPA ... 44
23. Box plot of number of lecturers per study program under MIPA ... 45
24. Tables of descriptive statistics of number of students per program study under MIPA ... 46
25. Box plot of number of students per study program under MIPA ... 47
26. Tables of descriptive statistics of ratio between number of students and lecturers per study program under MIPA ... 48
27. Tables of descriptive statistics of ratio between number of candidate and capacity per study program under MIPA ... 49
28. List of institutions organize study program of Statistics... 49
29. Distribution of lecturers at study program of Statistics ... 50
INTRODUCTION
Background
Self evaluation program is defined as an internal evaluation of study program conducted to give quality assessment and assurance of the program. The result can be used to update basic data of higher education institution and study program in form of comprehensive profile. It can also be used to arrange plan and correction of study program continuously, internal quality assurance of higher education institution and study program, and also preparation of internal or external evaluation. Beside internal evaluation, data of self evaluation becomes a basic of Study Program Evaluation Based on Self-Assessment Evaluation (Evaluasi Program Studi Berbasis Evaluasi Diri – EPSBED) that was stated by SK Dirjen Dikti No. 034/2002.
EPSBED documents are reported by private higher education institution (PTS) through local Kopertis, while public higher education institution (PTN) directly reports to Ditjen Dikti every semester. It was initially started from 2002 and now enters 13th semester (odd semester of academic year 2008/2009). EPSBED is important due to several reasons such as consideration of BAN-PT accreditation, requirement of competition grants (PHK-PMP, A1 and A2, Inherent, TIK, PKM, etc), and as formulation of policies of higher education in Indonesia. Government of Indonesia recently focuses on revitalization some fields need to be developed such as agriculture, basic science, social, etc.
At present, EPSBED is not maximized yet in use whereas it can offer more information of study program’s profile. This research explored data of EPSBED generally and field of basic sciences (mathematics and natural sciences) specifically. The results of analysis are to be used to know profile of institutions generally. It can also be used as consideration in composing government policies concerned at institutions and study programs.
Objectives:
The general objective of this research was to know the existing condition of institutions and study programs in Indonesia, summarize data of institutions, study programs, lecturers and students. The specific was to summarize science-field of Mathematics and Natural sciences (MIPA) and study program of Statistics based on EPSBED documents. It
was also to evaluate the data according to criteria of Dikti.
LITERATURE REVIEW
Study Program Evaluation Based on Self-Assessment Evaluation
Study Program Evaluation Based on Self-Assessment Evaluation (Evaluasi Program Studi Berbasis Evaluasi Diri – EPSBED) means internal evaluation conducted by study program. It can be used as supporting of BAN-PT accreditation and requirement of competition grants and any programs of Higher Education (Dikti). Regulations related to EPSBED are UU No. 20/2003, SK Menteri 184/U/2001, SK Dirjen Dikti 08/Dikti/Kep/2002, and SK Dirjen Dikti 34/Dikti/Kep/2002 (Arsyad, 2008).
EPSBED documents only include institutions under Directorate General of Higher Education, Department of National Education, while institutions under other departments are not included.
Study Program
Definition of study program based on KEPMEN234/U/2000 is totality of study plan as manual of academic/professional education implementation that be held based on curriculum also be aimed in order that students achieving best knowledge, skill, and behavior appropriate with curriculum target.
Higher education institutions are categorized into five classes that are academy, higher school, polytechnics, institute, and university. Based on KEPMEN234/U/2000, generally, academy and higher school organize at least one study program, polytechnics organizes at least three study programs. An institute organizes at least six study programs and a university organizes at least ten study programs.
Spearman Rank Correlation
Spearman rank correlation is used to decide whether observed sample data provide sufficient evidence to conclude that, in the sampled population, the variables of interest are associated (Daniel, 1978). It is based on the ranks of observations, and it can assume value between -1 and 1. Spearman rank correlation is represented by symbol rs. The
hypotheses are (one-sided):
H0: X and Y are independent H1: There is a direct (or indirect)
The test statistics is
) 1 ( 6 1
2 2
n n
d
rs i
where
n
i
i i
i R X RY
d
1
2
2 ( ) ( )
Reject H0 at the α level if the computed value
of rs is greater than the critical value or if the
p-value is less than the α level of significant. The test statistics is also the measure of association. As such, it is strictly speaking a measure of the degree of correspondence between ranks of the sample observations rather than between the observations themselves (Daniel, 1978).
When the rank of X is the same as the rank of Y for every pairs of observations (perfect direct relationship), all the differences di will
be equal to zero, and rs will be equal to +1.
Conversely, when the rank of one variable within each pair of observations (Xi, Yi) is the
reverse of the other (perfect inverse relationship), rs will be equal to -1.
METHODOLOGY
Source of Data
The research used data of EPSBED from Dikti that consisted of institutions, study programs, lecturers, and students data. The research only used data four semesters from 2005 to 2007.
Methodology
The steps were:
A. According to general objective:
i. Summarizing and interpreting quality of reporting and descriptive statistics such as tables, graphs, and pictures of EPSBED documents (institutions, study programs, lecturers, and students) based on specific categories such as status of institution, region, and science-field and also classifying science-field or region according to criteria of Dikti.
ii. Computing and interpreting the ratios that were calculated by formula:
Ratio between number of students and lecturers per study program. The value means number of students taught by a lecturer. The quality was determined based on Dikti’s criteria.
lecturers of
number
students of
number Rsl
Ratio between number of candidate and capacity. The value means the quality of study program. Higher value indicates greater performance or attractiveness of study program. The quality was also determined based on Dikti’s criteria.
capacity of
number
candidate of
number Rcc
Ratio between number of alumni and students. High value indicates high performance.
students of
number
alumni of number Ras
iii. Computing and interpreting the Spearman rank correlation between PTN and PTS for Rsl and Rcc by either
science-field or region (Daniel, 1978):
1. Each X (ratio at PTN) was ranked relative to all other observed values of X, from smallest to largest in order of magnitude. The rank of ith value of X was denoted by R(Xi).
2. Each Y (ratio at PTS) was ranked relative to all other observed values of Y, from smallest to largest in order of magnitude. The rank of ith value of Y was denoted by R(Yi).
3. If ties occurred among the X’s or among the Y’s, each tied value was assigned the mean of the rank positions for which it was tied. 4. The test statistics (rs)was computed
by the previous mentioned formula. B. According to specific objectives (using
EPSBED documents with the highest percentage of reporting):
i. Summarizing and interpreting descriptive statistics such as tables, graphs, and pictures of MIPA and also classifying study program according to criteria of Dikti.
ii. Computing the ratios that were calculated by same formula of the previous section (section A).
C. Conclusions
DISCUSSION
school, polytechnics, institute, and university), study programs, lecturers, and students. Data of students was frequently changed due to many new input and output students.
Number of Institutions
Not every institutions or study programs reported the result of self evaluation every semester. According to the data, there are 2,861 institutions, consist of 82 PTN and 2,779 PTS. PTN only consist of polytechnics, institutes, and universities. PTS consist of all classes of institutions but academies and higher schools dominated. Table 1 shows the distribution of institutions by region. Appendix 1 shows region code, provinces included, and population.
Table 1 Distribution of institutions by region. Region PTN PTS Total (%) Region I 6 304 310 (10.8) Region II 5 195 200 (7.0) Region III 4 310 314 (11.0)
Region IV 8 454 462 (16.1)
Region V 3 136 139 (4.9) Region VI 6 256 262 (9.2)
Region VII 11 298 309 (10.8) Region VIII 8 112 120 (4.2) Region IX 10 292 302 (10.6) Region X 7 209 216 (7.5) Region XI 8 136 144 (5.0) Region XII 6 77 83 (2.9) Total 82 2,779 2,861 (100)
According to Table 1 above, region IV (West Java and Banten) covers the highest number of institutions. Region VII (East Java) covers the highest number of PTN. Region XII (Maluku, North Maluku, Papua, and West Irian Jaya) covers smallest number of institutions. It indicates that education development in Indonesia is still unbalance between west and east region. Public institutions (PTN) are only 2.87% of total institutions. Names of public higher education institution (PTN) are listed in Appendix 2 based on region.
It is interesting to know scatter plot of institution and population percentage based on region. Figure 1 shows that region under dashed line has percentage of institution less than percentage of population. It also shows that region II, VIII, XI, and XII tend to be ideal since they have similar percentage of institution and population. Regions IV, VI, VII have percentage of population higher than
institution, there maybe lack of institution or overpopulated. Others have percentage of institution higher than population. From Figure 1, region III (DKI Jakarta) covers large number of institutions though owns relative small percentage of population.
Figure 1 Scatter plot of institution and population percentage based on region.
Number of Study Programs
Based on EPSBED, there are 9,274 undergraduate study programs (S-1) in Indonesia. Number of study programs of PTN are 1,955 (21%), and PTS are 7,319 (79%) study programs. Distribution of study programs by science-field can be seen in Table 2.
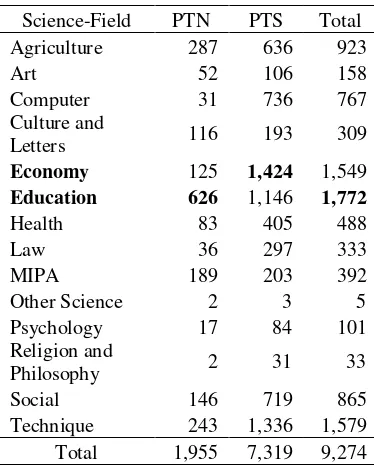
Table 2 Distribution of study programs by science-field.
Science-Field PTN PTS Total Agriculture 287 636 923
Art 52 106 158
Computer 31 736 767 Culture and
Letters 116 193 309
Economy 125 1,424 1,549
Education 626 1,146 1,772
Health 83 405 488
Law 36 297 333
MIPA 189 203 392 Other Science 2 3 5 Psychology 17 84 101 Religion and
Philosophy 2 31 33 Social 146 719 865 Technique 243 1,336 1,579 Total 1,955 7,319 9,274
5.00 10.00 15.00 20.00
population (%)
0.00 5.00 10.00 15.00
in
s
ti
tu
ti
o
n
(
%
)
I
II I II
I V
V
VI VII
VI II I X
X
XI
Table 2 above shows the distribution of study programs according to science-field. Education covers highest number of study programs. For PTN, the first rank is science-field of Education with 626 study programs; the next rank is Agriculture with 287 study programs. For PTS, first rank is Economy with 1,424 study programs; the next is Techniques with 1,336 study programs. From the column total of Table 2, three science-fields cover study programs at most are Education (1,772 study programs), Techniques (1,579 study programs), and Economy (1,549 study programs). Education and Economy describe that both science-fields are common interest of Indonesian. Science-field of Other Science covers study program at the least for both PTN and PTS.
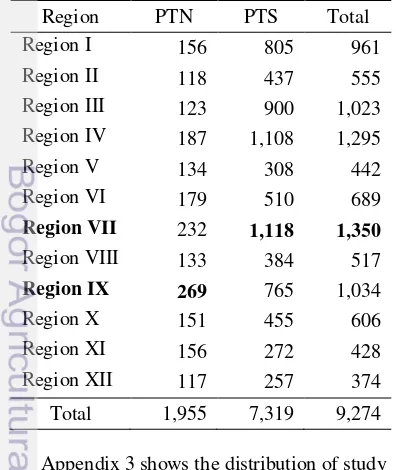
Distribution of study programs by region can be seen in Table 3. Four regions that cover study programs at most are region VII (East Java), region IV (West Java and Banten), region IX (Sulawesi), and region III (DKI Jakarta). Region VII, IV, and III are relatively overpopulated thus there are quite a lot of study programs. However, region IX covers high number of study programs since there are significant numbers of PTN which usually organize many study programs too. Conversely, Region XII (Maluku, North Maluku, Papua, West Irian Jaya) is least of all since there covers smallest number of PTS beside under populated.
Table 3 Distribution of study programs by region.
Region PTN PTS Total Region I 156 805 961 Region II 118 437 555 Region III 123 900 1,023 Region IV 187 1,108 1,295 Region V 134 308 442 Region VI 179 510 689
Region VII 232 1,118 1,350
Region VIII 133 384 517
Region IX 269 765 1,034 Region X 151 455 606 Region XI 156 272 428 Region XII 117 257 374 Total 1,955 7,319 9,274
Appendix 3 shows the distribution of study programs by region and science-field.
Education covers highest number of study programs (Table 2) and the highest number is in region VII (East Java) with 292 study programs (Appendix 3). It is appropriate with Table 3.
Table 4 below shows the number of study programs organized by an institution for every region. The highest value for PTN is 44.7 in Region V (DI Yogyakarta). Three PTN in region V are Gadjah Mada University (69 study programs), State University of Yogyakarta (53 study programs) and Indonesia Institute of Art of Yogyakarta (12 study programs). PTN organizes roughly more than 20 study programs. It may be caused by available classes of PTN that are polytechnics, institutes, and universities. These three classes at least organize three study programs. Meanwhile, PTS is dominated by academies and higher schools so that only organize small number of study programs.
For PTS, it is only about two or three study programs for every institution. The highest ratio is 3.8 in Region VII (East Java). This little number describes that private institutions which are dominated by academies and higher schools generally tend to focus on certain fields.
Table 4 Average of number of study programs organized by an institution by region. Region PTN (rank) PTS (rank) Region I 26.0 (5) 2.6 (6) Region II 23.6 (6) 2.2 (9) Region III 30.8 (2) 2.9 (4)
Region IV 23.4 (7) 2.4 (7) Region V 44.7 (1) 2.3 (8) Region VI 29.8 (3) 2.0 (11)
Region VII 21.1 (9) 3.8 (1)
Region VIII 16.6 (12) 3.4 (2) Region IX 26.9 (4) 2.6 (5) Region X 21.6 (8) 2.2 (10)
Region XI 19.5 (10) 2.0 (12) Region XII 19.5 (11) 3.3 (3)
Quality of Reporting
Every semester study programs must report the result of evaluation to Dikti. However, not all study programs did regularly. Figure 2 shows study programs that reported the result of evaluation to Dikti. Each year consisted of two semesters.
77.47%. Actually, this research only used data from year 2005 to 2007 due to percentage of reporting of year 2008 semester 1 fell away sharply. From 2005 to 2007, at the same year, reporting of odd semester seems higher than next semester. The odd semester is the beginning of academic year so there are many data change. It encourages institution to report more on the odd semester than even semester.
Figure 2 Percentage of study programs reported the result.
It can also be categorized to status of institutions, over year, PTN has done more reporting than PTS, the difference is about 12.36%, graphically can be seen in Figure 3. It is probably caused by management system of reporting that is different between PTN and PTS.
Figure 3 Status reporting of PTN and PTS. According to science-field, average of reporting percentage from year 2005-1 to 2007-2 can be seen in Figure 4. Range of reporting percentage is approximately 60% - 80%, excluding science-field of Other
Sciences. Science-field of Law is on the top, it is most frequently of reporting. The value is 84.53%. The highest reporting is in year 2006-1 (Appendix 4). For Other Sciences, roughly only one of six study programs conducts reporting. Other Science covers small number of study programs.
Figure 4 Percentage of reporting by science-field.
Percentage of reporting by region can be seen in Figure 5. Region VI (Central Java) owns the highest percentage, about 86.24%; and then region V (DI Yogyakarta) is 82.62%. The lowest value is 62.02% in region I (NAD and North Sumatra). Institutions in Java are relatively more diligent than outside Java.
Figure 5 Percentage of reporting by region.
Data of Lecturers
Data of lecturers consisted of name of lectures of institutions; equipped by some attributes that identify every lecturer. For undergraduate programs (S-1), there are 65,535 names of lecturer consist of 41,581 (63%) males and 23,954 (37%) females.
Lecturers by Status
Status of lecturers is categorized into BHMN lecturers, PNS PTN, PNS-DPK, and dosen
74,83 74,39 76,94 75,53 77,47 65,87 27,57 -20,00 40,00 60,00 80,00 100,00
Percentage of Reporting
40 50 60 70 80 90 100
2005-1 2005-2 2006-1 2006-2 2007-1 2007-2
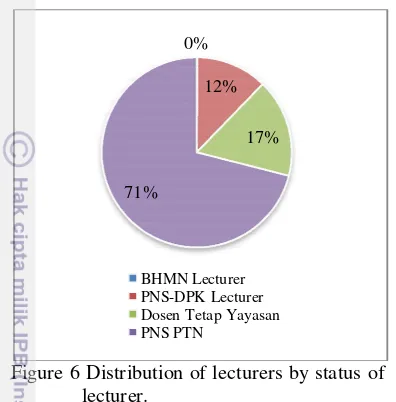
tetap yayasan. Distribution of lecturers according to status is shown in Figure 6. BHMN lecturers are only 0.13% (83 lecturers) and all are from University of Indonesia.
Figure 6 Distribution of lecturers by status of lecturer.
Lecturers by Academic Title and Last Education
Figure 7 shows number of lecturers by academic title. PTN lecturers are higher than PTS at academic title except at non jabatan. Most of PTN lecturers are lektor kepala
(32.3% of PTN lecturers) and most of PTS lecturers are non jabatan (38.9% of PTS lecturers). Guru besar in Indonesia is only 1,732 (2.64%).
Figure 7 Average of number of lecturers by academic title.
According to last education, lecturers are categorized into ten classes. From Table 5, lecturers that have last education below
Profesi is too less. Most are S-2 for PTN lecturers and S-1 for PTS lecturers. This result indicates that almost lecturers are well educated. Last educations in Table 5 are in order from lowest to highest.
Table 5 Distribution of lecturers by last education.
Lecturer’s last education
PTN PTS Total
D-2 1 0 1
D-3 6 9 15
D-4 9 11 20
NON-AKA 1 4 5
Profesi 428 61 489
S-1 13,298 9,944 23,242
S-2 26,935 8,221 35,156
S-3 5,330 553 5,883
Sp-1 439 92 531
Sp-2 185 8 193
Total 46,632 18,903 65,535
Lecturers per Study Program
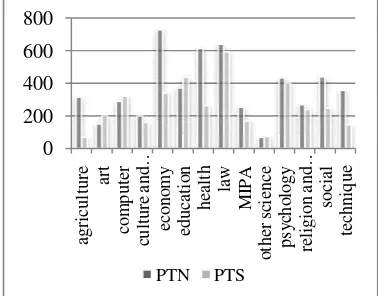
By reporting of year 2007-1, average of number of lecturers per study program by science-field can be seen in Figure 8. It shows that the averages at PTN are always higher than PTS; Science-field of Computer is equal for PTN and PTS with 12 lecturers. The highest value at PTN is at Health with 52 lecturers. At PTS, the highest is 24 lecturers at Law.
Figure 8 Average of number of lecturers per study program by science-field. Appendix 5 and 6 show the values and box plot respectively. The box plot shows that PTN contains outliers and extreme values fewer than PTS. Science-fields of Agriculture and Health at PTN apparently have more diversity than others. At PTS, the outliers and extreme values spread to all science-field. It indicates great variety about the number of lecturers per study program at PTS.
0%
12%
17%
71%
BHMN Lecturer PNS-DPK Lecturer Dosen Tetap Yayasan PNS PTN
0 5000 10000 15000 20000
Non Jabatan
Asisten Ahli
Lektor Lektor Kepala
Guru Besar
PTN PTS
0 10 20 30 40 50 60
ag
ri
cul
tur
e
ar
t
co
m
put
er
cul
tur
e
and
…
ec
o
no
m
y
educ
at
io
n
he
al
th
la
w
M
IP
A
o
the
r
sc
ie
nc
e
ps
yc
ho
lo
g
y
re
li
g
io
n
and
…
so
ci
al
te
chni
que
Average of number of lecturers per study program by region can be seen in Figure 9. By region, averages at PTN are also higher than PTS. For PTN, the values are about 20 or more; for PTS, the values are about 10 lecturers per study program. Appendix 7 and 8 show the values and box plot respectively. Box plot shows that PTN owns range wider than PTS but fewer at outliers and extreme values.
Figure 9 Average of number of lecturers per study program by region.
Appendix 9 shows average of number of lecturers per study program by science-field and region. Some entries are blank since there are no study programs appropriate to certain region. Appendix 9a shows that Health at PTN which has the highest number of lecturers (Figure 8) is highest in region I with 88 lecturers per study program. However, the highest number is 108 lecturers per study program in region IV at Law. Furthermore, region VIII which has the highest number of lecturers (Figure 9) is highest at Agriculture with 60 lecturers per study program.
Appendix 9b shows that Law at PTS which has highest number of lecturers (Figure 8) is highest in region II with about 32 lecturers per study program. Region V (DI Yogyakarta) which has the highest number of lecturers (Figure 9) is highest Computer with 23 lecturers per study program.
Data of Students
Data of students were more complex since it was often updated. It included data from the beginning of EPSBED program to the newest. The research only used data four semesters from 2005 to 2007. It can not be concluded that for the recent year, the data is more complete. It depends on the institutions and study programs.
Data of student was classified by institutions and study programs. To compare
among variables, this research only used the most data of reporting, that was year 2007-1. Based on EPSBED data of year 2007-1, number of student is 2,343,455, consists of 1,203,422 (51%) males and 1,140,033 (49%) females.
Students per Study Program
Average of number of students per study program by science-field is available in Figure 10. From chart, there are four science-fields which have higher average at PTS that are Art, Computer, Education, and Other Science.
Figure 10 Average of number of students per study program by science-field. According to Figure 10, the highest value for PTN is 732 students at Economy and for PTS is 598 students at Law, Appendix 10 shows the data in detail. Box plot in Appendix 11 shows that there are more outliers and extreme values in PTS of student’s number. The both box plot indicate large diversity about number of student, it may conditionally depend on the study program itself. Compared with data of lecturers in Figure 8, Economy at PTN apparently lacks of lecturers or maybe too many students. Agriculture at PTN and PTS seem to be ideal between number of lecturers and students.
because of so many students but little number of lecturers.
Figure 11 Average of number of students per study program by region.
Appendix 14 shows average of number of students per study program by science-field and region. For PTN (Appendix 14a), Economy at PTN which has the highest number of students is highest in region III (DKI Jakarta) with 1,667 students per study program. From data of student year 2007-1, study program of Management in Universitas Terbuka has so many students that are 7,897 students. Region III only has eight study programs under Economy. For PTS (Appendix 14b), Law is highest in region VI (Central Java) with 758 students per study programs.
Ratio between Number of Students and Lecturers
Ratio between number of students and lecturers per study program by science-field (Rsl) can be seen in Table 6. Rsl means average
number of students per lecturer. Numbers in parentheses symbolize rank of Rsl. For PTN,
science-field of Other Science is the best on ratio; a lecturer only teaches about seven or eight students. It is only a study program at science-field Other Science PTN that is
Pembangunan Wilayah in Gadjah Mada University. For PTS, the best is Agriculture.
From Table 6, Other Science at PTS owns worst ratio, 77.0. It is also only a study program that is Tourism and Hotel Management in STIE BIITM Kuta Badung. There are 77 students but only one lecturer available.
The computed rsis 0.191 and p-value is
0.256 which is greater than α level of significant (0.10), accept H0. It concludes that Rsl at PTN and PTS by science-field are
independent.
Table 6 Ratio between number of students and lecturers per study program by science-field.
Science-Field PTN PTS Agriculture 9.7 (3) 10.0 (1) Art 9.0 (2) 24.1 (8) Computer 24.6 (11) 25.8 (10) Culture and
Letters 18.1 (7) 19.7 (6) Economy 33.6 (14) 25.2 (9) Education 22.3 (9.5) 37.3 (13) Health 22.3 (9.5) 19.3 (5) Law 32.0 (12) 28.2 (12) MIPA 12.5 (4) 14.0 (3) Other Science 7.9 (1) 77.0 (14) Psychology 17.6 (6) 26.3 (11) Religion and
Philosophy 18.6 (8) 13.5 (2) Social 33.2 (13) 22.3 (7) Technique 16.5 (5) 15.7 (4) Figure 12 shows scatter plot of ratio between number of students and lecturers per study program (Rsl) at PTN and PTS from
science fields categorized natural science by Dikti. Dashed lines separate categories according to Dikti.
Figure 12 Scatter plot of Rsl of natural
science-field at PTN and PTS.
According to Figure 12 and standard measurement from Dikti shown in Appendix 15a, Agriculture is very good since the ratio under 10.0. MIPA and Technique are good for PTN and PTS. Computer and Education are poor for PTN and PTS. Science-field of Health at PTS is better than at PTN. Dikti made different criteria for natural and social sciences (Appendix 15b).
0 200 400 600 800
R
eg
I
R
eg
I
I
R
eg
I
II
R
eg
I
V
R
eg
I
X
R
eg
V
R
eg
V
I
R
eg
V
II
R
eg
V
II
I
R
eg
X
R
eg
X
I
R
eg
X
II
PTN PTS
10.00 20.00 30.00
PTS
10.00 15.00 20.00 25.00
P
T
N
education health
comp uter
MIPA
Figure 13 Scatter plot of Rsl of social
science-field at PTN and PTS.
Figure 13 shows scatter plot of Rsl of
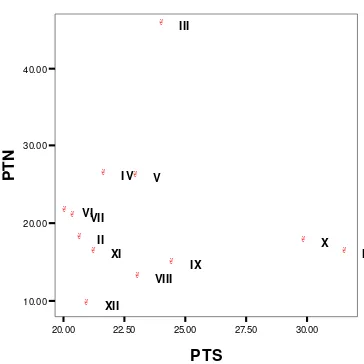
social science-field at PTN and PTS. Science-field of Religion and Philosophy, Culture and Letters, Psychology and Health are good for both PTN and PTS since the ratio between 16.0-30.0. Art, Other Science, and Education at PTN are better than at PTS. However, Social, Economy, and Law at PTS are better than at PTN according to criteria of Dikti. Table 7 Ratio between number of students and
lecturers per study program by region. Region PTN PTS Reg I 16.2 (4.5) 31.6 (12) Reg II 18.0 (7) 20.7 (3) Reg III 45.6 (12) 24.1 (9) Reg IV 26.2 (11) 21.7 (6) Reg V 26.0 (10) 23.0 (7) Reg VI 21.5 (9) 20.1 (1) Reg VII 20.8 (8) 20.4 (2) Reg VIII 12.9 (2) 23.1 (8) Reg IX 14.7 (3) 24.5 (10) Reg X 17.6 (6) 29.9 (11) Reg XI 16.2 (4.5) 21.3 (5) Reg XII 9.4 (1) 21.0 (4) Table 7 shows ratio between number of students and lecturer per study program for every region. Region XII (Maluku, North Maluku, Papua, West Irian Jaya) seems to be the best for PTN with nine students per lecturers; and for PTS, Region VI (Central Java) is the best with value of 20.1. Region III (DKI Jakarta) has the highest ratio with 45.6
at PTN; it means every lecturer roughly holds 46 students.
The computed rs is -0.172 and p-value is
0.256 which is greater than α level of significant (0.10), accept H0. It concludes that
ratio at PTN and PTS by region are independent.
Figure 14 shows scatter plot of Rsl region
at PTN and PTS. Dikti did not arrange criteria based on region. It may assume that relative small value means high performance. PTN in region III (DKI Jakarta) owns less performance and so do PTS in region I and X.
Figure 14 Scatter plot of Rsl of region at PTN
and PTS.
Appendix 16 shows ratio between number of students and lecturers per study program by science-field and region. Some entries are blank since there are no study programs appropriate to certain region. At PTN, the highest ratio between number of students and lecturers is 33.6 at Economy (Table 6). From Appendix 16a, it is shown that region IV (West Java and Banten) tend to have highest ratio at Economy. At PTS, the highest ratio is 77.0 at Other Science (Table 6) and from Appendix 16b, it is only in region VIII (Bali, NTB, and NTT). Appendix 16a also shows that only region V (DI Yogyakarta) covers all science-fields at PTN.
Data of Alumni
Figure 15 shows average of number of alumni per study program by science-field. For PTN, the highest number is 51 alumni at Economy and then is 49 alumni at Law. For PTS, the highest number is 39 alumni at Law. The lowest numbers for both PTN and PTS
15.00 30.00 45.00 60.00 75.00
PTS
10.00 15.00 20.00 25.00 30.00
P
T
N
relig
other culture
economy law
education health
psychology
art social
20.00 22.50 25.00 27.50 30.00
PTS
10.00 20.00 30.00 40.00
P
T
N
I II
III
IV V
VIVII
VIII IX
X XI
are at Art. Box plot of number of alumni per study program by science-field can be seen in Appendix 17. The box plot describes varied number of alumni for PTS especially at science-field of Economy and Education. Almost science-fields have zero minimum value of number alumni. It indicates that recording of alumni data is not good enough. Law and Psychology seem to have great diversity at both PTN and PTS.
Figure 15 Average of number of alumni per study program by science-field. Figure 16 shows average of number of alumni per study program by region. The highest for PTN is in region III (DKI Jakarta) with 35 alumni per study program. For PTS, the highest is 39 alumni in region V (DI Yogyakarta). The smallest at PTN and PTS are in region XII. Box plot in Appendix 18 shows more varied outliers and extreme value at PTS.
Figure 16 Average of number of alumni per study program by region.
Ratio between Number of Alumni and Students
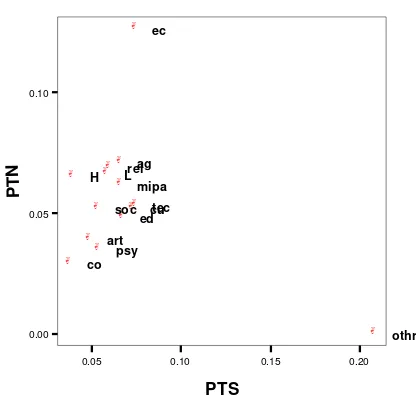
Figure 17 shows scatter plot of ratio between number of alumni and students (Ras) by
science-field. From figure below, almost all
science-fields are in a cluster with ratio about 0.05. Economy and Other Science seem to be outliers. Economy is good at PTN while Other Science is good at PTS. Economy at PTS is dominated by big universities such as University of Indonesia, Gadjah Mada University, Diponegoro University, Bogor Agricultural University, etc.
Other Science is good at PTS since there is only one study program that is Tourism and Hotel Management in STIE BIITM Kuta Badung. It has 16 alumni and 77 students. However, Other Science at PTS owns zero ratio. It is caused no number of alumni at study program of Pembangunan Wilayah in Gadjah Mada University that is the only one study program under Other Science.
Figure 17 Scatter plot of Ras of science-field at
PTN and PTS.
Figure 18 shows scatter plot of ratio between number of alumni and students (Ras)
by region. By region, science-fields are spread. PTN in region VIII (Bali, NTT, and NTB) are best than other PTN and so are PTS in region V (DI Yogyakarta). Region I and IX at PTN also region XII at PTS have roughly 5 percent alumni. Ratio between number of alumni and students by either science-field or region are available in Appendix 19 and 20. 0 10 20 30 40 50 60 Re li g io n a n d … O th er S ci en c e s Cu lt u re s A n d … E co n o m y L a w E d u ca ti o n H ea lt h Co m p u te r M a th a n d … A g ri cu lt u re P sy ch o lo g y A rt S o ci a l T ec h n iq u es PTN PTS 0 10 20 30 40 50 RE G I RE G II RE G III RE G IV RE G V RE G V I RE G V II RE G V III RE G IX RE G X RE G X I RE G X II PTN PTS
0.05 0.10 0.15 0.20
Figure 18 Scatter plot of Ras of region at PTN
and PTS.
Ratio between Number of Candidate and Capacity
Table 8 shows ratio between number of candidate and capacity per study program (Rcc) by science-field. Ratio at PTN is varied
enough. Ratio at PTS is around one, it means number of candidates is almost same with number of capacity. It indicates that PTS is more preferable than PTS. The higher value warns the interest of students.
Table 8 Ratio between number of candidate and capacity per study program by science-field.
Science-Field PTN (rank) PTS (rank) Agriculture 1.8 (13) 0.8 (13) Art 1.7 (14) 1.5 (2) Computer 13.7 (1) 1.1 (6.5) Culture and
Letters 5.6 (6) 1.0 (9.5) Economy 6.8 (5) 1.0 (9.5) Education 5.1 (9) 1.1 (6.5) Health 9.1 (2) 1.5 (2) Law 2.0 (12) 1.3 (4) MIPA 4.7 (10) 1.1 (6.5) Other Science 7.3 (4) 0.6 (14) Psychology 8.2 (3) 1.5 (2) Religion and
Philosophy 2.9 (11) 1.1 (6.5) Social 5.4 (7.5) 1.0 (11) Technique 5.4 (7.5) 0.9 (12)
The computed rs is 0.009 and p-value is
0.488 which is greater than α level of significant (0.10), accept H0. It concludes that
ratio at PTN and PTS by science-field are independent.
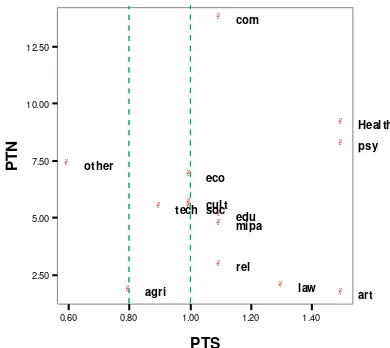
All of science fields at PTN are very good since the ratio more than 1.0. Computer at PTN owns the highest ratio. However, science fields of Agriculture, Law, and Art at PTN tend to have ratio close to one though still more than one. These three science-fields are less interesting. Ratio at PTS is around one, some under one, and others little more than one. Agriculture, Other Science, and Technique own ratio under one. It means number of candidate less than number of target. However, Art, Health, and Psychology at PTS are top three in ratio. These are most interesting at PTS.
Figure 19 Scatter plot of Rcc of science-field at
PTN and PTS.
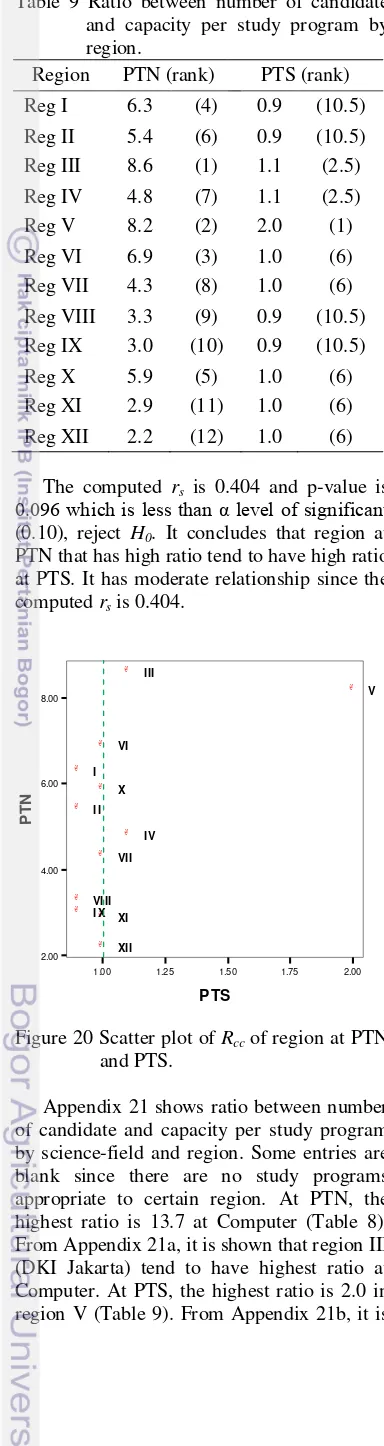
Ratio number of candidate and capacity by region is shown in Table 9 below. At PTN, the highest is 8.6 in region III (DKI Jakarta) and the lowest is 2.2 in region XII (Maluku, North Maluku, Papua, West Irian Jaya). At PTS, the highest value is 2.0 in region V (DI Yogyakarta). Ratio at PTS is around one. It explains that PTS is less interesting.
Figure 20 shows that ratio at PTS is always more than one; all regions are very good according to Dikti’s criteria. While at PTS, four regions have ratio under one that are region I, II, VIII, and IX. It means that number of candidate less than number of capacity. Ratio at PTS is also around one except in region V. Study programs of Accountancy and Management in Sekolah Tinggi Ilmu Ekonomi YKPN owns the high ratio around 9.3.
0.05 0.06 0.07 0.08 0.09
PTS
0.04 0.06 0.08 0.10
P
T
N
I
II
I II I V
V VI
VI I VI II
I X X
XI
XI I
0.60 0.80 1.00 1.20 1.40
PTS
2.50 5.00 7.50 10.00 12.50
P
T
N
agri art
com
cul t eco
edu
Heal th
law mipa other
psy
Table 9 Ratio between number of candidate and capacity per study program by region.
Region PTN (rank) PTS (rank) Reg I 6.3 (4) 0.9 (10.5) Reg II 5.4 (6) 0.9 (10.5) Reg III 8.6 (1) 1.1 (2.5) Reg IV 4.8 (7) 1.1 (2.5) Reg V 8.2 (2) 2.0 (1) Reg VI 6.9 (3) 1.0 (6) Reg VII 4.3 (8) 1.0 (6) Reg VIII 3.3 (9) 0.9 (10.5) Reg IX 3.0 (10) 0.9 (10.5) Reg X 5.9 (5) 1.0 (6) Reg XI 2.9 (11) 1.0 (6) Reg XII 2.2 (12) 1.0 (6)
The computed rs is 0.404 and p-value is 0.096 which is less than α level of significant
(0.10), reject H0. It concludes that region at
PTN that has high ratio tend to have high ratio at PTS. It has moderate relationship since the computed rs is 0.404.
Figure 20 Scatter plot of Rcc of region at PTN
and PTS.
Appendix 21 shows ratio between number of candidate and capacity per study program by science-field and region. Some entries are blank since there are no study programs appropriate to certain region. At PTN, the highest ratio is 13.7 at Computer (Table 8). From Appendix 21a, it is shown that region III (DKI Jakarta) tend to have highest ratio at Computer. At PTS, the highest ratio is 2.0 in region V (Table 9). From Appendix 21b, it is
shown that science-field of Health tend to have highest ratio in region V.
Comparison between Rsland Rcc
Figure 21 shows scatter plot of natural science-field of Rsland Rcc. All science-fields
are very good since Rcc over 1.0. Values of Rcc
at PTS are less than at PTN. Agriculture at PTN and PTS are very good in Rsl and Rcc.
MIPA and Technique at PTN and PTS are good in Rsl. Computer at PTN and PTS are
poor in Rsl. However, Health at PTS is better
than at PTN in Rsl and Education at PTN is
better than at PTs in Rsl. Generally,
science-fields at PTN have better performance (more ideal) than at PTS.
Figure 21 Scatter plot of natural science-field of Rsland Rcc.
Figure 22 shows scatter plot of social science-field of Rsl and Rcc. Values of Rcc at
PTS are less than at PTN. Globally, Rcc of
PTS are under 2.0. Religion and Philosophy at PTS and Art at PTN are very good since ratio under 15.0 and both are most ideal than others. Law, Social, and Economy at PTN and also Education at PTS seem to be unbalance since they are very good in Rcc but poor in Rsl.
Science-fields whose Rsl at range 15.0 – 30.0
are at most. There, PTN is more ideal than PTS due to relative high Rcc.
1.00 1.25 1.50 1.75 2.00
PTS
2.00 4.00 6.00 8.00
P
T
N
I
I I I II
I V
V
VI
VII
VI II I X
X
XI
XII
PTN PTS
status
2.50 5.00 7.50 10.00 12.50
Rcc
10.00 20.00 30.00
R
s
l
agri mipa
tech
health
com edu
agri mipa tech
Figure 22 Scatter plot of social science-field of Rsland Rcc.
Science-Field of Mathematics and Natural Sciences (MIPA)
Distribution of study programs under MIPA based on reporting of year 2007-1 is in Table 10. Number of institutions that organized study program under MIPA is 315 institutions consist of 182 public institutions (PTN) and 133 private institutions (PTS). From Table 10, study program of Biology is organized at most by either all institutions or public institutions. However, for PTS, study program Pharmacy is organized at most. Table 10 Distribution of study programs under
MIPA based on reporting of year 2007-1
Study Program PTN PTS Total
Biology 41 33 74
Pharmacy 11 41 52
Physics 39 14 53 Geography 5 1 6 Chemistry 40 15 55 Mathematics 38 22 60 Statistics 8 7 15 Total 182 133 315
Data of Lecturers
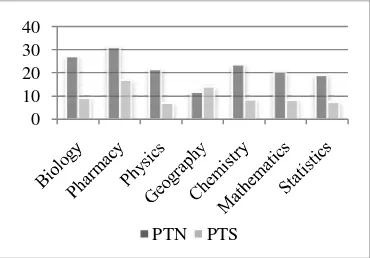
Figure 23 shows average of number of lecturers per study program under MIPA. Globally, average at PTN is higher than PTS. The highest is at Pharmacy for both PTN and PTS that is 31 lecturers (PTN) and 17 lecturers (PTS).
Figure 23 Average of number of lecturers per study program under MIPA. Appendix 22 shows descriptive statistics of number of lecturers per study program. From table (i) in Appendix 22, the largest average per study program at PTN is about 31 lecturers at study program of Pharmacy. It is in harmony with number of students. However, it owns large standard deviation. Study program of Geography contains the smallest average and covers little standard deviation. It may be concluded that number of lecturers at Geography is seemingly uniform. Study programs of Physics, Chemistry, and Mathematics have similar characteristics. Those own average from 20 to 23 and standard deviation about 8.
From table (ii) in Appendix 22, the highest average at PTS is about 17 lecturers at Pharmacy and the smallest average is about seven at Physics. Generally, values of standard deviation per study program are small except at Pharmacy. It explains that number of lecturer per study program is almost equal at PTS. However, these average values are smaller than at PTN. It is interesting that only study program of Pharmacy owns large standard deviation; diversity occurred at this study program. Box plot of number of lecturers per study program under MIPA is in Appendix 23. It is very great diversity of box plot for each study program under MIPA.
Data of Students
Figure 24 shows average of number of students per study program under MIPA. Average of PTN is always higher than PTS.
PTN PTS
status
2.00 4.00 6.00 8.00
Rcc
15.00 30.00
R
s
l
art
rel cul
psy health edu
law soc
eco
other
art
rel cul
psy
health edu
law
soc eco
0 10 20 30 40
PTN is more preferable. Pharmacy is the highest for both PTN and PTS. Pharmacy and Geography have nearly equal numbers at both PTN and PTS while others have wide range of number between PTN and PTS.
Figure 24 Average of number of students per study program under MIPA.
Appendix 24 shows descriptive statistics of number of students per study program. From table (i) in Appendix 24, average of number of students per study program at PTN is ranging from 200 to 300 except at study program of Pharmacy that is about 415 students. It needs to be concerned that study program of Geography covers large standard deviation and little minimum value. It shows that Geography is significantly varied at number of students. Study program of Statistics seems to be uniform at number of students, proven by the small standard deviation, large minimum value, and little maximum value.
From table (ii) in Appendix 24, average of number of students per study program at PTS is extremely varied. The highest value is 409 students at study program of Pharmacy, but it covers high value of standard deviation. Beside Pharmacy and Geography, others cover average of number students fewer than 100. It is small due to number of students each year approximately under 25 (assume: time of study is four years). According this result, study programs under MIPA at PTS are less interesting than at PTN. Box plot of number of students per study program under MIPA is in Appendix 25. From box plot, study program of Pharmacy is most apparently varied.
Ratio between Number of Students and Lecturers
Ratio between number of students and lecturers is listed in Table 11. For PTN, the
highest value is 26.7 at Geography. For PTS, the highest is 27.7 at Pharmacy. The value means number of students held by a lecturer. Therefore, higher value explains less performance.
Table 11 Ratio between number of students and lecturers at MIPA.
Study Program PTN PTS Biology 10.3 8.0
Pharmacy 15.2 27.7
Physics 10.8 4.2
Geography 26.7 19.7
Chemistry 11.6 9.0 Mathematics 13.8 9.2 Statistics 17.8 7.9
According to Figure 25 and standard measurement from Dikti, for PTN, study programs are good since the ratio under 20.0 except Geography. Geography is poor since the ratio at range of 21.0-30.0. For PTS, study programs are very good except Pharmacy (poor) and Geography (good).
Figure 25 Scatter plot of Rsl of MIPA study
programs at PTN and PTS.
Appendix 26 shows descriptive statistics of ratio. From table (i) in Appendix 26, it shows that study programs at PTN has fulfilled Dikti’s criteria except study program of Geography. Geography owns ratio about 26:1 and high standard deviation. High value of standard deviation means some institutions have ratio 20.0 or less. Study programs of Pharmacy and Statistics also have high value of standard deviation.
0 100 200 300 400 500
PTN PTS
5.00 10.00 15.00 20.00 25.00
PTS
10.00 15.00 20.00 25.00
P
T
N
Bi olo gy
Pharmacy
Physics
Geography
From table (ii) in Appendix 26, study program of Pharmacy at PTS has large ratio, more than good criteria from Dikti. Study programs except Pharmacy and Geography have small ratio. It indicates number of lecturers per study program is adequate or maybe those study programs lack of students. Study programs of Pharmacy and Mathematics own large standard deviation. It means variety of ratio between number of lecturers and students.
Ratio between Number of Candidate and Capacity
Ratio between number of candidate and capacity is listed in Table 12. The highest value of both PTN and PTS are at Pharmacy. Table 12 indicates that PTN is considered to be the first priority.
Appendix 27 shows the data in detail. From table (i) in Appendix 27, means of ratio at PTN are far above one. It means that number of candidate is a quite larger than capacity. Study program of Pharmacy is most interesting, indicated by high ratio. From column of minimum, some values at PTN are even less than one. It shows those study programs has not well enough performance (less interesting) or say, number of candidate is less than capacity.
Table 12 Ratio between number of candidate and capacity at MIPA.
Study Program PTN PTS Biology 4.6 1.3
Pharmacy 13.4 1.6
Physics 2.7 0.6 Geography 9.3 0.9 Chemistry 3.9 0.8 Mathematics 4.3 1.0 Statistics 7.1 0.4
From table (ii) in Appendix 27, study programs of Biology and Pharmacy have ratio above one that is number of candidate is larger than capacity. Other study programs have value under one. Globally, PTS needs to improve ratio or attractiveness.
Figure 26 shows that Rcc of study
programs Statistics and Physics at PTS are categorized very poor since ratios are under 0.8. Study programs at PTN are very good. Pharmacy seems to be most ideal of all at either PTN or PTS.
Figure 26 Scatter plot of Rcc of MIPA study
programs at PTN and PTS.
Study Program of Statistics
Based on EPSBED data of reporting year 2007-1, there are 14 institutions consist of 8 PTN and 6 PTS. The research included study program of Applied Statistics at Gajayana University so there are 15 institutions available shown in Appendix 28.
Data of Lecturers and Students
Number of lecturers for every institution is in Appendix 29. Sepuluh Nopember Institute of Technology (ITS) covers the highest number of lecturers with 41 lecturers. Bina Nusantara University covers the lowest with 4 lecturers.
Figure 27 Proportion of lecturers according to academic title.
According to academic title, proportion of lecturers can be seen in Figure 27 above. Semarang Muhammadiyah University (UMS) has the highest percentage of non jabatan. Mulawarman University has the highest of
asisten ahli; Universitas Terbuka has the highest of lektor; Bina Nusantara University
0.50 0.75 1.00 1.25 1.50
PTS
4.00 6.00 8.00 10.00 12.00
P
T
N
Biolo gy
Pharmacy
Physics
Geography
ChemistryMathematics
Statistics
0% 20% 40% 60% 80% 100%
IP
B
IS
T
A
IT
S
U
BIN
U
S
U
N
IBRA
W
U
N
D
IP
U
G
M
U
n
G
JY
U
N
H
A
S
U
IB UII
U
M
S
U
N
M
U
L
U
P
G
RI UT
non jabatan asisten ahli lektor
has the highest of lektor kepala; and Bogor Agricultural University has the highest of
guru besar.
From Figure 28, Gadjah Mada University has the highest percentage of S-3 lecturers. All of lecturers at Bina Nusantara University are S-2. Semarang Muhammadiyah University has the highest of S-1 lecturers.
Figure 28 Proportion of lecturers according to last education.
Appendix 30 shows number of male and female students. ITS covers the highest number of students with 153 males and 208 females. Akprind Institute of Science and Technology , Bina Nusantara University, Adi Buana PGRI University, and Universitas Terbuka have male students greater than female.
Table 13 Ratio between number of students and lecturers at Statistics.
Institution Ratio
Bogor Agricultural University (IPB) 11.3 Akprind Institute of Science and
Technology (ISTA) 4.8
Sepuluh Nopember Institute of
Technology (ITS) 8.8
Bina Nusantara University (UBINUS) 21.0 Brawijaya University (UNIBRAW) 13.3 Diponegoro university (UNDIP) 10.4
Gadjah Mada University (UGM) 36.1 Gajayana University (UnGJY) 3.0 Hasanudin University (UNHAS) 27.0
Bandung Islamic University (UIB) 4.3 Indonesia Islamic University (UII) 16.6 Semarang Muhammadiyah University
(UMS) 3.7
Mulawarman University (UNMUL) 27.5 PGRI Adi Buana University (UnPGRI) 1.9
Universitas Terbuka (UT) 8.2
Ratio between number of students and lecturers is shown in Table 13. Gadjah Mada
University (UGM) owns the highest ratio that is 36.1, next are Mulawarman University with 27.5 and Hasanudin University with 27.0. High value describes quite a lot of students taught by a lecturer. The smallest value is 1.9 at PGRI Adi Buana University.
According to standard measurement from Dikti, Gadjah Mada University is very poor since the ratio more than 30.0. Institutions that are categorized good according to Dikti are Bogor Agricultural University and Brawijaya University since the ratio at 11.0-20.0. Study program whose ratio under 10.0 is categorized very good.
Data of Candidate and Capacity
Figure 29 shows number of candidate and capacity for each institution. The most candidates is in Gadjah Mada University (UGM) with 1,411 candidates; the next are Sepuluh Nopember Institute of Technology (ITS), bogor Agricultural University (IPB), and Brawijaya University. Some institutions have number of candidates less than capacity that are Akprind Institute of Science and Technology , Diponegoro University, Gajayana University, Bandung Islamic University, Indonesia Islamic University, and Semarang Muhammadiyah University.
Figure 29 Numbers of candidate and capacity for each institution of study program of Statistics.
Ratio between number of candidates and capacity are shown in Table 14. The highest is 18.3 at Gadjah Mada University, the next is Bogor Agricultural University. The lowest value is 0.1 at Gajayana University. Value less than one means the number of candidates is less than capacity. Therefore, the institution needs to improve performance.
0% 20% 40% 60% 80% 100% IP B IS T A IT S U BIN U S U N IBRA W U N D IP U G M U n G JY U N H A S U
IB UII
U M S U N M U L U P G
RI UT
S3 S2 S1
0 200 400 600 800 1000 1200 1400 1600 IP B IS T A IT S U BIN U S U N IBRA W U N D IP U G M U n G JY U N H A S U
IB UII
U M S U N M U L U P G
RI UT
Table 14 Ratio between number of candidate and capacity at Statistics.
Institution Ratio
Bogor Agricultural University (IPB) 10.5 Akprind Institute of Science and
Technology (ISTA) 0.3
10 November Institute of Technology
(ITS) 9.9
Bina Nusantara University (Ubinus) 0.9 Brawijaya University (Unibraw) 4.5 Diponegoro University (Undip) 0.8 Gadjah Mada University (UGM) 18.3
Gajayana University 0.1
Hasanuddin University (Unhas) 4.6 Bandung Islamic University (UIB) 0.3 Indonesia Islamic University (UII) 0.7 Semarang Muhammadiyah
University (UMS) 0.3
Mulawarman University (Unmul) 1.1
Adi Buana PGRI University 0.3
Figure 30 Scatter plot of institutions of Rsland Rcc.
Figure 30 shows scatter plot of institutions of Rsland Rcc. It reveals that ITS is very good
in Rsl and Rcc. Bogor Agricultural University
and Unibraw are good in Rsl. Akprind Institute
of Science and Technology, Bandung Islamic University, Semarang Muhammadiyah University, Gajayana University, and Adi Buana PGRI University seem covering only little number of students. Gadjah Mada University, from Figure 30, lacks of lecturers or maybe have too many students.
According to standard measurement from Dikti; IPB, ITS, UGM, Unibraw, Unhas, and Unmul are very good since the ratio more than 1.0. Others have ratio under 1.0. If ratio is under 0.8, the institution is categorized very poor. The ratio is varied at study program of Statistics. It describes varied quality and attractiveness. Generally, ITS, IPB, and Brawijaya University are good in perfor