! "# $ %& ' # # $#$ " ( # ) *# ' )# ! + ,!+- # )$*# '
! " # $
ŝ
CONTENTS
CONTENTS i
LIST OF TABLE iv
LIST OF FIGURE v
CHAPTER I INTRODUCTION
1.1 Background 1
1.2 Research Limitation 8
1.3 Research Question 9
1.4 Research Objectives 9
1.5 Research Benefits 10
CHAPTER II THEORITICAL FRAMEWORK AND HYPOTHESIS
2.1 Theories 11
2.2 Previous Studies 24
2.3 Theoritical Framework and Hypothesis 25
2.4 Hypothesis 29
CHAPTER III RESEARCH METHODOLOGY
3.1 Research Variables and Data Type 30
3.2 Data Collecting Method and Sources 30
3.3 Research Model and Definitions 31
3.4 Operational Definition 33
3.5 Analysis Method 34
ŝŝ
CHAPTER IV RESEARCH FINDINGS
4.1 Research Variables Overview 41
4.2 Research Methodology 44
4.3 Descriptive Statistics 44
4.4 Unit Root Test 46
4.5 Cointegration Test 49
4.6 Vector Error Correction Model Estimation 52
4.7 Variance Decomposition Test 59
4.8 Economic Analysis on VECM Estimation Result 61
CHAPTER V CONCLUSION
5.1 Conclusion 64
5.2 Suggestion 65
REFERENCES 66
ŝŝŝ
LIST OF TABLE
2.1 Stock Listed in Jakarta Islamic Index 16
3.1 Definitions and Transformation of Variables 30
4.1 Research Variables 41
4.2 Descriptive Statistic 45
4.3 Unit Root Test ± Augmented Dickey-Fuller 47
4.4 Lag Length Criteria 49
4.5 Cointegration Test ± Johansen Juselius 50
4.6 Long-run Relationship 51
4.7 Appendix 72
4.8 Variance Decomposition Result 60
LIST OF FIGURE
1.1 The Pattern Movement of Jakarta Islamic Index (JII) 4
2.1 Research Framework 29
3.1 VAR/VECM Analysis Process 39
4.1 Cause Direction on Short-Run Causal Relationship VECM 54
4.6.1 Partial t-test of DJIM(2) to JII 55
4.6.2 Partial t-test of FHSI(2) to JII 55
ŝǀ
4.6.4 Partial t-test of FHSI(4) to JII 56
4.6.5 Partial t-test of LNEXRATE(4) to JII 57
4.6.6 Partial t-test of CPI(4) to JII 57
4.6.7 Partial t-test of LNM2(4) to JII 58
4.6.8 Partial t-test of BIR(4) to JII 58
4.6.9 VECM Simultaneous f-test of JII, DJIM, FHSI, EXRATE, CPI, M2
and BIR 59
ϭ
CHAPTER I
INTRODUCTION
1.1 Background
Capital market defined as a market for any long-term financial instruments (securities) which can be traded, in term of bonds or equities, either issued by government, public authorities or private company. Most countries around the world has capital market, it is because capital market drives the economic and financial condition in a country (Husnan, 1998). Capital market also as an indicator of economic growth. The volatility of index in a country can be read as a reflection of economic situation in that country. Beside that, capital market plays role as an investment tool that is useful for economic development. According to Widoatmodjo (2009), it is integrated with the function of capital market such as; first, capital market serves as an alternative for a company's capital resources. The capital gained from the public offering can be used for the company's business development, expansion, and reinvestment. Second, Capital Market serves as an alternative for public investment. People could invest their money according to their preferred returns and risk characteristics of each instrument such as stocks, bonds, mutual funds and securities. Capital market becomes a modern indicator of a country. It means, a country can be categorized as modern country if their capital market is developed.
Ϯ
in business development. Business development will cause demand of funds (short-term or long-term) increase. The increasing of fund will support the development of capital market. Legal security and rules problems often be a problems barrier in developing countries. The rule which protect the investor from emiten abuse must be stand. The institution which support the capital market such as stock exchange commision (BAPEPAM) which give the permission for the emiten, stock exchange, broker, underwriter, accountant and notary public must had exist and can work professionally to support the operation of capital market.
The Indonesia Exchange (IDX) market capitalization ratio to GDP becomes an indicator of Indonesia capital market growth. The Indonesia
([FKDQJH¶VPDUNHWFDSLWDOL]DWLRQLQLVVLJQLILFDQWO\LQFUHDVHGDURXQG
87,59% from 1.076,50 in 2008 to 2.091,38 trillion. In 2010 IDX market capitalization was increased approximately 46,13% from 2.091,38 trillion in 2009 to 3.247,10 trillion in 2010. In 2011, IDX market capitalization also increased slightly to 3,20% from 3.247,10 trillion in 2010 to 3.821,99 trillion in the end of 2011. In 2012, IDX market capitalization increased to 7,98% from 3.821,99 trillion in 2011 to 4.127 trillion in 2012. Furthermore, IDX market capitalization continously increased to 3,56% from 4.127 trillion in 2012 to 4.274,17 trillion in 2013 (BAPEPAM).
ϯ
economic system, but also non Muslim countries have high interest to take the opportunity in Muslim market which is more than 28,26% from the total population around the world (Muslim Population). Islamic capital market offers investment regarding to Islamic investment principles. The difference between conventional investment and islamic investment such as, the conventional investment defines investment as the total income subtracted by total consumption and saving for maximizing returns. Then, the islamic investment explains investment as a part of wealth that consists of return and social value (Karim, 2007).
ϰ
200 300 400 500 600 700
I II III IV I II III IV I II III IV I II III IV I II III IV I II III IV 2009 2010 2011 2012 2013 2014
JII
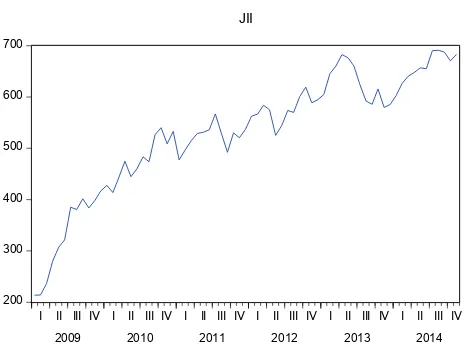
Figure 1.1: The pattern movement of Jakarta Islamic Index (JII)
Along this 6 years since 2009 until 2014, Jakarta Islamic Index has experienced excellent performance. In the first quarter of 2009, JII only reach 213 points and in the last quarter of 2009 JII reach 417 points. It show that in one year the index increasing significantly. In the last quarter of 2013, JII reach 585 points, it is decreasing from the quarter 2 in 2013 which can reach 680 points. This situation happened because of Rupiah depreciate to Dollar in the last quarter of 2013.Jakarta Islamic Index (JII) is increasing from the first quarter of 2014 and has the highest points, 690 points in the third quarter of 2014.
ϱ
The global islamic stock market which used as a proxy is Dow Jones Islamic Market Index ,Q 'RZ -RQHV HVWDEOLVKHG WKH 6KDUL¶DK-compliant indexes which called Dow Jones Islamic Market Indexes. The Dow Jones Islamic Market Index (DJIM) was the first attempt by any global index provider to create a PHDVXUHPHQWWRROIRU6KDUL¶DK-compliant investors and to reduce the research costs of as certaining and measuring 6KDUL¶DK-compliance by creating a global universe of 6KDUL¶DKscreen FRPSDQLHV DSSURYHG E\ D 6KDUL¶DK VXSHUYLVRU\ board. As the first such index and due to its unique characteristics, the DJIM has become the initial standard RI 6KDUL¶DK-compliant investing in Muslim countries, offering incentive for companies to meet the standards RI 'RZ -RQHV ,QGH[HV¶ DJIM methodology screens to be included in a high-SURILOH 6KDUL¶DK-complaint index. So, today Dow Jones Islamic Market Indexes becomes the Global Index reference for the Islamic Capital Market around the world.
In Asia regional index, Islamic capital market in Malaysia is one of the most popular reference for Islamic capital market. On 22 January 2007, FTSE Bursa Malaysia Hijrah Shariah Index (FHSI) was launched in response to increasing interest in Shariah-compliant investment. This index was the joint initiative between FTSE, Bursa Malaysia and Yasaar Ltd, the leading global Shariah consultancy. FTSE Bursa Malaysia Hijrah Shariah consists of 30 companies which had pass the screening methodology from Malaysia Shariah Advisory Council (SAC).
ϲ
used in international trade is US Dollar. For the company who do export and import actively, the stability of exchange rate between US Dollar to Rupiah is an important things. Because, when the value of Rupiah depreciation to US Dollar, it will cause the increasing price of imported goods. If the raw materials use imported goods, automatically it will increase the production cost. The increasing of production cost will reduce the company profit. The decreasing of company profit will impact to the decreasing of investor buying interest to the company. In general, it will give impact to the weakness of stock market in the country.
Regarding to other investements, islamic stocks market investment also faces the possibility of generating both risks and returns. Jakarta Islamic Index will not be free from risk as well. Islam does not merely treat investment for profit maximization, but also consists of worshiping spirit. In more practice, risk relates to price fluctuation for several stocks or VHFWRUV ,W KDSSHQHG EHFDXVH RI LQYHVWRU UHVSRQGV¶ RQ WKH FKDQJLQJ RI expected rate of return(Syukma, 2011).
In the capital market, Economic stability becomes an important variable. Investors always compare their investment possibility of return to the possible risk. The possibility of risk will be higher when the market condition is unstable. Macroeconomic stability contributes relatively significant influences to company performance. The macroeconomic stability leads investor to stake their investment in a stable or unstable market in a country.
ϳ
ϴ
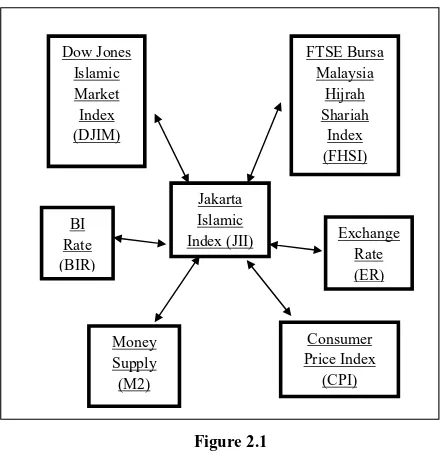
As Dow Jones Islamic Index, FTSE Bursa Malaysia Hijrah Shariah Index and domestic macroeconomic variables such as exchange rate, consumer price index, money supply and BI rate are likely having different influence on Jakarta Islamic Index, these factors then are interesting to be analyzed. Hence, this study entitled ³ISLAMIC STOCK MARKET 92/$7,/,7<'2(6$352%/(0)25,19(67256"´is going to investigate the relationshipamong Dow Jones Islamic Index (DJIM) as a Global Islamic Index, FTSE Bursa Malaysia Hijrah Shariah Index (FHSI) as a Regional Islamic Index, exchange rate (EXRATE), consumer price index (CPI), money supply (M2), BI rate (BIR) and Jakarta Islamic Index (JII) as an Indonesia Islamic Index. This study using monthly time series data from index closing price of JII, DJIM and FHSI. As macroeconomics variables, this study use exchange rate, consumer price index, money supply and BI rate monthly time series data which posted by Bank Indonesia and Indonesian Statistical Department every month.
To examine these relationship, this study use cointegration analysis where two or more non-stationary variables will cointegrated if the combinations are linear with the time series. A cointegration relationship can be seen as a long-run equilibrium. Then, to see the short-run relationship among these variables used Vector Error Correction Model (VECM).
1.2 Research Limitation
ϵ
limitations aim to restrict the analysis problems that may occurred. Therefore, this study is restricted to the following limitations:
1. Focus on Jakarta Islamic Index during research period.
2. The stock returns refer to the changes of stock price movement of the Jakarta
3. The study period is from January 2010 ± December 2014, monthly time series data.
1.3 Research Question
Based on the background that explained before, then the problem which is going tosolve in this paper defined as:
1. How does the long-run relationship (cointegrated) among those variables such as Jakarta Islamic Index, Dow Jones Islamic Market, FTSE Bursa Malaysia Hijrah Syariah Index, Exchange Rate, Consumer Price Index, Money Supply and BI Rate?
2. How does the causality and short-run relationship among those variables such as Jakarta Islamic Index, Dow Jones Islamic Market, FTSE Bursa Malaysia Hijrah Syariah Index, Exchange Rate, Consumer Price Index, Money Supply and BI Rate?
1.4 Research Objectives
Based on the research questions, thus the objectives of this paper are:
ϭϬ
2. To understand the causality among those variables and the short-run relationship among Jakarta Islamic Index, Dow Jones Islamic Market, FTSE Bursa Malaysia Hijrah Syariah Index, Exchange Rate, Consumer Price Index, Money Supply and BI Rate.
1.5 Research Benefits
This study contributes useful information for parties which are interested in developing of Indonesia Islamic capital market. The detailed of research objectives will explain below:
1. The short-run and long-run relationship amongJakarta Islamic Index, Dow Jones Islamic Index, FTSE Bursa Malaysia Hijrah Shariah Index, exchange rate, consumer price index, money supply and BI rate.
2. Information for the investor to have deep understanding in macroeconomic factors which influence Islamic stock market volatility in Indonesia.
ϭϭ
CHAPTER II
THEORITICAL FRAMEWORK AND HYPOTHESIS
2.1 Theories
2.1.1 Capital Market
Capital Market is the market in which long term financial instruments, such as bonds, equities, mutual funds and derivative instruments are traded. Capital Market serves as an alternative for a company's capital resources and public investment. It also facilitates the infrastructures needed for the selling and buying process and other related activities.
Financial instruments traded in the Capital Market are long term securities (a period of more than 1 year). They consists of stocks, bonds, warrants, rights, mutual funds, and other derivative instruments (options, futures, etc.).Capital Market Law Number 8 Year 1995 defines Capital 0DUNHWDV³WKHDFWLYLW\RIWrading and offering securities to the public, the activity of a public company with respect to securities it has issued, and the activities of securities-UHODWHGLQVWLWXWLRQVDQGSURIHVVLRQV´
ϭϮ
2.1.2 Islamic Capital Market and Islamic Stock
The Islamic stock market can be considered one of the important branches of the Islamic capital market whereby its components and activities are based on Islamic law, which is based on venerable sources and approved by the Fiqh Ulama (Securities Commisions, 2008). According to Islamic Capital Market Task Force report which published by IOSCO in 2004, "islamic capital market means where investment and financing activities and products are structured in accordance with Shariah SULQFLSOHV´%XUVD Malaysia's definition is (taken from The Islamic Capital Market, p. 2): "The Islamic Capital Market (ICM) refers to the market ZKHUH DFWLYLWLHV DUH FDUULHG RXW LQ ZD\V ZKLFK GRHVQ¶W FRQIOLFW ZLWK WKH principles of Islam. The ICM represents an assertion of religious law in capital market transactions where the market is free from prohibited activities and elements such as riba¶maisir and gharar".
In classical Islamic literature, there is no terminology of investment in capital market but, as an economic activity, transaction in capital market can categorized as trading activity (al-Bay). So that, to know the permitted of investment in capital market we must know the islamic law in trading activity.
ϭϯ
securities listed in Indonesia Stock Exchange (IDX), whereas Sharia Securities existed in the Indonesian Sharia capital market are not only consists of 30 shares that become the constituents of JII but also consists of various types of securities besides Sharia Stocks such as Sukuk and Sharia Mutual Fund.
Since November 2007, Bapepam-LK has issued Sharia Securities List which contains a list of Sharia Stock in Indonesia. With the DES, the people will be more easy to know what kind of shares are included in Sharia Stock because DES as the only reference for Sharia Securities in Indonesian. The Presence of DES followed by IDX to launch Indonesia Sharia Stock Index (ISSI) on May 12, 2011. ISSI constituency consists of all Sharia Stock listed on.
In the same years, precisely March 8, 2011, DSN-MUI has issued fatwa No.80 concerning The Implementation of Sharia Principles in The Equity Trading Mechanism at The Stock Exchange's Regular Market. In the presence Fatwa, it should be able to increase the public confidence that sharia investment in capital market was appropriate with sharia principles as long as it meet the criteria with specified in fatwa (Dewan Syariah Nasional MUI, 2011).
ϭϰ
2.1.3 Islamic Investment
According to Mankiw (2006), investment is the purchasing of goods by the individual and company that will be used in the future to produce more goods and services. Investment divided into three types based on the time period, such as short term investment, middle term investment and long term investment (Gitman, 2011). In Islamic perspective, investment must be free from three things that prohibit in Islamic Law, such as 5LED
Gharar and Maysir.
Maqasid al Shariah is one of the important pillars that should be considered for the improvement of the Islamic Investment. Maqasid al Shariah or the objectives of Islamic law represent the most comprehensive instrument that can enhance contemporary Islamic investment beside the Shariah rules and the regulator. The general objective of Shariah is to preserve the society order of the community and ensure the continuity of its healthy progress. The importance of the Maqasid al Shariah in developing Islamic investment comes from the position of the wealth itself in Islamic law and Maqasid al Shariah as well. This importance refers also to the objectives of Islamic law in finance and business transaction and to the overall goals of Shariah in wealth. The preservation and protection of wealth is classified under the category of necessary (daruriyyar). The meanings of daruriyyar are those without the protection of which there would be anarchy and chaos in society. The absence of protection for these interests would mean loss of everything that we hold dear.
Maqasid al Shariah aims to achieve various objectives in a business transaction, which are as follows:
ϭϱ
x Preservation and protection of wealth
x Transparency in wealth and finance
x Development and investment of wealth
x Prevention of harm and hardship in wealth and finance
x Ensuring jsutice in circulation of wealth.
The consideration of Maqasid al Shariah in finance and economic activities gives the way to achievement of the noble objectives of the Shariah. These objectives give value to finance, banking, trade and all business transactions. The implementation of Maqasid al Shariah will enhance the performance of finance and trade and establish justice in the business community and society at large. Furthemore, the achievement of Shariah objectives in business transactions create happiness and satisfaction and fulfill the economics needs of the society (Lahsasna & Hassan, 2011).
2.1.4 Risk and Return on Stock
Return always following the risk. To get high return investors also have to face the high risk. According to Syukma(2011), there was positive relationship between risk and return, therefore the higher expected return implies the higher possibility of risks in stock investment.
2.1.5 Jakarta Islamic Index
ϭϲ
based on the Market Value Weigthed Average Index using Laspeyres formula.
Sharia Shares that became the JII constituents are the 30 most liquid sharia that have large market capitalization. IDX conducts reviews on JII every six months, adjusted with the period of DES issuance by Bapepam-LK. After the selection of Sharia shares by Bapepam-LK, which is released as DES, IDX continued the selection process based on its trading performance(Exchange, 2013).
Below is The JII selection process performed by IDX based on the performance of sharia shares trading :
1. Selected stocks are stocks that are included in DES issued by Bapepam &LK.
2. From these Sharia stocks, IDX select 60 top stocks based on the
ODVW\HDU¶VPDUNHWFDSLWDOL]DWLRQ
3. From these 60 top stocks by market capitalization, IDX will then select 30 top stocks EDVHGRQWKHLUODVW\HDU¶VOHYHORIOLTXLGLW\LQ the regular market.
The List of JII stock issued by Indonesia Stock Exchange is based on Sharia Securities List at the period Desember 2012 - Juni 2013 issued by Bapepam-LK are as follows:
Table2.1
Stocks Listed in Jakarta Islamic Index June ± November 2014
No Code Stocks Name Note
1 AALI Astra Agro Lestari Tbk Fixed
ϭϳ
3 AKRA AKR Corporindo Tbk Fixed
4 ASII Astra International Tbk Fixed
5 ASRI Alam Sutera Realty Tbk Fixed
6 BMTR Global Mediacom Tbk Fixed
7 BSDE Bumi Serpong Damai Tbk Fixed
8 CPIN Charoen Pokphand Indonesia
Tbk
Fixed
9 CTRA Ciputra Development Tbk New
10 EXCL XL Axiata Tbk Fixed
11 ICBP Indofood CBP Sukses Makmur
Tbk
Fixed
12 INCO Vale Indonesia Tbk New
13 INDF Indofood Sukses Makmur Tbk Fixed
14 INTP Indocement Tunggal Prakarsa
Tbk
Fixed
15 ITMG Indo Tambangnya Megah Tbk Fixed
16 JSMR Jasa Marga (Persero) Tbk Fixed
17 KLBF Kalbe Farma Tbk Fixed
18 LPKR Lippo Karawaci Tbk Fixed
19 LSIP PP London Sumatra Indonesia
Tbk
Fixed
ϭϴ
21 MPPA Matahari Putra Prima Tbk Fixed
22 PGAS Perusahaan Gas Negara
(Persero) Tbk
Fixed
23 PTBA Tambang Batubara Bukit Asam
(Persero) Tbk
Fixed
24 SILO Siloam International Hospitals
Tbk
New
25 SMGR Semen Indonesia (Persero) Tbk Fixed
26 SMRA Summarecon Agung Tbk Fixed
27 TLKM Telekomunikasi Indonesia
(Persero) Tbk
Fixed
28 UNTR United Tractors Tbk Fixed
29 UNVR Unilever Indonesia Tbk Fixed
30 WIKA Wijaya Karya (Persero) Tbk Fixed
Source: Stocks Composition in Jakarta Islamic Index
No: Peng-00235/BEI.OPP/05-2014
2.1.6 Dow Jones Islamic Market Index
ϭϵ
The Dow Jones Islamic Market Index (DJIM) measure the global universe of LQYHVWDEOH HTXLWLHV WKDW KDYH EHHQ VFUHHQHG IRU 6KDUL¶DK
FRPSOLDQFHFRQVLVWHQWZLWK'RZ-RQHV,QGH[HV¶SURSULHWDU\PHWKodology. The first DJIM screens are intended to remove any companies with involvement in alcohol, pork-related products, conventional financial services, entertainment, tobacco, and weapons and defense. A second set of screens, based on financial ratios, are intended to remove companies based on debt and interest income levels. In the financial ratios screening, all of the following should be less than 33% such as total debt divided by trailing 12-PRQWKDYHUDJHPDUNHWFDSLWDOL]DWLRQWKHVXPRIDFRPSDQ\¶Vcash and interest-bearing securities divided by trailing 12-month average market capitalization, and accounts receivables divided by trailing 12-month average market capitalization ((Dow Jones & Company, 2007).
According to the empirical evidence of research from Siskawati (2011), as a global Islamic index, Dow Jones Islamic Market Index (DJIM) had cointegration (long term equilibrium) with Jakarta Islamic Index. Granger causality test also shows that there is unidirectional result between Dow Jones Islamic Market Index (DJIM) and Jakarta Islamic Index (JII). It implies that Jakarta Islamic Index (JII) affected by the Global Islamic Index (Dow Jones Islamic Market Index).
2.1.7 FTSE Bursa Malaysia Hijrah Shariah
FTSE Bursa Malaysia Hijrah Shariah Index (FHSI) was launched on January, 22nd, 2007 in response to increasing interest in Shariah-compliant
ϮϬ
Companies in the index are The index is calculated based on price and total return methodologies, both real time intra-second and end-of-day.
According to FTSE Factsheet (December, 2014), FTSE Bursa Malaysia Hijrah Shariah Index has screening methodology which screened by the Malaysian Securities Commission's Shariah Advisory Council (SAC) and the leading global Shariah consultancy, Yasaar Ltd, against aclear set of guiding principles. Constituents in the index are not permitted to be involved in any of the following core activities: banking or any other interest-related activity, such as lender and brokerages, but excluding Islamic financial institutions, alcohol, tobacco, gaming, arms manufacturing life insurance and pork and non-halal production, packaging and processing or any other activity related to pork and non-halal food.Companies that meet the following criteria, which are assessed under Shariah principles andcommonly accepted philosophies, are also excluded from the index:
x Ratios of debt and debt service in combination that are unacceptable and indicative of an inappropriate use of leverage relative to their assets.
x Income from cash or near cash equivalents or inappropriate levels of receivables to assets.
x Liquid assets to illiquid assets that exceed the percentages permitted.
x Cash and cash equivalents to total assets that exceed the percentage permitted.
Ϯϭ
return of Islamic stock market in Indonesia is significantly affected by the return of Islamic stock market in Malaysia (Hussin, Yusof, Muhammad, Razak, Hasim, & Marwan, 2013).
2.1.8 Exchange Rate
The exchange rate is the price at which residents of those countries trade with each other. Economists distiungish between two exchange rates, such as the nominal exchange rate and the real exchange rate. The nominal exchange rate is the relative price of currency of two countries. The real exchange rate is the relative price of the goods of two countries. That is, the real exchange rate tells us the rate at which we can trade the goods of one country for the goods of another (Mankiw, 2006).
Traditional economic models argue that changes in exchange rates affect balance sheet items of a firm through its competitiveness as expressed in foreign currency and ultimately, profits and equity leading to price adjustments in the capital markets. This volatility in price adjustments of individual firms leads to the impact on the index.
Some empirical evidences about the influence of exchange rate on stock returns show that exchange rate had negative impact on stock returns. The research from Vejzagic and Zarafat (2013) and Mohd Yahya (2012) show that exchange rate had negative influence on stock returns in Malaysia. That research inline with the research from Syukma (2011) who found that exchange rate of Rupiah/Us Dollar had negative influence on stock returns in Jakarta Islamic Index (JII).
2.1.9 Consumer Price Index
ϮϮ
average level of price for all goods and services . and we can be defined it as a permanent increase in the aggregate price level which implies a diminishing of the purchasing power and increase the cost of living. It is important to note from this definition that the movement in the price level needs to be permanent to believe it as inflation. Inflation considered one of the economic phenomena that still polarized attention of both development and developing countries.
Some differences of relationship among inflation and stock return are found in several researches. In 2009, consumer price index had negative relationship to stock price in Pakistan stock market. In the next two years, consumer price index also had negative relationship to Islamic stock market in Malaysian stock market (Hussin, Muhammad, Abu, & Awang, 2012). In addition, inflation had positive relationship to stock returns of 10 companies listed in Jakarta Islamic Index (Panatagama, 2013).
2.1.10 Money Supply
Money supply is the total amount of money that circulate in society at specific time. There are several standard measures of the money supply, including monetary base, M1, M2 and M3. The monetary base is defined as the sum of currency in circulation and reserve balances. M1 is defined as
WKH VXP RI FXUUHQF\ SOXV GHPDQG GHSRVLWV WUDYHOHU¶V FKHFNV DQG RWKHU
Ϯϯ
According to Humpe & Macmillan (2007), money supply influence stock market in three mechanisms: First, changes in the money supply may be related to unanticipated increases in inflation and future inflation uncertainty and hence negatively related to the stock market; Second, changes in the money supply may positively influence the stock market through its impact on economic activity; Finally, portfolio theory suggests a positive relationship, since it relates an increase in the money supply to a portfolio shift from non-interest bearing money to financial assets including equities.
Friedman and Schwartz in Vejzagic M (2013) examined the link between money supply and stock returns by their hypothesized that money supply would cause the aggregate economy and the expected stock returns. An increase in M2 growth would indicate excess liquidity for buying stocks, so that it increasing the stock prices.
2.1.11Interest Rate
Interest rate Interest Rate is a rate which is charged or paid for the use of money. It is often expressed as an annual percentage of the principal. It is calculated by dividing the amount of interest by the amount of principal. Interest rates often change as a result of inflation and Federal Reserve policies. This can play a vital factor in deciding the amount of savings as opposed to borrowing. If interest rate is low, people will reduce savings in banks and invest more money in the market indexes, therefore it is presumed that interest this may play an important role.
Ϯϰ
2.2 Previous Studies
Study about stock returns had done many times by economist previously. There are plenty of domestic and international researches on stock returns. Each research comes with different analysis tools and results. Here are some researches on stock returns in several countries such as M.
6\DILL $QWRQLR ++ RQ ³7KH ,VODPLF &DSLWDO 0DUNHW 9RODWLOLW\´
which use VAR/VECM model. The result shows that in the long-term, all selected macroeconomic variables except Dow Jones Index variable have significantly affect in both Islamic stock market FHSI and JII. While in the short-term there is no any selected macroeconomic variables that significantly affect FHSI and only inflation, exchange rate and crude oil price variables seem to significantly affect JII.
Research from 3DQDWDJDPD )0 RQ ³7KH $QDO\VLV RI Macroeconomic Variables that Influence Stock Returns Jakarta Islamic
,QGH[DQG,WV9$5)RUHFDVWLQJ´XVH9$5PRGHOThe result of this study indicates negative influence of Bank Indonesia interest rate and Brent international oil price towards stock returns of 10 companies listed in JII. In addition costumer price index had positive influence to stock returns of 10 companies listed in JII. Meanwhile, trading volume had no causal relationship with stock returns; therefore, it cannot be involved in the Vector Autoregressive model.
According to the research from Sohail, N., & Husain, Z. (2009) on
Ϯϱ
money supply had a significant positive effect on the stock returns in the long-run.
The previous studies provide relevant information and motivate future research as enrichment of the empirical study to stock market field. Therefore, the author distinguishes this study by offering these following particular differences:
1. Research case study
This study will cover the case of Islamic Stock Market volatility listed in Jakarta Islamic Index (JII) starting from year 2010 until 2014.
2. Variables
This study use Dow Jones Islamic Market Index (DJIM), FTSE Bursa Malaysia Hijrah Shariah (FHSI), exchange rate, customer price index, money supply, and BI rate which have various contradictions in the previous studies.
3. Research Period
The data that will be used in this study consists of Jakarta Islamic Index (JII) since year 2010 until 2014.
2.3 Theoritical Framework and Hypothesis
2.3.1 The Influence of Dow Jones Islamic Market Index (DJIM) to
Jakarta Islamic Index
Ϯϲ
Jones Islamic Market Index can describe the performance of the American economy. Thus, a strengthening this index reflects improved performance of the U.S. economy. According to the research from Mohd Yahya Mohd Hussin (2013), Dow Jones Islamic Market Index had a significant bi-directional causality to FTSE Bursa Malaysia Hijrah Shariah Index.
2.3.2 The Influence of FTSE Bursa Malaysia Hijrah Shariah Index
(FHSI) to Jakarta Islamic Index
Domestic stock market not only influenced by global capital market but also from regional capital market. The regional capital market which used as a standard of Islamic capital market is FTSE Bursa Malaysia Hijrah Shariah Index (FHSI). FTSE Bursa Malaysia Hijrah Shariah Index has been designed to be used as the basis of Shariah-compliant investment products that meet the screening requirements of international Islamic investors. According to Mohd Yahya Mohd Hussin (2013), the FTSE Bursa Malaysia Hijrah Shariah Index had no co-integration relationship to Indonesian Islamic stock market in long-term equilibrium. On the other hand, the results of the Granger causality test show a significant uni-directional causality between FTSE Bursa Malaysia Hijrah Shariah Index and Jakarta Islamic Index. Therefore, the return of Jakarta Islamic Index is significantly affected by the return of FTSE Bursa Malaysia Hijrah Shariah Index.
2.3.3 The Influence of Exchange Rate to Jakarta Islamic Index
Ϯϳ
for specific industry (M. H. Cheng, 2011). In case of a depreciation of the domestic currency, it will lead the imported products become more expensive in terms of the home currency. According to H. M Ibrahim(2003) indicated that exchange rate was negatively associated with stock prices. We predict that exchange rate is negatively affected on stock returns.
2.3.4 The Influence of Inflation to Jakarta Islamic Index
When the stock price is change, the link between inflation and stock return will appear. Besides that, the fluctuation in the inflation rate represents proportion of risk associated with increase uncertainty in the return movement. Thus, consumer price index (CPI) is used to measure the inflation rate. It measures average change in prices of goods and services in a particular period of time. Inflation becomes reason for government to maintain value of money circulating in the market. It implies a mandatory policy to increase the discount rate that will reduce present value of cash money circulating in the market. So that, an increasing in inflation rate will negatively influence equity price and increases the production cost. Most study shows that inflation has negative impact to stock returns, as found by Syukma(2011) on the relation between inflation and coal stock returns in Jakarta Islamic Index and also Pramod Kumar Naik (2012) study between inflation and Indian stock prices.
2.3.5 The Influence of Money Supply to Jakarta Islamic Index
Ϯϴ
corporate profit. So, it will further increase the future cash flow that would gave impact to the increasing of stock prices.
The negative relationship of money supply on stock returns showed by the research from Hasanzadeh & Kianvand (2012) and Hussin et al (2013). This negative relationship was based on the direct relationship between money supply and inflation. In this direct relationship, the increasing of money supply will cause the increasing of discount rate and further will decreasing the price of stock market (Fama, 1981).
2.3.6 The Influence of BI Rate to Jakarta Islamic Index
BI rate becomes the representative of policy rate reflecting the monetary policy stand. It is adopted by Bank Indonesia and being publicly announced by the Board of Governors of Bank Indonesia in each monthly Board of Governors Meeting. BI rate serves as opportunity cost of stock market investment and standard of Indonesian interest rate measurement. The increase in interest rate stimulates willingness of people to hold their money rather than bearing uncertain risk of investment; therefore, the increasing of interest rate will negatively influence stock market.
Ϯϵ
Figure 2.1
Research Framework
2.4 Hypothesis
On the basis of theoritical backgrounds, previous research results and research framework, this study develop these two following hypothesis:
1.H1: There is cointegration and long-run relationship among those research variables such as Jakarta Islamic Index, Dow Jones Islamic Market, FTSE Bursa Malaysia Hijrah Syariah Index, Exchange Rate, Consumer Price Index, Money Supply and BI Rate
ϯϯ
3.4 Operational Definition
3.4.1 Dependent Variable
Dependent variable is a variable that being main focus of this study. The dependent variable that used in this study is Jakarta Islamic Index return which processed from monthly closing price. The value of islamic stock returns is obtained by calculation of Jakarta Islamic Index closing price by using this following equation:
Rt = ln (Pt) ± ln (Pt-1)
Where Rtis the Return for Month t, Pt is Closing price of stock for month t and Pt-1 is Closing price of stock for month t-1 respectively.
3.4.2 Independent Variables
a. Dow Jones Islamic Market Index
One of the global macroeconomic variable is the Dow Jones Industrial Index. It is one of the major indexes in the United Stated covering 30 of the largest multinational companies in the America. Dow Jones Index can describes the performance of the American economy. Thus, a strengthening this index reflects improved performance of the U.S. economy.
b. FTSE Bursa Malaysia Hijrah Shariah Index
FTSE Bursa Malaysia Hijrah Shariah Index is one of the benchmark of Islamic stock market in Asian regional. FTSE Bursa Malaysia Hijrah Shariah Index launched on 22 January 2007. It consists of 30 largest multinational companies in Malaysia.
c. Consumer Price Index
ϯϰ
year of 2010. Consumer price index define the level of goods price and services which consume by society. CPI data that used in this study is monthly data which stated in indexes.
d. Exchange Rate
Exchange rate that used in this study is middle exchange rate which is the exchange rate at the closing of money market. Exchange rate that used in this study is monthly exchange rate which stated in IDR/USD.
e. Money Supply
Money supply is the total amount of money available in an economy. Money supply is divided into M1 and M2. Money supply in this study stated in Rupiah.
f. BI Rate
BI rate becomes the representative of policy rate reflecting the monetary policy stand. It is adopted by Bank Indonesia and being publicly announced by the Board of Governors of Bank Indonesia in each monthly Board of Governors Meeting. BI rate serves as opportunity cost of stock market investment and standard of Indonesian interest rate measurement.
3.5 Analysis Method
ϯϵ
According to Sims (1992) in Ajija (2007) impulse response function (IRF) illustrates the expectation of future period from variable forecast deviation due to other variable innovation effects. It exposes the existence of shock variable to other variable until its equilibrium point. Variance decomposition of forecast error variance decomposition becomes an instrument of VAR that separate the estimated variable to be shock variable or innovation variable; where it assumes that the innovation variable do not correlate each others. The variance decomposition analysis provides information of the movement of shock variable to certain variables and so to another shock variable.
3.6 Research Plan
In order to understand the undergraduate thesis clearly, so the researcher divided the materials into several sub-chapters with systematic writing as follows:
Chapter I, Introduction;This chapter describes the general information
that the research background, problem formulation, purpose and benefits of the research, the scope of research, time and place of study, research methodology, and systematic research.Chapter II, Theoritical Framework and Hypothesis; This chapter contains the theory that some
excerpts taken from the book, in the form of understanding and definition. This chapter also explains the basic concepts of islamic capital market, the basic concepts of islamic stock , the concepts of risk and returns on stock, the concepts and methodology of Jakarta Islamic Index, Dow Jones Islamic Market Index, FTSE Bursa Malaysia Hijrah Shariah Index and other definitions associated with the macroeconomics variables. Chapter III, Research Methodology; This chapter contains the definition of variables
ϰϬ
cointegration test for long-term analysis and Vector Error Correction Model (VECM) for short-term analysis. Chapter IV, Research Findings; This chapter describes the general overview of macroeconomics condition in Indonesia, Jakarta Islamic Index, Dow Jones Islamic Market Index and FTSE Bursa Malaysia Hijrah Shariah Index. It also contains the result from the analysis of cointegration test and vector error correction model (VECM), the result table and diagram, the analysis of empirical result with the theoritical framework and previous study. Chapter V, Conclusions; This chapter contains of conclusion from the research, suggestion for the policy maker in Indonesia and suggestion for the next research.
ϰϭ
CHAPTER IV
RESEARCH FINDINGS
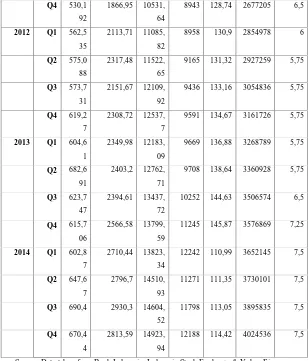
4.1 Research Variables Overview
4.1.1 Dependent and Independent Variables Overview
The following overviews introduce entire variables of study. This study had seven variables which are stock returns of Jakarta Islamic Index (JII), stock returns of Dow Jones Islamic Market Index (DJIM), stock returns of FTSE Bursa Malaysia Hijrah Shariah Index (FHSI),Exchange Rate (LNEXRATE), Consumer Price Index (CPI), Money Supply (LNM2) and BI Rate (BIR).
Table 4.1
Research Variables
JII DJIM FHSI EXRA
TE
9349 118,01 2073860 6,5
Q2 474,7
96
2043,32 9614,7
4
9012 118,37 2116024 6,5
Q3 483,3
22
1765,25 9545,1
7
8910 121,74 2217589 6,5
Q4 540,2
91
2028,1 10350,
21
8923 123,29 2308846 6,5
2011 Q1 477,5
14
2241,25 10574,
64
8921 126,29 2436679 6,5
Q2 528,7
63
2337,6 10633,
94
8553 125,66 2434478 6,75
Q3 567,1
19
2335,05 10889,
99
ϰϮ
8943 128,74 2677205 6,5
2012 Q1 562,5
35
2113,71 11085,
82
8958 130,9 2854978 6
Q2 575,0
88
2317,48 11522,
65
9165 131,32 2927259 5,75
Q3 573,7
31
2151,67 12109,
92
9436 133,16 3054836 5,75
Q4 619,2
7
2308,72 12537,
7
9591 134,67 3161726 5,75
2013 Q1 604,6
1
2349,98 12183,
09
9669 136,88 3268789 5,75
Q2 682,6
91
2403,2 12762,
71
9708 138,64 3360928 5,75
Q3 623,7
47
2394,61 13437,
72
10252 144,63 3506574 6,5
Q4 615,7
06
2566,58 13799,
59
11245 145,87 3576869 7,25
2014 Q1 602,8
7
2710,44 13823,
34
12242 110,99 3652145 7,5
Q2 647,6
7
2796,7 14510,
93
11271 111,35 3730101 7,5
Q3 690,4 2930,3 14604,
52
11798 113,05 3895835 7,5
Q4 670,4
4
2813,59 14923,
94
12188 114,42 4024536 7,5
Source: Data taken from Bank Indonesia, Indonesia Stock Exchange & Yahoo Finance
ϰϯ
Al ghurm bil ghunm and al kharaj bil daman
(The entitlement to revenue depends on a corresponding liability for loss)
ϰϰ
rate in first quarter 2010 at 6,5% and experienced its lowest rate in second quarter 2012 until second quarter 2013 at 5.75 % and the highest rate in the last quarter of 2014 such amount 7,5%.
In term of JII it experienced relatively positive sentiment during 2010 until 2014. There are some negative sentiment in Quarter 4 2011, Quarter 3 2012, Quarter 1 2013, Quarter 3 & Quarter 4 2013 and Quarter 1 & 4 2014. It is influenced by the general trend in Indonesia and International capital market after the US financial crisis in 2008 and 2012.
4.2 Research Methodology
This research methodology applies these following econometric procedures to analyze the relationship between stock returns and macroeconomic variables:
a. Descriptive Statistics b. Unit Root Testing c. Cointegration Test
d. Vector Error Correction Model Estimation e. Variance Decomposition Test
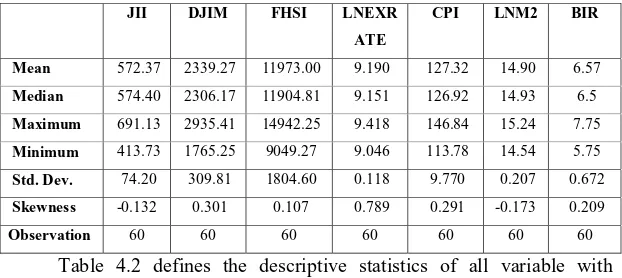
4.3 Descriptive Statistics
Descriptive statistics represents the entire population or sample in the study and explains data central tendency and dispersion measurement.
ϰϱ
Table 4.2
Descriptive Statistic
JII DJIM FHSI LNEXR
ATE
CPI LNM2 BIR
Mean 572.37 2339.27 11973.00 9.190 127.32 14.90 6.57
Median 574.40 2306.17 11904.81 9.151 126.92 14.93 6.5
Maximum 691.13 2935.41 14942.25 9.418 146.84 15.24 7.75
Minimum 413.73 1765.25 9049.27 9.046 113.78 14.54 5.75
Std. Dev. 74.20 309.81 1804.60 0.118 9.770 0.207 0.672
Skewness -0.132 0.301 0.107 0.789 0.291 -0.173 0.209
Observation 60 60 60 60 60 60 60
ϰϳ
of the seven variables in this study in level and first difference. The unit root result from each variables are shown in the table below.
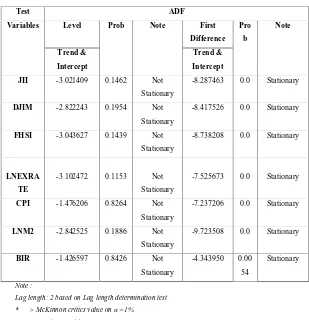
Table 4.3
Unit Root Test ± Augmented Dickey-Fuller (ADF)
Test ADF
Variables Level Prob Note First
Difference
-3.102472 0.1153 Not
Stationary
Lag length: 2 based on Lag length determination test * > McKinnon critics value on Į 1%
** > McKinnon critics value on Į 5% *** > McKinnon critics value on Į 10%
ϰϵ
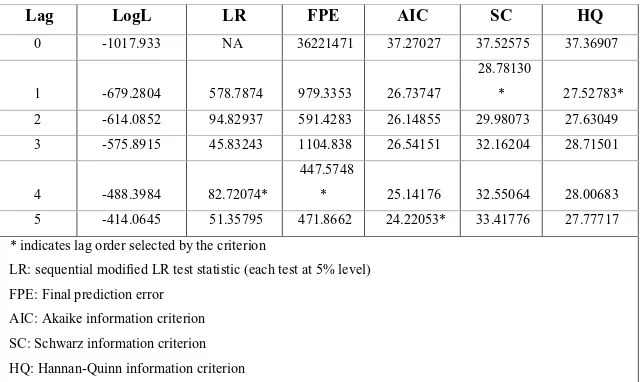
Table 4.4
Lag Length Criteria
Table 4.4 shows the result of automatic lag length determination by
Eviews 8. It shows that based on the value ofSchwarz information criterion
(SC) and Hannan-Quinn Information(HQ) match in lag 1 which are 28.78130 and 27.52783.. The value of LR statistic and Final prediction error (FPE) match in lag 4 which are 82.72074 and 447.5748 respectively. Meanwhile, Akaike information criterion (AIC) match in lag 5 which is 22.22053 respectively.Automatic Eviews7 lag length determines lag 4 as proper lag length in VECM estimation.
4.5 Cointegration Test
Cointegration test conducted by examine the stationarity from each variable in this research. Those variables must be integrated at order or the similar degree. The integrating variables define similar stochastic trend and long-term similar movement. Cointegration test examined by the Johansen
Lag LogL LR FPE AIC SC HQ
* indicates lag order selected by the criterion
LR: sequential modified LR test statistic (each test at 5% level)
FPE: Final prediction error
AIC: Akaike information criterion
SC: Schwarz information criterion
ϱϬ
Juselius Cointegration test. In order to find out the number of cointegrating vectors, Trace statistic and Maximal Eigen value tests were used. The
UHVXOWRIWKH-RKDQVHQ¶V7UDFHDQG0D[(LJHQYDOXHWHVWDUHVKRZQRQ7DEOH
4.5 below.
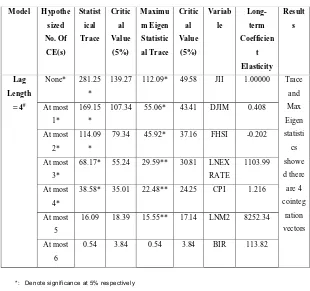
Table 4.5
Cointegration Test ± Johansen Juselius
Model Hypothe
16.09 18.39 15.55** 17.14 LNM2 8252.34
At most
6
0.54 3.84 0.54 3.84 BIR 113.82
*: Denote significance at 5% respectively
**: MacKinnon-Haug-Michelis (1999) p-values
# : Lag length based on Akaike Information Criterion (AIC)
ϱϭ
second maximum Eigen value statistics. The results of trace statistics and maximum Eigen value were at 2 months lag length. The MacKinnon-Haug-Michelis p-YDOXHVDUHDQGĮ 7KHUHIRUHZH reject Ho and Accept Ha or the model is significant. Trace test and Max Eigen statistics showed the existence of 5 cointegrating vectors among
YDULDEOHVDWWKHĮ ,QWKHRWKHUZRUGWKHUHLV cointegration among JII, DJIM, FHSI, LNEXRATE, CPI, LNM2 and BIR for periods 2010 to 2014.
Based on Johansen and Juselius Cointegration test, the first normalized co-integrated vector towards JII variable using lag period proposed by AIC indicate long term relationship among DJIM, FHSI, LNEXRATE, CPI, LNM2, BIR and stock returns of Jakarta Islamic Index (JII). The result of the cointegration relationship can be summarized in table 4.5 above. These value represent long-term elasticity measures, due to logarithmic transformation of JII, FHSI, CPI, M2 and BIR. Thus the cointegration relationship can be re-expressed in table 4.6 below.
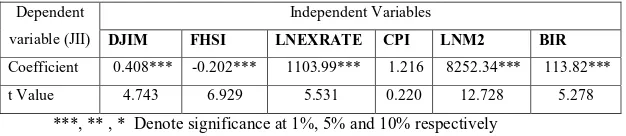
Table 4.6
Long-term Relationship
Dependent
variable (JII)
Independent Variables
DJIM FHSI LNEXRATE CPI LNM2 BIR
Coefficient 0.408*** -0.202*** 1103.99*** 1.216 8252.34*** 113.82***
t Value 4.743 6.929 5.531 0.220 12.728 5.278
***, ** , * Denote significance at 1%, 5% and 10% respectively
The first normalized equation was estimated as below:
RJII =0.408 RDJIM - 0.202 FHSI + 1103.99 LNEXRATE + 1.216 CPI
ϱϮ
According to the first normalized equation, it shows the long term relationship among these variables. Stock returns in Jakarta Islamic Index (RJII) showed significantly negative relation with stock returns in FTSE Bursa Malaysia Hijrah Shariah Index (FHSI). The JII also had significantly positive relation withDow Jones Islamic Market Index (DJIM), exchange rate (LNEXRATE), money supply (LNM2) and Bank Indonesia Interest Rate (BIR). Meanwhile, Consumer Price Index (CPI) showed positive relation but not significant.
4.6 Vector Error Correction Model Estimation
In order to do causality test and capture the short-term dynamics of the model, Vector Error Correction Model was applied. In this research, VECM tested in lag 4 as a consistancy on the test previously. The results of VECM were reported in table 4.7 (see in the appendix)
Based on the result of VECM test above, it is found that the coefficient of CointEq1, CointEq2, CointEq3, CointEq4 and CointEq5 showed the speed of adjustment of disequilibrium in the period of study. As three of the error correction term were significant with negative signs, hence the results of vector error correction model (VECM) depicted that the adjustment in JII were due to the first, the third and the forth error correction term. The equation below showed that the coefficient of ecm1(-1) was significant which implied that JII adjusted by 72.9 percent in one month to the long term equilibrium. The result showed that it took approximately one point three months (1/0.729 = 1.37) to eliminate the disequilibrium. The coefficient of the second and the third error correction term showed speedy adjusment.
D(JII) = 6.663 + 0.113 D(JII(-1)) + 0.507 D(JII(-2)) + 0.409 D(JII(-3))** ± 0.163
ϱϯ
± 0.035 D(DJIM(-4)) ± 0.011 D(FHSI(-1)) ± 0.053 D(FHSI(-2))*** ± 0.089 D(FHSI(-3))**** ± 0.061 D(FHSI(-4))*** + 221.69D(LNEXRATE(-1)) +
137.84 D(LNEXRATE(-2)) ± 142.96 D(LNEXRATE(-3)) ± 176.91
D(LNEXRATE(-4))* ± 6.514 D(CPI(-1)) ± 4.510 D(CPI(-2)) ± 4.252
D(CPI(-3)) ± 15.071 D(CPI(-4))* + 97.07D(LNM2(-1))+ 299.09 D(LNM2(-2)) +
83.821 D(LNM2(-3)) + 637.38 D(LNM2(-4))** +61.057 D(BIR(-1)) ± 22.88
D(BIR(-2)) ± 5.890 D(BIR(-3)) ± 68.562 D(BIR(-4))* ± 0.729CointEq1+
0.049CointEq2±0.082 CointEq3 ± 183.64 CointEq4 + 3.351 CointEq5
ϱϰ
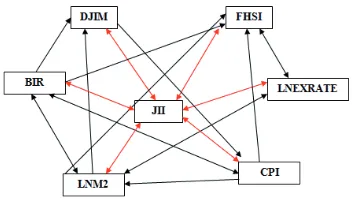
Indicator:
One way causal relationship two way causal relationship
Figure 4.1
Cause Direction on Short Term Granger Causal Relationship VECM
4.6.1 VECM Partial t-test Result
To observe the significant influence of the independent variables to the dependent variable individually, we conduct the partial t-test examination. The VECM estimation result describe these following partial t-test:
1. VECM Dow Jones Islamic Market Index (DJIM) Partial t-test Result
VECM estimation result defines that Dow Jones Islamic Market Index (DJIM) t-statistic is 0.957 in lag 1, 1.930 in lag 2, 0.404 in lag 3 and -0.707 in lag 4 with degree of freedom (df) 60-6-1 = 53
ϱϱ
Figure 4.6.1 Partial t-test of DJIM (2) to JII
2. VECM FTSE Bursa Malaysia Hijrah Shariah Index (FHSI) Partial t-test Result
VECM estimation result defines that FTSE Bursa Malaysia Hijrah Shariah Index (FHSI) t-statistic is -0.467 in lag 1, -2.068 in lag 2, -3.377 in lag 3 and -1.955 in lag 4 with degree of freedom (df)
60-6- LQFRQILGHQFHOHYHOĮ ,QDGGLWLRQW-table of
ttest is 1.671. Therefore, tstatistic of FHSI in lag 2 2.068, lag 3 -3.377 and lag 4 -1.955 > t-table 1.671 means that we reject Ho and accept Ha or the model is significant. It can be illustrated by the illustration below:
Figure 4.6.2 Partial t-test of FHSI (2) to JII
Ͳϭ͘ϲϳϭ ϭ͘ϲϳϭ
ZĞũĞĐƚĞĚ ZĞũĞĐƚĞĚ
ĐĐĞƉƚĞ Ě
ϭ͘ϵϯϬ
ͲϮ͘ϬϬϬ Ϯ͘ϬϬϬ
ZĞũĞĐƚĞĚ ZĞũĞĐƚĞĚ
ĐĐĞƉƚĞĚ
ϱϲ
Figure 4.6.3 Partial t-test of FHSI (3) to JII
Figure 4.6.4 Partial t-test of FHSI (4) to JII
3. VECM Exchange Rate (LNEXRATE) Partial t-test Result
VECM estimation result defines that Exchange Rate (LNEXRATE) t-statistic is 0.873 in lag 1, 0.709 in lag 2, -0.886 in lag 3 and -1.497 in lag 4 with degree of freedom (df) 60-6-1 = 53
LQFRQILGHQFHOHYHOĮ ,QDGGLWLRQW-table of t-test is 1.296. Therefore, statistic of LNEXRATE in lag 4 -1.497 > t-table 1.296 means that we reject Ho and accept Ha or the model is significant. It can be illustrated by the illustration below:
ͲϮ͘ϲϲϬ Ϯ͘ϲϲϬ
ZĞũĞĐƚĞĚ ZĞũĞĐƚĞĚ
ĐĐĞƉƚĞ
Ͳϯ͘ϯϳϳ
Ͳϭ͘ϲϳϭ ϭ͘ϲϳϭ
ZĞũĞĐƚĞĚ ZĞũĞĐƚĞĚ
ĐĐĞƉƚĞĚ
ϱϳ
Figure 4.6.5 Partial t-test of LNEXRATE (4) to JII
4. VECM Consumer Price Index (CPI) Partial t-test Result
VECM estimation result defines that Consumer Price Index (CPI) tstatistic is 0.810 in lag 1, 0.452 in lag 2, 0.571 in lag 3 and -1.565 in lag 4 with degree of freedom (df) 60-6-1 = 53 in 80%
FRQILGHQFHOHYHOĮ ,QDGGLWLRQW-table of t-test is 1.296. Therefore, t-statistic of CPI in lag 4 -1.565 > t-table 1.296 means that we reject Ho and accept Ha or the model is significant. It can be illustrated by the illustration below:
Figure 4.6.6 Partial t-test of CPI (4) to JII
5. VECM Money Supply (LNM2) Partial t-test Result
VECM estimation result defines that Money Supply (LNM2) t-statistic is 0.145 in lag 1, 0.461 in lag 2, 0.195 in lag 3 and 1.636 in lag 4 with degree of freedom (df) 60-6-1 = 53 in 80%
Ͳϭ͘Ϯϵϲ ϭ͘Ϯϵϲ
ZĞũĞĐƚĞĚ ZĞũĞĐƚĞĚ
ĐĐĞƉƚĞĚ
ϭ͘ϰϵϳ
Ͳϭ͘Ϯϵϲ ϭ͘Ϯϵϲ
ZĞũĞĐƚĞĚ ZĞũĞĐƚĞĚ
ĐĐĞƉƚĞĚ
ϱϴ
FRQILGHQFHOHYHOĮ ,QDGGLWLRQW-table of t-test is 1.296. Therefore, t-statistic of LNM2 in lag 4 1.636 > t-table 1.296 means that we reject Ho and accept Ha or the model is significant. It can be illustrated by the illustration below:
Figure 4.6.7 Partial t-test of LNM2 (4) to JII
6. VECM Bank Indonesia Interest Rate (BIR) Partial t-test Result VECM estimation result defines that Bank Indonesia Interest Rate (BIR) t-statistic is 1.177 in lag 1, -0.454 in lag 2, -0.130 in lag 3 and -1.598 in lag 4 with degree of freedom (df) 60-6-1 = 53 in 80% confidence level (Į ,Q DGGLWLRQ W-table of t-test is 1.296. Therefore, t-statistic of BIR in lag 4 -1.598 > t-table 1.296 means that we reject Ho and accept Ha or the model is significant. It can be illustrated by the illustration below:
Figure 4.6.8 Partial t-test of BIR (4) to JII
Ͳϭ͘Ϯϵϲ ϭ͘Ϯϵϲ
ZĞũĞĐƚĞĚ ZĞũĞĐƚĞĚ
ĐĐĞƉƚĞĚ
Ͳϭ͘ϱϵϴ
Ͳϭ͘Ϯϵϲ ϭ͘Ϯϵϲ
ZĞũĞĐƚĞĚ ZĞũĞĐƚĞĚ
ĐĐĞƉƚĞĚ
ϱϵ
4.6.2 VECM Simultaneous f-test Result
To observe the significant influence of the independent variables to the dependent variable simultaneously, we conduct the simultaneous f-test examination. The VECM estimation result describes that VECM f-statistic is 1.918 with degree of freedom (df) for N1 is 7-1 = 6 and df for N2 is 60-7
LQFRQILGHQFHOHYHOĮ ,QDGGLWLRQWKHI-table of f-test is 1.87. Therefore, VECM f-statistic is 1.918 > f-table 1.87 means that we reject Ho and accept Ha or the model is simultaneously significant. It can be illustrated in the illustration below:
Figure 4.6.9 VECM Simultaneous f-test of DJIM, FHSI, LNEXRATE, CPI, LNM2
and BIR
4.7 Variance Decomposition Test
The variance decomposition showed the further evidence of relationships among the variables in this research. It showed the proportion of the forecast error of one variable due to the other variables. The results from variance decomposition are reported in table 4.8.
Ͳϭ͘ϴϳ ϭ͘ϴϳ
ZĞũĞĐƚĞĚ ZĞũĞĐƚĞĚ
ĐĐĞƉƚĞĚ
ϲϬ
Table 4.7
VDC Result
Variance Decomposition of DJII:
Period S.E. DJII DDJI
M
DFHSI DLNEXR
ATE
DCPI DLNM2 DBIR
1 19.171 100 0.000 0.0000 0.0000 0.0000 0.0000 0.000
6 33.293 59.889 9.692 16.080 1.501 6.987 1.333 4.514
12 46.271 36.264 7.625 36.650 1.224 9.847 1.138 7.250
18 49.718 33.429 7.190 38.982 1.375 10.111 1.154 7.755
24 51.002 32.529 7.577 38.981 1.706 9.750 1.161 8.293
ϲϭ
4.8 Economic Analysis on VECM Estimation Results
The economic analysis on VECM estimation results of this research will be divided into three sections based on the market categories, such as:
a. Capital Market
According to the result of VECM (vector error correction model) estimation above, we can analyze that domestic macroeconomics variables and global variables have significant effect to Indonesia capital market in short term and long term. The domestic macroeconomics variables have different effect to the islamic capital market in Indonesia, such as money supply has positive effect to Jakarta Islamic Index. It means that the movement of money supply inline with the Islamic capital market in Indonesia. The basis of positive effect from money supply is the increasing of corporate profit that will increasing the money supply. So, in the further it will increase the cash flow and will give impact to the increasing of stock prices. The increasing of stock prices will increasing the capital market index. Meanwhile, exchange rate, CPI and BI rate have negative effect to Jakart Islamic Index. It means that the movement of these three variables in contrast to the movement of capital market in Indonesia. The effect of Bank Indonesia interest rate happens because the increasing of BI rate will make the investors withdraw their money in capital market and investing in bank deposit which has minimum risk than capital market.
ϲϮ
fluctuative. To reduce the fluctuation we should increasing the number of domestice investors to our capital market.
b. Money Market
Money market in Indonesia also got the impact from the movement of macroeconomics variables and capital market. Based on the result above (Figure 4.1), we can see that money supply has causal relationship with exchange rate, CPI, BI rate and JII. It means that the increasing of BI rate will cause the decreasing of money supply. It is in line with the instrument of monetary policy such as rediscount policy. Then, in LM curve, it is positive slope because in money market sector, if there is increasing in interest rate (R), so national income (Y) will also increasing and vice versa.
The consumer price index as an indicator of inflation also has positive correlation to the money supply. If the money supply increasing it will make the consumer price index increasing and it will lead to inflation. Jakarta Islamic Index (JII) as one of the best islamic index in Indonesia capital market has negative effect to Money Supply in Indonesia. It means that the increasing of JII will make the decreasing money supply. It happens because the the increasing of JII is caused by the increasing of stock price, the increasing of stock price will lead the investor to add more
Zϭ
ZϬ
ϲϯ
money to their stock investment that will make the money supply in society decreasing.
c. Foreign Exchange Market
Foreign exchange market in this research is between Indonesia Rupiah (IDR) and United Stated Dollar (USD). The exchange rate between US Dollar to Indonesian Rupiah was very fluctuative since the last quarter of 2013. Indonesian Rupiah deppreciate to US Dollar almost in Rp 13.000 per 1 USD. According to the VECM estimation result above, the exchange rate has negative effect to Jakarta Islamic Index. It means that the increasing of exchange rate will decreasing the Jakarta Islamic Index respectively.
The fluctuation of exchange rate is affected by domestic factors such as export, import, capital market and also foreign country factors. The increasing of import it will lead Indonesian rupiah depreciate to US Dollar and the increasing of export will lead Indonesian rupiah appreciate to US Dollar. The capital market is also give influence to the foreign exchange market. The foreign investor that invest their money in our capital market can make capital inflow or capital outflow whenever, it will lead the volatility of exchange rate. If the rupiah depreciate to US Dollar, the foreign investor will increasing the capital inflow to Indonesia capital market and vice versa.
ϲϰ
CHAPTER V
CONCLUSION
5.1 Key Findings
This study started with descriptive statistics examination. It followed with the Augmented Dickey Fuller ± Unit Root testing and continued with the Johansen Juselius ± Cointegration test. Then, it applied vector error correction model (VECM) to test the causality. In the end, we conduct Variance Decomposition Analysis. According to the analysis and explanation in the previous chapter, there are several key findings as follows:
1. Johansen Juselius Cointegration test defines the long term relationship among JII stock returns (JII), Dow Jones Islamic Market stock returns (DJIM), FTSE Bursa Malaysia Hijrah Shariah stock returns (FHSI), money supply (M2) and Bank Indonesia interest rate (BIR) are significant in 90% confidence
OHYHOĮ
ϲϱ
(BIR) are negative significant influence the Jakarta Islamic Index (JII) stock returns.
3. The Variance Decomposition analysis defines that DFHSI is the most capable variable in influencing JII stock returns rather than others variable. DFHSI able to explain 38.98% of JII stock returns in 24th month respectively.
5.2 Suggestion
Regarding to this research, there are several recommendations as an implementation from the research findings:
1. To the investors who want invest in Islamic capital market must be aware of the latest news, economic condition and phenomenon that occur in the market. It is also important to observe the global index and regional index. Beside that, investor must observe the domestic and global macroeconomics before take any decision in Islamic stock market investment.
2. Since there are different influence from Dow Jones Islamic Market Index and FTSE Bursa Malaysia Hijrah Shariah Index on Jakarta Islamic Index, this indicates different responses are taken by the economic policy that adopted by each country. Therefore, Indonesia policymakers must be cautious about responding the
FKDQJHVRIRWKHUFRXQWULHV¶HFRQRPLFSROLF\
ϲϲ
REFERENCES
Ang, R. (1997). Buku Pintar: Pasar Modal Indonesia, First Edition. Jakarta:
Mediasoft Indonesia.
Anthony Saunders, M. M. (2011). Financial Institutions Management: A Risk
Management Approach. Singapore: Mc Graw Hill.
Antonio, M. S., Hafidhoh, & Fauzi, H. (2013). The Islamic Capital Market
Volatility: A Comparative Study Between In Indonesia and Malaysia.
Bulletin of Monetary, Economics and Banking , 377-400.
Ariefianto, M. D. (2012). Ekonometrika, esensi dan aplikasi dengan menggunakan
EViews. Jakarta: Erlangga.
Bacha, O. I. (1999). Derivative Instruments and Islamic Finance. Some thoughts for
a reconsideration .
Badan Pengawas Pasar Modal. (2011). Laporan Tahunan. Jakarta: BAPEPAM-LK.
Bank Indonesia. (2013). Laporan Perekonomian Indonesia. Jakarta: Bank Indonesia.
Benakovic, D., & Posedel, P. (2010). Do macroeconomic factors matter for stock
returns? Evidence from estimating a multifactor model on the Croatian
Market. Business Systems Research Vol.1 No.1-2 , 1-50.
Bursa Efek Indonesia. (2013). Annual Report. Jakarta: BEI.
Dewan Syariah Nasional MUI. (2011). Fatwa DSN MUI NO: 80/DSN-MUI/III/2011.
Jakarta: Dewan Syariah Nasional MUI.
Dow Jones & Company. (2007). Dow Jones Islamic Market Indexes. New York:
Dow Jones.
Exchange, I. S. (2013). Annual Report Indonesian Stock Exchange 2013. Jakarta:
ϲϳ
F, C. N., Roll, R., & Ross. (1986). Economic Forces and The Stock Market. Journal
of Business 59(3) , 83-403.
Fama, E. F. (1981). Stock Returns, Real Activity, Inflation and Money. American
Economic Review, Vol.71 , 545-565.
FTSE. (2012). FTSE Factsheet. Kuala Lumpur: FTSE Bursa Malaysia Hijrah
Shariah.
Fuadi, D. W. (2009). Analisis Pengaruh Suku Bunga, Volume Perdagangan dan Kurs
Terhadap Return Saham Sektor Properti yang Listed di BEI 2003-2007. Tesis
Magister Manajemen, Pasca Sarjana Universitas Diponegoro .
Gitman, Smart, & Joehnk. (2011). Fundamentals of Investing. Boston: Pearson.
Granger, C. W. (1986). Developments in the Study of Cointegrated Economic
Variables. Oxford Bulletin of Economics and Statistics , Vol.48, 169-178.
Granger, C. W. (1988). Some Recent Development in the Concept of Causality.
Journal of Econometrics 16 , 199-211.
Hasanzadeh, A., & Kianvand, M. (2012). The Impact of Macroeconomic Variables
on Stock Price : The Case of Tehran Stock Exchange. Money and Economy,
Vol.06 No.02 , 171-190.
Hull, J. (2005). Options, Futures and others derivatives. Prentice Hall College Div.
Humpe, A., & Macmillan, P. (2007). Can Macroeconomic Variables Explain Long
Term Stock Market Movements? A Comparison of the US and Japan. CDMA
Working Paper No. 07/20 .
Husnan, S. (1998). Efisiensi Pasar Modal Indonesia. Jurnal Ekonomi Keuangan
Indonesia.
Hussin, M. Y., Muhammad, F., Abu, M. F., & Awang, S. A. (2012). Macroeconomic
Variables and Malaysian Islamic Stcok Market: A Time Series Analysis.