DOI: 10.12928/TELKOMNIKA.v14i1.2901 748
Improved Indoor Location Systems in a Controlled
Environments
Selcuk Helhel*1, Atalay Kocakusak2
Akdeniz University, Engineering Faculty, Department of E.E.E., 07058, Antalya, Turkey Telephone: +90 242 310 6393
*Corresponding author, e-mail: selcukhelhel@akdeniz.edu.tr1, atalayakocakusak@gmail.com2
Abstract
The precise localization by using Wi-Fi Access Point (AP) has become a very important issue for indoor location based services such as marketing, patient follow up and so on. Present AP localization systems are working on specially designed Wi-Fi units, and their algorithms using radio signal strength (RSS) exhibit (relatively) high errors, so industry looks more precise and fast adaptable methods. A new model considering/eliminating strong RSS levels in addition to close distance error elimination algorithm (CDEEA) combined with median filters has been proposed in order to increase the performance of conventional RSS based location systems. Collecting local signal strengths by means of an ordinary WiFi units present on any laptop as a receiver is followed by the application of CDEEA to eliminate strong RSS levels. Median filter is then applied to those eliminated values, and AP based path loss model is generated, adaptivelly. Finally, the proposed algorithm predicts locations within a maximum mean error of 2.96m for 90% precision level. This achievement with an ordinary wifi units present on any commercial laptop is comparably at very good level in literature.
Keywords: Indoor radio propagation, locating algorithms, laptop as a receiver, signal analysis, WiFi
Copyright © 2016 Universitas Ahmad Dahlan. All rights reserved.
1. Introduction
Locating is an essential technology which finds lots of industrial applications such as marketing, rehabilitation campuses, military and security applications, and so on [1-5]. Instead locating technologies and its applications are either time based or radio signal strength (RSSI) based systems, most of the technologies prefer RSSI based systems. GPS and cellular based systems have very satisfied location precision capability at outdoor, but they have almost no capability (GPS) or limited capability (cellular) to cover for indoor positioning. It should be noted that cellular technologies are also operator dependent, not flexible, and not applicable to indoor locating. In order to increase the performance of indoor positioning services, most indoor locating systems use multilateration on fingerprinting positioning methods [2]. Fixing a location requires some reference frames to describe positions relative to those pre-determined references, and frames are commonly called as coordinate systems in which any location is specified with respect to its origin. Indoor locating technologies are rapidly growing as a result of an increase in popularity of mobile equipment. This popularity requires that development of a proper propagation model and locating algorithms are essentials for uninterrupted and/or precise locating systems in an indoor environment. Requirement to use of a proper model forces scientists to investigate propagation mechanisms [1-7]. There is also tremendous increase in Wi-Fi localization system applications in an autonomously navigating robot project [3, 4]. Such models, basically, use Wi-Fi signature map with geometric constraints and introduce a continuous perceptual model of the environment generated from the discrete graph-based Wi-Fi signal strength sampling. Continuous localization techniques referring to known reference points are slightly different than the certain location identification at any time.
systems, and noticed that their proposed model is cost effective. Active-localization systems are based on Wi-Fi AP, GSM, CDMA and smart phone applications allowing broad band two-way data communications. The industrial Scientific Medical (ISM) 2.4 GHz narrowband indoor channel is also used in many contemporary medical applications, such as wireless physiological sensor networks [7]. Another study presents a visual localization approach that is suitable for domestic and industrial environments as it enables accurate, reliable and robust pose estimation. They used innovative artificial landmarks (clusters of high intensity RGB LEDs) on the ceiling which create cancellation [7].
There are studies [8-10] using Wi-Fi based systems for indoor locating. Campos, et al., [8] presented a system for multi-floor indoor positioning which considers architectural aspects. They proposed a Data Correlation Method combined with neural network applications on them. They compared measured Radio Signal Strength (RSS) levels by applying natural data clustering and data correlation methods. RSS based techniques do not require any synchronization like Time of Arrival (TOA) and Time Difference of Arrival (TDOA) methods [11, 12]. Mani, et al., [13] proposed a study that parameterizes a polarimetric diffuse scattering model in an indoor environment, since diffuse or dense multipath components play an important role in determining the polarization behavior of wireless transmission channels. Their analysis reveals that diffuse scattering significantly depolarizes the impinging wave in indoor scenarios. Their method briefly tells that MIMO applications will be more beneficial for better indoor localization, since 3D electromagnetic field in the air will bring extra gain and extra advantage to designers [14-15].
In this study; a median filter was applied to RSSI values collected by wifi units present on any commercial laptop, -55dBm level was preset as the threshold value (named as close distance border or equally close distance error elimination process) in the algorithm, and a correction function
ext has been added to well known path loss model in Section 3.2. Proposed model considering scanned RSSI level in addition to well known n-index based path loss formula is a new comment to literature.2. Materials and Methods
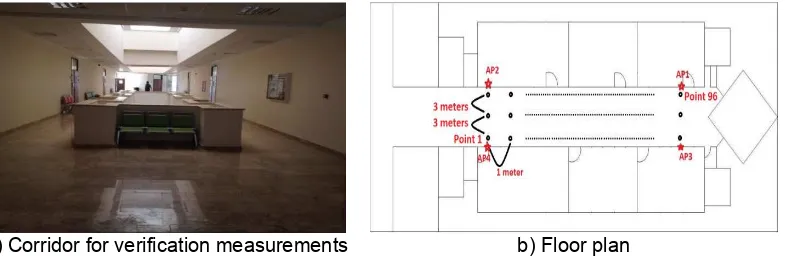
Wi-Fi transmitters, holding omnidirectional antennas, operating between 2200 MHz and 2600 MHz were used as a part of measurement setup. The antenna had an output power of 21 dBm. A wifi unit present on any ordinary commercial laptop was used as a radio receiver with our own software. Safe (clear) IP dependent frequencies were selected not to be interrepted by additional communication traffic in the system. Additional traffic may affect the propagation mechanisms. Transmitting antennas were placed just below the roof that they are about 2.4m above the ground and 30cm below the roof. The accuracy of RF receiver was assumed as 1 (dBm), it is the average received signal power that, in total, ~100 samples were taken within a cycle. Kim, et al., [16] proposed a study to measure small-scale fading and noted that 0.125 cm measurement interval at 2.4 GHz is enough. Since the used receiver speed in this study is much faster than Kim’s study; sampling interval is greater than 0.125 cm, and 100 samples were taken in one calculation cycle in order to remove small scale affects.
a) Corridor for verification measurements b) Floor plan
Three sets of measurements had been conducted in total; By using first set’s data, standard path loss measurements (when there is no obstruction between transmitter and receiver) had been conducted in two different corridors of an engineering faculty as seen in Figure 1 for slope calculation, and the rest one was used for model verification and for determining
ext value as mentioned in Section 2.1. Shadowing factor
ext is normally a random variable depending on an environment, but calculated one also guarantees/covers that random variable.3. Indoor Propagation and Locating Algorithms 3.1. Slope of Enviroment
Instead, there are varying indoor propagation models valid in the literature [17, 18], very common model used for indoor path loss calculation using Radio Signal Strength (RSS) is given in Equation (1) [4].
ext
d d n
d P d
P
0 0 10 log
(1)
Where P(d)is the signal strength obtained by the receiver at a distance of d andP(d0)is the received signal strength at 1m distance (means reference signal) both in dBm, n is the path loss index for indoors, and
ext is normally the random variable describing shadowing factor [9, 10]. Four different Wi-Fi transmitters were located around the corner of measurement campaign presented in Section 3.2. Corridors used as a measurement campaign is 7.2m wide and 50m length. Since n value is a value which strictly depends on interested campaign’s dimensions and structures, measurements were conducted in order to calculate IP dependent n values. In logarithmic form of path loss, n (slope of path loss) can be approximated by Equation (2). Experimental studies show us that this equation itself has not enough capability to obtain precise location informations. As it will be detailed in further sections; this equation need to be improved by considering additional parameters or additional conditions.
0
10 /
log
10 d d
n (2)
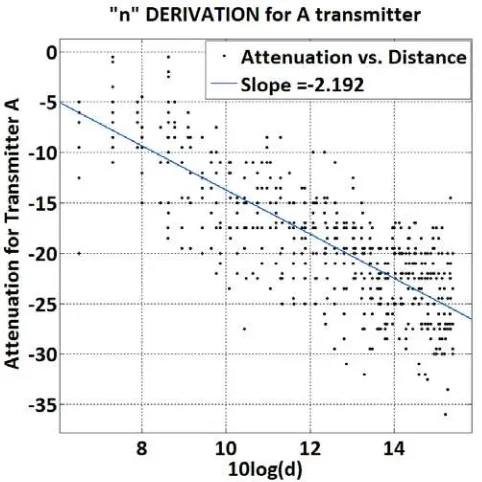
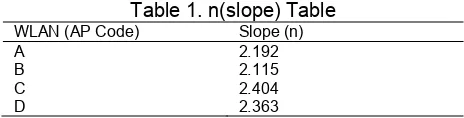
Figure 2 shows path loss attenuation versus distance in 10*log for AP-A as an example. Similar path loss distributions were obtained for other three APs. Path loss measurement points are aligned by 60cm apart from each other that 120 different locations were determined in order to calculate the slope n presented at Table 1. A dataset stores those path loss index “n” values for future usage. Table 1 gives IP dependent calculated n values that they are they are slightly different then from each other.
Table 1. n(slope) Table WLAN (AP Code) Slope (n)
A 2.192 B 2.115 C 2.404 D 2.363
After obtaining “n”, one needs to determine/describe shadowing factor parameter
ext. Instead we might have determined this value from the literature referring to the similar measurement campaign, we preferred to generate it. The value of this parameter was generated from control data (more than 2,000 data distributed at 576 different locations) as 8.62 by using k-means clustering error calculation [19]. It has to be noted that there were four different
extparameters values related to each AP, and they are very close to each other. Final value was obtained by median filter application. Obtained value can compensate shadowing affects which normally has to be determined randomly.3.2. Derivation of New Empiric Model for Indoor Environment
Although the aforementioned path loss model is a good starting point for path loss estimation, such a simple model for the path loss only exists in special cases. It was observed that the calculation of path loss using Equation (2) results in some deviation, and this small deviation in calculated distance (to be used in multilateral location calculation) brings very big unexpected error in relative coordinates. By the way, one needs to take into account/consider additional correction parameters to improve Equation (2). Experimentally observed that a distance calculated by using strong signal levels (RSSI >-55dBm) have big relative coordinate errors. This is mostly because of transmitting antenna near field affects. This observation is the starting point that those strong signals need to be eliminated from reference distance calculation list which is named as close distance error elimination approach (CDEEA). In a similar way but not the same level; weak RSS signals scanned at long distances fail to predict a relative distance as expected. Coordinates/positions were calculated based on Equation (2), and we observed deviated coordinates. Figure 3 demonstrates initial coordinate deviation distribution function with respect to RSSI, and we describe a function named as initial coordinate deviation distribution function as
(m) in terms of power (P) in dBm. The term initial in the text refer to starting values which is going to be corrected by some application furher in this text.923
.
818
636
.
39
63617
.
0
0033741
.
0
3
2
P
P
P
(3)RSS levels referring those critical two points (one for close distance and one for weak signal) can be estimated by taking the derivative of initial deviation distribution function
and equating it to zero as in Equation (4). Zeros of this equation gives a RSS level of about -55dBm as close distance error elimination limit (border) and -70dBm as weak RSSI limit (border).0
P
(4)
Observing initial coordinate deviations in Figure 3, and by using results of Equation (4) forces us to obtain a correction function
ext (or equivalently region based) considering RSSwith Equation (2), and a final path loss distance in terms of power in dBm and distance in meter can be described as in Equation (6).
Figure 3. Distribution function
colored by blue
dBm P P P P dBm P dBm P ext 70 , 7842 9 . 319 36 . 4 0198 . 0 55 70 , 065 . 2 057 . 0 2 3 (5) dBm P dBm P used be to allowed Not d ext N d P d P final ext 55 10 55 ) ( ) ( 0 (6)
Figure 4 shows location distributions in comparison with real geometric locations. Red circled values are belonging to approach considering both close distance error elimination limit (border) and weak RSSI limit (border). Blue circled values are belonging classic path loss calculations.
Figure 4. Deviation from Real Geometric Location -85 -80 -75 -70 -65 -60 -55 -50 -20 -15 -10 -5 0 5 10 15
RSS Levels in dBm
In it ia l D e v ia tio n ( m ) Test 1 Test 2 Test 3 Test 4 Estimation
-10 -5 0 5 10
-10 -5 0 5 10
Deviation in x Direction (m)
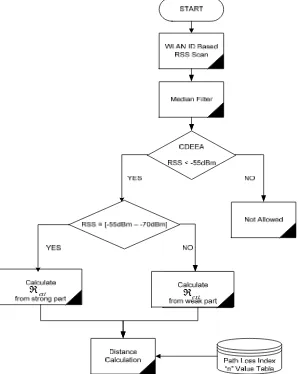
Figure 5 demonstrates the flowchart for distance calculation between target and a certain transmitter Tx. Systems scan RSS levels based on WLAN ID followed by an application of median filter on them. Median filtered data are feeding close distance error elimination approach (CDEEA) unit for making decision. This first decision determines either scanned WLAN ID based RSS signal will be included into location calculation or not. If not, that scanned RSS value is ignored from the location calculation for that location. Otherwise it is recorded for further calculations. Depending on the results obtained from Equation (4), two different correction functions are generated. With generated correction functions and previously stored building based path index n, system makes distance calculation.
ext
ext
Figure 5. Flowchart for distance calculation for a certain Tx
4. Results
To evaluate the model performance, it is compared with other proposed models. As proposed in [17-23], performance is quantified by using root mean square (RMS) error, defined by Equation (7).
n E E
n
i i
rms
1
2
Where
E
iis the difference between estimated and measurement value at ith point of measurement in dBm and n is the number of measurement points. By using IP dependent path loss equations with close distance error elimination algorithm (CDEEA), mobile equipment location was calculated. Calculated locations in x and y directions are compared with real geometric location in data base. It is observed that, while mean error without proposed algorithm is 3.34 (m) difference in total combined distance, it slightly decreased to 2.96 (m), as shown in Table 2(a). Table 2(b) indicates longitudinal mean error in (m) and transverse mean error in (m) throughout the corridor. These are comparably at very good levels comparing with the literature.
Table 2(a). Mean Error Table
Approach Mean Error
Median Filter itself 3.34(m) Median Filter with CDEEA 3.24 (m)
Proposed Model with
ext 2.96 (m)Table 2(b). Mean error in both axes
Expression Longitudinal mean error in (m) Transverse mean error in (m)
Convetional Path Loss 2.17 1.93
Proposed Model 2.20 1.83
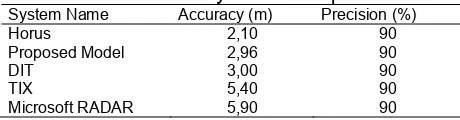
Table 3 is comparison table that shows porposed model in comparison with the results in the literature. For 90% precision level, proposed model accuracy is the second best achievement.
Table 3. Wi-Fi Based Systems’ Comparison Table System Name Accuracy (m) Precision (%)
Horus 2,10 90
Proposed Model 2,96 90
DIT 3,00 90
TIX 5,40 90
Microsoft RADAR 5,90 90
5. Conclusion
Rapid development of location systems has made indoor locating systems are quite popular and widespread such that they find lots of commercial applications. Proposed study uses wifi units of any ordinary commercial laptop as a receviver combined with close distance error elimination approach that the second best locating performance (location error is less then 3m in total) has been achieved for 90% precision level in the literature.
A model considering RSS level and close distance error elimination algorithm combined with median filters increases the performance of conventional RSS based location systems by amount of 12%. Minimum Transverse mean-error has been obtained as 1.83(m). Although proposed model gives a good performance within the scope of this study, it needs to be improved. Future work will focus on walking lives affecting indoor propagation model as well as indoor locating algorithms and close antenna wall effects on propagation model, and we are trying to combine both WiFi based systems with ultrasonic locating systems named Hybrid Indoor Locating Systems (HiLOS) [22].
It is quite clear that usage of professional well designed WiFi receivers will allow us to determine more precise results. Since our starting point was based on the usage of ordinary wifi units on any laptop, we did not try them. Those well designed and accessible WiFi units will be used with HiLOS studies.
Acknowledgements
This study is supported by Akdeniz University, Scientific Research Projects Supporting Unit (BAPYB) and granted by TÜBİTAK 2209-A (PN: 1919B011303278). Measurement facilities are belong to EMUMAM Near Field Antenna Laboratory granted by State Planning Organization (2007K120530-DPT).
References
[1] Md Syedul Amin, Mamun Bin Ibne Reaz, Salwa Sheikh Nasir. Integrated Vehicle Accident Detection and Location System. TELKOMNIKA Telecommunication Computing Electronics and Control. 2014; 12(1): 73-78.
[2] Miwa S Tagashira, H Matsuda, T Sutsui, Y Arakawa, A Fukuda. A Multileration Based Localization Scheme for Adhoc Wireless Positioning Networks Used in Information oriented Construction.
Proceedings of IEEE27th Internetional Conferenece on Advanced Information Networking and Applications (AINA). 2013: 690-695.
[3] M Ocaña, LM Bergasa, MA Sotelo, J Nuevo, R Flores. IEEE ISIE 2005. Dubrovnik, Croatia. 2005: 1545-1550.
[4] I Cox. Blanche-an experiment in guidance and navigation of an autonomous robot vehicle. IEEE Transactions on Robotics and Automation. 1991; 7(2): 193-204.
[5] Farhan Manzoor, Yi Huang, Karsten Menzel. Passive RFID-Based Indoor Positioning System, An Algorithmic Approach. Program for the IEEE International Conference on RFID-Technology and Applications. Guangzhou, China. 2010.
[6] Busra Ozdenizci, Vedat Coskun, Kerem Ok. NFC Internal: An Indoor Navigation System. Sensors.
2015; 15: 2571-2595.
[7] Sławomir Hausman, Łukasz Januszkiewicz. Impact of Indoor Environment on Path Loss in Body Area Networks. Sensors. 2014; 14: 19551-19560.
[8] Andry Maykol G Pinto, A Paulo Moreira, Paulo G Costa. Indoor Localization System based on Artificial Landmarks and Monocular Vision. TELKOMNIKA Telecommunication Computing Electronics and Control. 2012; 10(4): 609-620.
[9] RS Campos, L Lovisolo, M Luiz R de Campos. Wi-Fi multi-floor indoor positioning considering architectural aspects and controlled computational complexity. Expert Systems with Applications.
2014; 41: 6211–6223.
[10] Helhel S, Kocakuşak A, Yol Kaybı. İndeks Hesabı Ve Wifi Tabanlı Kontrolsüz Gezginlerden Arındırılmış Bina İçi Konum Tespit Sistemi. VII URSI-Türkiye Bilimsel Kongresi. KAYSERİ, TÜRKIYE. 2014; 1(1): 1-4.
[11] Helhel S, Kocakuşak A. Algorithms For Indoor Localization On Wlan Networks Applications. PIERS Guangzau, China. 2014; 1(1): 1-2.
[12] AA Wahab, A Khattab, YA Fahmy. Two-Way TOA with Limited Dead Reckoning for GPS-Free Vehicle Localization Using Single RSU. Proceedings of the International Conference on ITS Telecommunications. 2013: 244-249.
[13] S Uebayashi, M Shimizu, T Fujiwara. A Study of TDOA Positioning Using UWB Reflected Waves.
Proceedings of the 78th IEEE Vehicular Technology Conference. 2013: 1-5.
[14] Parameterization of a Polarimetric Diffuse Scattering Model in Indoor Environments. IEEE Transactions On Antennas And Propagation. 2014; 62(8): 4361-4364.
[15] Selçuk Helhel, Huseyin Goksu, Sukru Ozen. Investigation of 3D electromagnetic field distribution for dynamic polarization diversity. IEEE Antennas and Wireless Propagation Letters. 2008; 7: 171-174. [16] Selcuk Helhel, Sukru Ozen, I Bahadir Basyigit, Osman Kurnaz, Yunus E Yoruk, Murat Bitirgan,
Zeynep Colak. Radiated susceptibility of medical equipment in health care units: 2G and 3G mobile phones as an interferer. Microwave and Optical Technology Letters. 2011; 11(53): 2657-2661. [17] Kim D, Ingram MA, Smith WW. Measurements of Small-Scale Fading and Path Loss for Long Range
RF Tags. IEEE Transactions On Antennas And Propagation. 2003; 51(8): 1740-1749.
[18] Yongxiang Zhao, Meifang Li, Feng Shi. Indoor Radio Propagation Model Based on Dominant Path.
Int. J. Communications, Network and System Sciences. 2010; 3: 330-337.
[19] Çelik S, Kurnaz O, Albayrak Y, Bitirgan M, Basyigit IB, Helhel S. An Indoor To Outdoor Propagatıon Model At Gsm900 Gsm1800 And Cdma2100. International Journal Of Engineering & Applied Sciences (IJEAS). 2013; 5(2): 9-17.
[20] Lin Ma, Yubin Xu. Received Signal Strength Recovery in Green WLAN Indoor Positioning System Using Singular Value Thresholding. Sensors. 2015; 15: 1292-1311.
[21] YS Lin. Taichung, RC Chen, YC Lin. An indoor location identification system based on neural network and genetic algorithm. 3rd International Conf.on Awareness Science and Techn., (iCAST). 2011: 27-30.
[23] Selcuk Helhel, Atalay kocakusak, Yalcın Albayrak, Sukru Ozen. WLAN Based Indoor Locating Systems Enhanced by Ultrasonic Sensors. Hybrid Indoor Locater Systems (HILoS), Progress in Electromagnetic Research Symposium PIERS. Prag. 2015.