Greenhouse Gas Emissions From Makassar City
Municipal Waste Sector
Irwan Ridwan Rahim
*, Achmad Zubair
**
Environmental Engineering, Department of Civil Engineering, Engineering Faculty Hasanuddin University, Makassar, Sulawesi Selatan, Indonesia
Abstract — Makassar city produced 0.38 Mt/year of Municipal Solid Waste (MSW) with population number of 1.398 million and waste generation rate 0.74 kg/cap/day. Almost 89% MSW are transported to Tamangapa Landfill as the only landfill in use recently without treatment, although Tamangapa landfill designed as a sanitary landfills in operation still open dumping and unmanaged will become a source of the GHGs emission, mainly the methane emission. This study have developed 3 (three) scenarios of existing conditions (BAU), scenarios were: 1st
scenarios called Communal Waste Processing (CWP), this scenario is intended to reduce the volume of waste to be dumped to landfills, 2nd scenarios called Integrated Waste Processing Center (IWPC), developed an integrated waste processing (both organic and inorganic) facility on ward (kecamatan) level and 3rd scenarios called Development Landfill System (DLS), this scenario is actually similar to BAU condition, assumed the on-site landfills (Tamangapa) previously just controlled type developed to a sanitary type that has a mechanical and biological treatment facilities and methane gas processing facilities. Using SWM-GHG Calculator was developed by IFEU Institute that follows the Life Cycle Assessment (LCA) method. The best scenarios regarding mitigation costs were SCR1 (US$ 5.3/ tCO2-eq) followed by SCR2 and SCR3, because total comparison between the costs incurred by results of reduction of GHG emissions on BAU conditions.
Key words – Greenhouse Gas Emissions,Waste,Mitigation cost.
I. INTRODUCTION
Climate change is considered one of the greatest global challenges of the 21st century. A general consensus exists among the vast majority of climate experts that global warming is the result of rising concentrations of greenhouse gases in the Earth's atmosphere. Since industrialisation began, human activities have intensified the natural greenhouse effect, which is caused largely by water vapour, carbon dioxide, methane and ozone in the atmosphere, through anthropogenic emissions of greenhouse gases, resulting in global warming [1].
The waste management sector contributes to the greenhouse effect primarily through emissions of carbon dioxide (CO2), methane (CH4) and nitrous oxide (N2O). The IPCC's Fourth Assessment Report puts the contribution made by the solid waste and wastewater management sector to global greenhouse gas emissions at 2.7%, which might at first sight appear to be comparatively low. But in fact, waste management can contribute indirectly to significantly larger GHG emissions reductions.
The 2.7% of global GHG emissions assumed for the waste sector by IPCC do not fully reflect the actual potential for reducing GHG emissions by the waste management sector. The IPCC calculations take into account only end-of-pipe solid waste management strategies, such as:
• Landfill/waste dumping • Composting
• Waste incineration (in case the generated heat energy is not utilised)
• Sewage disposal
In this way, potential emissions reductions in the waste sector are assumed to exist predominantly in avoiding methane production from landfills. The positive impacts of reducing, re-using or recycling waste, as well as waste-to-energy solutions on climate protection are either attributed to other source categories – in particular to the energy sector and to industrial processes – or they are not accounted for at all in the GHG inventories reported to the United Nations Framework Convention on Climate Change (UNFCCC) under the Kyoto Protocol.
Experts of integrated waste management approaches, on the contrary, see significant potentials for GHG emissions reductions in waste management through several strategies: x Methane reduction: Collection and flaring of landfill gas can already cut the emissions in half because it leads to CO2 emissions instead of methane emissions. Even more, waste incineration or composting have significantly less global warming potential than landfilling.
The emission savings resulting from recycling processes vary significantly according to the material recycled. When for example waste paper is recycled and not disposed on a landfill, this results not only in reducing the emissions that would have occurred by the material degradation on the landfill, but also in reducing the emissions caused by cutting trees as well as the energy and emissions from processing wood for paper production and part of the energy used for processing cellulose.
II. METHODS
A. Study area
The research is situated in the Makassar city, Makassar is the provincial capital of South Sulawesi, Indonesia. It is the largest city on Sulawesi Island in terms of population number and fifth largest city after Jakarta, Surabaya, Bandung and Medan over the indonesian archipelago. The port city is located on the southwest coast of the island of Sulawesi, facing the Makassar Strait.
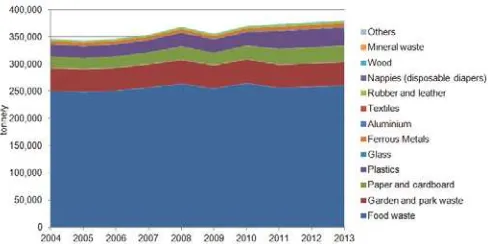
The city's area is 175.77 square kilometres (67.87 sq mi) and it had a population of around 1,398,995 million as of the 2013 Census. About 85% of Makassar City population receives waste collection service, which yielded 380,043 tonnes (0.74 kg/capita/day) in 2013, 89% of which were disposed of in the Tamangapa controlled landfill on 20km eastern part of Makassar, as one of the metropolitan cities in Indonesia, waste characteristics was dominated by organic waste that source from food scraps and results of sweeping leaves in the park and the road, it can be show in fig.1.
High composition of organic waste is causing the potential high rate of greenhouse gas (GHG) emissions from un-treatment municipal waste prior dumped to landfill, although the trend started organic content decreased with increased prosperity but Tamangapa landfill to be the only landfill in the city of Makassar not managed properly, it can be seen from the non-functioning of leachate and gas processing facilities
Fig. 1Waste composition in percentage of wet weight
Fig 2 Trend of waste generated in Makassar city during 2004-2013
B. Scenario Developed
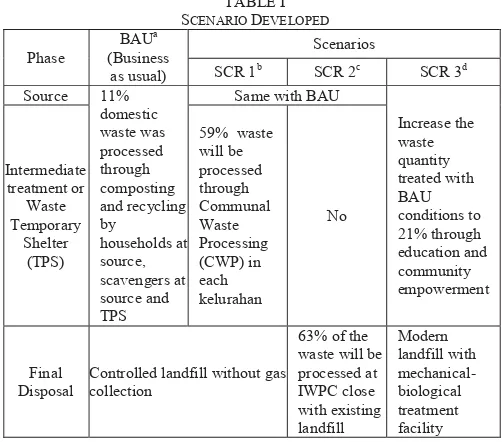
This study have developed 3 (three) scenarios of existing conditions (BAU), scenarios are:
1st Scenario called Communal Waste Processing (CWP), this scenario is intended to reduce the volume of waste to be dumped to landfills. This scenario works with developing waste processing facilities of organic and inorganic waste, temporary collection bins (TPS) replaced with the facilities which manage organic waste into compost and recycled non-organic waste so it can be sold or reused, with this scenario 225,241 t/y waste can be processed and then 154,842 t/y dumped into TPA Tamangapa (Controlled landfill without gas collection). This facility is planned to initial cost IDR 429,130,000 (US$ 35,183), annual operating costs IDR 200,665,000 (US$ 16,452) and be able to process household garbage kelurahan scale as much as 135 tons per month (assuming one kelurahan = 250 households) [3].
2nd Scenario called Integrated Waste Processing Center (IWPC), developed an integrated waste processing (both organic and non-organic) facility on ward/kecamatan level. This scenario is aimed at reducing waste dumped into landfills, by composting and waste recycling as in the first scenario, but with higher treatment effectiveness, facility will built several unit close to current landfill, so that the residual waste that has been processed can be directly discharged into landfill, this facilities which manage organic waste into compost and recycled non-organic waste so it can be sold or reused, with this scenario 240,349 t/y waste can be processed and then 139,733 t/y dumped into TPA Tamangapa (Controlled landfill without gas collection). This facility is planned to initial cost IDR 5,364,125,000 (US$ 439,790), annual operating costs IDR 2,508,312,500 (US$ 205,649) and be able to process garbage distric/kecamatan scale as much as 1,350 tons per month.
3
rdScenario called Development Landfill
educational and community involvement programs
in managing waste is assumed waste that can be
processed at source increased became 21%
TABLE I SCENARIO DEVELOPED
Phase
Controlled landfill without gas collection
aMakassar city Sanitation Department b,c,dCalculation result
C. Calculations
In this research calculation method used the SWM-GHG Calculator that follows the Life Cycle Assessment (LCA) method. The SWM-GHG Calculator was developed by IFEU Institute, sponsored by KfW Development Bank (German Financial Development Cooperation) incooperation with GTZ (German Technical Development Cooperation) and German Federal Ministry for Economic Cooperation and Development. Different waste management scenarios (SCR1, SCR2 and SCR3) compared by calculating the GHG emissions of the different recycled (typically glass, paper and cardboard, plastics, metals, organic waste) and disposed of waste fractions over their whole life cycle – from "cradle to grave", in a manner of speaking. The tool sums up the emissions of all residual waste or recycling streams respectively and calculates the total GHG emissions of all process stages in CO2 equivalents. The emissions calculated also include all future emissions caused by a given quantity of treated waste. This means that when waste is sent to landfill, for example, the calculated GHG emissions, given in tonne CO2 equivalents per tonne waste, include the cumulated emissions this waste amount will. generate during its degradation. This method corresponds to the "Tier 1" approach described in IPCC (1996, 2006).
Based on literature study that related with this research and data analysis that already obtained from previous research [4] and [5], then assemble the table input data that would be used in performing calculations using SWM-GHG calculator, the data seen on table II.
TABLE II INPUT DATA USED
Item BAU SCR 1 SCR 2 SCR 3
Total waste amount (t/yr) 380.083a
Annual waste quantity/cap
(kg/cap/yr) 272a
Total population (capita) 1.398.995a
Classification of waste
water content High
Dry material recycled
- Paper/Cardboard (%) 10a 60b 80b 20c
Organic waste composting
- Food (%) 10a 60d 60d 20c
- Garden/Park (%) 10a 60d 60d 20c
Type of final disposal CLe CLe CLe MBTLf
Average Cost (US$/t)
- Landfill 4,8g 4,8g 4,8g 36,8h
- Recycling of dry waste 1,2 7,4 11,1 1,5
- Composting 10,3 14,8 18,5 12,1
Specific GHG emission factor for generation of electricity (g CO2
-eq/kwh)
800i
aCentral Board of Statistic of Makassar, “Makassar in figures 2010,” b[6] SCR1 = Standard practice recovery, SCR2 = Good practice cAssumed with educational and community involvement programs that
will improve the effectiveness of on average 10% of the BAU condition.
d[3] Up to 60% of the organic waste can be processed into compost eCL = Controlled landfill without gas collection
fMBTL = Sanitary landfill with mechanical-biological-gas treatment
facility
g[4] Management cost per ton waste in Tamangapa Landill (2010) h[8] Management cost per ton waste in Sanitary Landill (2014)
i[7] Specific GHG emission factor for generation of electricity for
Makassar city
II. RESULT
A. Waste treated
Based on calculations results show in table III that highest treated activity (composting and recycling efforts) were SCR2 (240,349 tonnes/year) followed by SCR1, SCR3 and last is BAU condition.
Total waste 380,083
Total Recycled
B. GHG emissions recycling and disposal
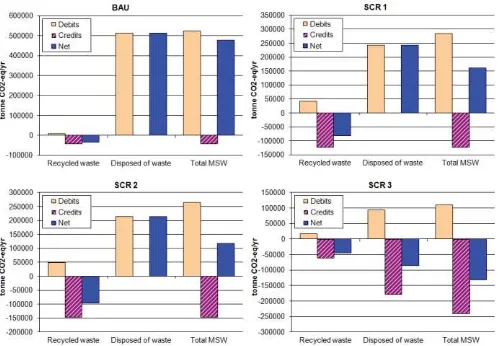
Based on calculations results show in fig.2 that highest credits (avoided GHG emissions) were SCR3 (130,993 CO2 -eq/year) followed by SCR2, SCR1 and last is BAU condition. Although credits earned from recycling were still smaller than the other two scenarios (SCR1 and SCR2) high credit obtained by SCR3 for mechanical and biological facilities and processing of methane gas serves to reduce greenhouse gas emissions in landfills.
Fig. 3 Greenhouse Gas (GHG) emissions from recycling and disposal
C. Scenarios cost analysis
Based on calculations results show in table IV that most expensive scenarios were SCR3 (US$ 11,810,945/year) followed by SCR2, SCR1 and cheapest were BAU condition. Although annual cost from recycled dry waste and composted organic waste were still smaller than the other two scenarios (SCR1 and SCR2) high cost obtained by SCR3 for unit costs landfill that equipped by mechanical and biological facilities and processing of methane gas serves to reduce greenhouse gas emissions in landfills reaching US$ 36.8/t waste dumped compare to controlled landfill without gas collection US$ 4.8/t only.
TABLE IV
RESULTS ABSOLUTE COSTS FOR THE CALCULATED SCENARIO
Item US$/year
BAU SCR 1 SCR 2 SCR 3
Recycled dry waste
17,097 369,224 721,085 26,807
Composted organic waste
359,182 2,586.109 3,232,637 718,364
Residual waste to landfilla
1,657,949 761,823 687,490 11,065,774
Total 2,034,228 3,717,156 4,641,211 11,810,945
aBAU,SCR1 and SCR2 = Controlled landfill without gas collection,
SCR3 = Sanitary landfill, with mechanical-biological treatment and gas treatment by flare.
D. Mitigation cost
Based on calculations results show in table V that best scenarios regarding mitigation costs were SCR1 (US$ 5.3/
tCO2-eq) followed by SCR2 and SCR3. Although highest
reduced GHG reach by SCR3 but total comparison between the costs incurred by results of reduction of GHG emissions on BAU conditions obtained the lowest cost is SCR1.
TABLE V
MITIGATION COSTS PER TONNE OF GHG EMISSIONS FOR THE CALCULATED SCENARIO COMPARED TO BAU
BAU SCR 1 SCR 2 SCR 3
Total GHGa 478,459 160,400 117,506 -130,993
Total costsb 2,034,228 3,717,156 4,641,211 11,810,945
Different GHGc
0 -318,059 -360,953 -609,452
Different costsd
0 1,682,928 2,606,983 9,776,717
Mitigation
costsd - 5.3 7.2 16.0
aTotal GHG emissions in t CO2-eq/yr bTotal costs in US$/yr
cDiffrent GHG emissions in t CO2-eq/yr compare to BAU dDiffrent costs in US$/yr compare to BAU
eMitigation costs in US$/ t CO2-eq
III. CONCLUSIONS
1. Highest treated activity (composting and recycling efforts) were SCR2 (240,349 tonnes/year) followed by SCR1, SCR3 and last is BAU condition.
2. Highest credits (avoided GHG emissions) were SCR3 (130,993 CO2-eq/year) followed by SCR2, SCR1 and last is BAU condition, mechanical and biological facilities and processing of methane gas serves to reduce greenhouse gas emissions in landfills.
3. The most expensive scenarios were SCR3 (US$ 11,810,945/year) followed by SCR2, SCR1 and cheapest were BAU condition, because unit costs landfill that equipped by mechanical and biological facilities and processing of methane gas serves to reduce greenhouse gas emissions in landfills reaching US$ 36.8/t waste dumped.
4. The best scenarios regarding mitigation costs were SCR1 (US$ 5.3/ tCO2-eq) followed by SCR2 and SCR3, because total comparison between the costs incurred by results of reduction of GHG emissions on BAU conditions.
REFERENCES
[1] Spies, et al, “SWM GHG Calculator – a Tool for Calculating Greenhouse Gases in Solid Waste Management, Gesellschaft für Technische Zusammenarbeit (GTZ), 2010.
[2] Central Board of Statistic of Makassar, “Makassar in figures 2010,”
unpublished
[3] Kastaman, et al, “Rancangan Pengembangan Sistem Pengelolaan Reaktor
[4] I.R.Rahim,Nakayama and Shimaoka, “Cost Analysis of Municipal Solid Waste Management in Major Indonesian Cities”, Journal of Japan Society of Civil Engineering, Ser. G(Environmental Research),Vol.Vol. 68,No.No.6,pp.II-79-89,2012.10
[5] Rahim, Shimaoka, Nakayama, “Development of life cycle replacement cost methods to estimate the environmental cost of Municipal Solid Waste management in developing countries”, Proc. of the 12th Expert Meeting on Solid Waste Management in Asia and Pacific Island (SWAPI),2013.02.
[6] WARP, “Waste Recovery Quick Wins, Practical solutions for sustainable construction”, Waste & Resources Action Programme, ISBN: 1-84405-352-0, pp.12
[7] CARMA, Carbon Monitoring for Action
http://www.carma.org/region/detail/1622786
[8] Handoko, Y, “Analisis ulang Kelayakan Tempat Pembuangan Akhir Sampah Putri Cempo Solo”, Thesis Undergraduate, Industrial