PREDICTION OF GREENHOUSE GASSES EMISSION FROM MUNICIPAL SOLID
WASTE SECTOR IN KENDARI CITY, INDONESIA
(Prediksi Emisi Gas Rumah Kaca dari Sektor Sampah di Kota Kendari, Indonesia)
Mochammad Chaerul
1*, Gan Gan Dirgantara
2dan Rangga Akib
2 1Faculty of Civil and Environmental Engineering, Institut Teknologi Bandung,
Jalan Ganesha No. 10 Bandung 40132.
2
Deutsche Gesellchaft fur Internationale Zusammenarbeit (GIZ), Menara BCA 46th FI,
Jalan MH. Thamrin No. 1 Jakarta 10310.
*
Corresponding author. Tel: 022-2534187. Email: m.chaerul@ftsl.itb.ac.id.
Diterima: 20 Mei 2015
Disetujui: 20 Agustus 2015
Abstract
Municipal solid waste sector is considered as one of major contributors for Greenhouse Gasses (GHGs). GHGs that are CO2, CH4 and N2O were emitted from any waste management stages including waste transportation, treatment and disposal. The paper aims to predict GHGs emission from the last two stages above using the guidelines issued by Intergovernmental Panel on Climate Change (IPCC) year of 2006. By comparing amount of waste generation at source and waste comes to landfill site, it can be found that the municipality only transport 68% of total 174 ton/day waste generated throughout the city. Percentage of waste to be composted and openly burned were 3.25 and 0.06 % of total waste generated, respectively. Organic waste, plastics and paper were dominantly found at final disposal site by 41, 31 and 9 %, respectively. GHGs emission from landfilling becomes a major source and it equals to 50,010 ton CO2 equivalent/year. The second largest of GHGs generator is waste burning equals to 340 ton CO2 equivalent/year. While waste composting generates 10 ton CO2 equivalent/year. Amount of GHGs emission can be reduced by reducing amount of waste to be landfilled and improving better practice at final disposal. Further, any measures regarding with Reduce, Reuse and Recycling (3R) of waste becomes important to be improved to reduce GHGs emission.
Keywords:composition, composting, greenhouse gasses, landfill, open burning.
Abstrak
Sektor sampah merupakan salahsatu penyumbang utama Gas Rumah Kaca (GRK). GRK meliputi CO2, CH4 and N2O diemisikan dari berbagai tahapan pengelolaan sampah, termasuk pengangkutan, pengolahan dan penimbunan sampah. Paper ini bertujuan untuk memprediksi emisi GRK dari dua tahapan terakhir dengan menggunakan panduan yang dikeluarkan oleh Intergovernmental Panel on Climate Change (IPCC) tahun 2006. Dengan membandingkan jumlah timbulan sampah di sumber dan yang sampai di lokasi Tempat Pemrosesan Akhir (TPA) sampah, dapat diketahui bahwa pemerintah daerah hanya dapat mengangkut 68% dari total timbulan sampah Kota Kendari di sumber yang sebesar 174 ton/hari. Jumlah sampah yang dikomposkan dan dibakar terbuka masing-masing sebesar 3,25 dan 0,06 %. Sampah organik, plastik dan kertas mendominasi jenis sampah di TPA dengan prosentase masing-masing 41, 31 dan 9 %. Emisi GRK dari penimbunan sampah menjadi sumber terbesar yaitu sebesar 50.010 ton CO2 ekuivalen/tahun. Sumber terbesar kedua adalah pembakaran sampah yang sebesar 340 ton CO2 ekuivalen/tahun. Sementara pengomposan mengemisikan 10 ton CO2 ekuivalen/tahun. Jumlah emisi GRK dapat direduksi dengan cara mengurangi jumlah sampah yang ditimbun dan memperbaiki pengoperasian penimbunan yang lebih baik. Lebih lanjut lagi, berbagai macam kegiatan yang berhubungan dengan implementasi konsep Reduce, Reuse dan Recycling (3R) dalam pengelolaan sampah menjadi penting untuk ditingkatkan dalam rangka mengurangi emisi GRK.
Kata kunci: gas rumah kaca, komposisi, landfill, pembakaran terbuka, pengomposan.
INTRODUCTION
Human activities have led to the accumulation of Greenhouse Gases (GHGs) in the environment which is responsible for climate change (Johari et al, 2012). A broad range of solid waste will be generated from domestic and industrial activities and the handling of the waste may emits the GHGs (Philippe and Nicks, 2015). Solid waste generated from domestic activities is classified as Municipal
Solid Waste (MSW). MSW management continues to be a major challenge in urban areas, particularly in the rapidly growing cities and towns of the developing countries like Indonesia.
Integrated national Appropriate Mitigation Actions (V-NAMAs) project. The project initiated by the German Government, is expected to tackle the task of integrating the multi-level governance approach into the NAMAs development practices. The project is implemented in South Africa and Indonesia. The project in Indonesia is focused on the GHGs reduction in MSW management sector. For Kendari City, the V-NAMA can be considered as the first project related to GHGs mitigation effort. Therefore, the initial step that should be taken is to develop baseline information regarding GHGs emission potential from the municipal solid waste in the city (Anonymous, 2011).
It is predicted that transportation sector contribute significantly the GHGs emission in Kendari City. However, as an urban area, Kendari City are potential also to emit GHGs from other anthropogenic activities such as agriculture, industry etc. The transportation sector includes the movement of people and goods by cars, trucks, trains, ships, airplanes, and other vehicles. The majority of GHGs from transportation are CO2 emissions resulting from the combustion of petroleum-based products, like gasoline, in internal combustion engines. The largest sources of transportation-related greenhouse gas emissions include passenger cars and light-duty trucks, including sport utility vehicles, pickup trucks, and minivans. Increasing number of cars and light-duty trucks in Kendari City reached more than 13% in year 2013 compared to year of 2012 (Anonymous, 2013). Thus, the increasing number of vehicle will increase proportionally the GHGs emission in Kendari City.
The study aims to predict the GHGs emission generated from the handling practices of MSW in Kendari City. At the moment, baseline information on GHGs emission in Kendari was not yet available. The baseline information of GHGs emission potential should be developed based on waste generation and waste composition survey. The provision of solid waste baseline information is also important for ensuring that the actions which will be implemented can be measured, reported and verified.
EXPERIMENTAL METHOD
Scope of Research
There are several types of GHGs, but the component that are considered as dominant and present in every national inventory reports are carbon dioxide (CO2), methane (CH4), and dinitrous oxide (N2O). In this study, prediction of GHGs emission adopted the guidelines issued by Intergovernmental Panel on Climate Change (IPCC) year of 2006 (Pipatti and Vieira, 2006). In fact,
several methods can be adopted to predict GHGs emission such as Life Cycle Inventory (LCI) model (Chen and Lin, 2008), etc. In waste sector, GHGs emission are divided in to several catogeries, which are (Tchobanoglous et al, 1993): solid waste disposal, including the waste dumping to managed disposal/landfill site and the waste dumping to empty field (unmanaged disposal site); solid waste biological treatment, including aerobic and anaerobic treatments; waste process with thermal process, including incineration and open burning; wastewater treatment and discharge, including sludge treatment in domestic and industrial wastewater treatment plant. Although the leachate treatment also has the potency to produce GHGs emission, this study is limited with only emission from landfill site, biological treatment, and thermal process.
Sampling Procedure
The estimation of GHGs in Indonesia mainly based on secondary data without any sampling procedure (Aprilia and Tezuka, 2013; Purwanto, 2009). In this study, sample size and sample procedure were determined in accordance with the National Standard of Indonesia (SNI No.19-3964-1994) on Methodology of sampling and measurement of generation and composition of municipal solid waste. Respondents were chosen randomly. Location of sample was distributed throughout area of Kendari City. In general, source of waste generator can be divided into two main-groups namely residential and non-residential areas. Waste generators from residential area were classified into 3 groups based on the level of income, namely high-income (HI), middle- income (MI) and low-income (LI). As the information of income level is sensitive, the determination of respondents was chosen based on the type of their house through direct field observation. Meanwhile, the determination for non-residential facility was based on the function and criteria as follow: hotels, including star and non-star hotels; schools, including kindergarten, elementary, junior and senior high schools, and university; traditional markets, including several type of stalls available; restaurants, including small and big restaurants; offices, including government and private premises; roads, including primary, artery, collector, and local roads.
Sampling Size for Residential and Non-Residential Areas
Population of Kendari city was 301,065 persons (Anonymous, 2013), and as capital city of Province, Kendari City is categorized as a big city and has a coofficient (Cd) of 1. Total respondents to be sampled using the following equation, and it can be found that the total respondents equal to 548 persons.
�
=
�
�.
�
�0.5 (1)S : Total respondents to be sampled Cd : Coefficient of city level
Ps : Total population
By assuming 4 persons per family, thus total number of family that become respondent (K) was 137 families. Distribution of population in Kendari City was assumed spread evenly, namely 33.3% for each level of household income. Thus, sample size for each level were 46 families.
Non-residential area which became respondent during sampling were schools, offices, restaurants, hotels, traditional markets, commercial areas, and roads. The sampling size for this study was determined directly as much as 5 units for each type of non-residential faciliity.
Questionnaire and Interview
Before conducting the sampling activity, several questions were asked to the sampling respondents to get related information, particularly on waste handling practices.
Calculation of GHGs Emission from Landfilling
Using IPCC method, only CH4 was considered to be emitted from landfilling and the procedure started with calculation of degradable amount of waste dumped in the landfill:
����
�=
�
.
���
.
���
�.
���
(2)DDOCm : Total of degradable waste dumped in landfill, Gg
W : Total of waste in landfills, Gg
DOC : Degradable waste fraction, Gg C/Gg waste
DOCf : Decomposed fraction of DOC
MCF : Correction factor of CH4 for aerob decomposition in landfills before the anaerob condition are created.
Meanwhile the CH4 generation potential from the waste, which is dumped in a landfill, can be calculated using following equation.
�
�=
����
�.
�
.
1612 (3)Lo : CH4 emission potential, Gg
FCH4 : fraction emission that had been produced 16/12 : Molecular weight ratio CH4 /C.
Calculation of GHGs Emission from Biological Treatment
The process of calculating emissions from composting process was done with IPCC waste methane generation model calculation, which is estimated using following equation.
������������= ∑(��.���) . 10−3− � (4)
Mi : Total of waste composted using method i, Gg EFi : Emission factor for composting using method
i, Gg
R : Total emissions accumulated (recovery), Gg
Calculation of GHGs Emission from Thermal Treatment
Waste treatment using thermal process includes incineration and open burning. However, there was no incineration available in Kendari City. Thus, GHGs emission was only based on total burned waste performed by community. GHGs emission potential which come from waste burning are CO2, N2O, dan CH4. Following formulas were used for calculating the emission.
��
2��������
=
��
�.
��
�.
��
�.
���
�.
��
�.
4412 (5)SWi : Total burned waste (Gg/year) dmi : Burned waste dry weight fraction CFi : Carbon dry weight fraction
FCFi : Fraction of carbon fossil from total carbon OFi : Oxidation factor, 58% for open burning 44/12 : Conversion factor from C to CO2
��
4��������
=
∑
(
��
�.
��
�) . 10
6 (6)Iwi : Total of burned waste (Gg/year)
Efi : CH4, emission fraction, which is 6,500g/ton (dry weight) for open burning
106 : Conversion factor from kg to Gg
�
2�
��������
=
∑
(
��
�.
��
�) . 10
6 (7)IWi : Total of burned waste (Gg/tahun)
EFi : N2O emission fraction, which is 150 g/ton (dry weight) for open burning
106 : Conversion factor from kg to Gg.
RESULTS AND DISCUSSION
Waste Generation
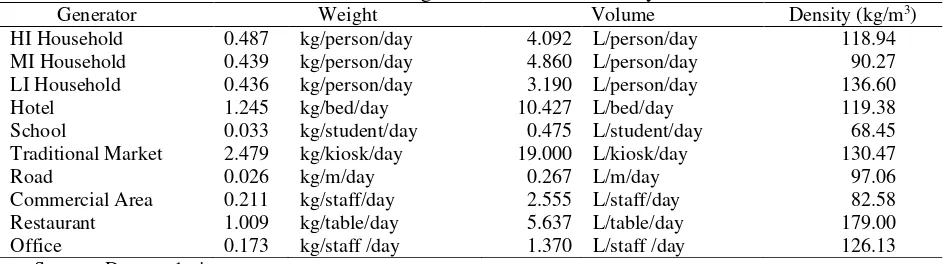
Waste generation from each source (both for residential and non-residential) can be seen in Table 1. In addition to waste generation, density of waste can be obtained for each source of waste.
household will generate higher waste generation. Compared to National Standard on Waste generation in small and medium cities in Indonesia (SNI 19-3983-1995), waste generation measured from sampling activitiy in Kendari City shows a bigger amount. The SNI was issued 18 years ago, so the standard may need to be updated.
Measurement of waste generation at final disposal site (FDS) was done by summing number of waste trucks entered to FDS. The owner of truck arrived at FDS of Kendari City, namely Puuwatu can be divided into two categories, i.e sanitation agency (mainly transport the waste from residential areas), and individual/group of community (mainly transport the waste from industry, private businesses, etc). Volume of waste transported into FDS of Puuwatu was predicted of 473 m3/day equivalent to 118.25 tons/day (Table 2)
Waste Composition
Waste composition generated from a city will affect quantity of GHGs emission. Generally, the higher the percentage of the bio-degradable waste, the higher the GHGs emission that will be emitted. Figure 1 shows the waste composition from each sources in Kendari City. It can be seen that kitchen/food waste was dominantly generated from most of generators.
Types of waste dumped at Puuwatu disposal site were dominated by organic waste (41) and plastic (31 %) (Figure 2). Meanwhile, the recyclable wastes such as paper and metals are generated less as the informal sector (scavenger) has already picked up them from source and temporary waste collection point before they are transported to disposal site. However, scavengers avalaible at TPA also collect the remaining recyclable wastes.
Table 1. Waste generation in Kendari City.
Generator Weight Volume Density (kg/m3)
HI Household 0.487 kg/person/day 4.092 L/person/day 118.94 MI Household 0.439 kg/person/day 4.860 L/person/day 90.27 LI Household 0.436 kg/person/day 3.190 L/person/day 136.60
Hotel 1.245 kg/bed/day 10.427 L/bed/day 119.38
School 0.033 kg/student/day 0.475 L/student/day 68.45
Traditional Market 2.479 kg/kiosk/day 19.000 L/kiosk/day 130.47
Road 0.026 kg/m/day 0.267 L/m/day 97.06
Commercial Area 0.211 kg/staff/day 2.555 L/staff/day 82.58
Restaurant 1.009 kg/table/day 5.637 L/table/day 179.00
Office 0.173 kg/staff /day 1.370 L/staff /day 126.13
Source : Data analysis.
Table 2. Amount of waste transported to final disposal site of Puuwatu (January-April 2013). Period By agency of sanitation (m3/day) By private sector (m3/day) Total (m3/day)
January 420 50.60 470.60
February 420 44.35 464.35
March 420 47.66 497.66
April 420 38.50 458.50
Source : Data analysis.
Figure 1. Waste composition from each source in
Prediction of Waste Generation in Kendari City
Amount of waste generated in Kendari City was predicted by multiplying the waste generation unit with their respective population of waste generators. By comparing the predicted results in the source and the amount of waste transported to landfill above, it can be obtained that level of waste collection and transportation services is 31.3 (volume basis) or 68.0 % (weight basis) (Table 3).
Prediction of GHGs Emission from Landfilling
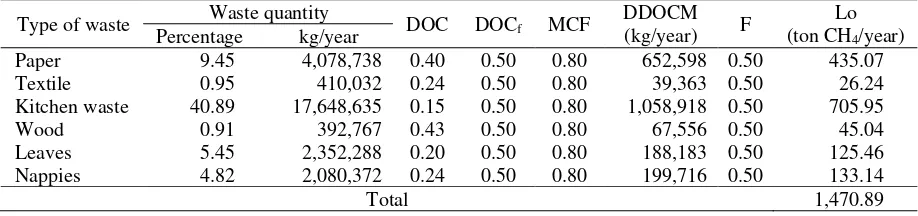
With total of waste diposed into landfill equals to 173,955 kg/day (43,161 ton/year) and waste composition from the sampling result, total of each waste type disposed into landfill can be found. GHGs emission from landfilling activities obtained from Equation 2 and Equation 3 for each waste type can be seen at Table 4. Total CH4 emission potential in landfill is 1,470 ton/year and emission from kitchen waste contributes dominantly for the total emission
Prediction of GHGs Emission from Biological Treatment
Based on the questionnaire data, there were 3 of 146 respondents that commits composting activities. Based on this data, extrapolation are made and the amount of waste to be composted in Kendari is 37,497 kg/year. With the water content of waste generated in Kendari city of 65.21 %, then the quantity of waste composted in dry weight basis is
22,499 kg. Thus, the GHGs emission can be calculated as follows:
CH4 emission = (22,499 kg/year . 10 g/kg . 10-3) – 0 = 224.980 kg/year
N2O emission=(22,499 kg/year . 0.6 g/kg . 10-3) – 0 = 13.499 kg/year
As the IPCC guideline provides two basis of weight, the calculation was also performed based on wet basis. Thus, emissions from composting activities in Kendari City is the result of the average dry and wet basis. GHGs emissions potential from composting activities in Kendari is 187.49 kg CH4/year and 12.37 kg N2O/year (Table 5).
Prediction of GHGs Emission from Thermal Treatment
From Equation 5 – Equation 7, primary data that are needed most is the total of burned waste. As in other city in Indonesia, the total of burned waste data in Kendari city was not available, so that an approach using waste handling questionnaire was done. After receiving questionnaire result from respondent, then extrapolation was done to know the total burned waste every year.
Based on questionnaire data, there were 33 of 146 respondent that burning waste as waste handling activities. Based on this data, and extrapolation of the data, the total burned waste from this activities in Kendari city was 2,063,079 kg/year. The habit of burning waste was generally done in residential area.
Table 3. Prediction ofwaste quantity disposed at final disposal site of Kendari City. Location Generation (kg/unit/day) Population (2012) Total (kg/day)
HI Household 0.487 81,852 persons 39,842
MI Household 0.439 170,809 persons 77,499
LI Household 0.436 54,962 persons 23,949
Hotel 1.245 2,555 beds 3,140
School 0.033 113,721 students 3,697
Traditional Market 2.479 4,186 m2 10,379
Road 0.026 359,633 m 9,327
Commercial Area 0.211 11,040 employees 2,330
Restaurant 1.009 2,318 tables 2,339
Office 0.173 8,419 employees 1,455
Total 173,955
Source : Data analysis.
Table 4. GHGs emission from landfilling in Kendari City.
Type of waste Waste quantity DOC DOCf MCF DDOCM (kg/year) F
Lo (ton CH4/year) Percentage kg/year
Paper 9.45 4,078,738 0.40 0.50 0.80 652,598 0.50 435.07 Textile 0.95 410,032 0.24 0.50 0.80 39,363 0.50 26.24 Kitchen waste 40.89 17,648,635 0.15 0.50 0.80 1,058,918 0.50 705.95
Wood 0.91 392,767 0.43 0.50 0.80 67,556 0.50 45.04
Leaves 5.45 2,352,288 0.20 0.50 0.80 188,183 0.50 125.46 Nappies 4.82 2,080,372 0.24 0.50 0.80 199,716 0.50 133.14
Total 1,470.89
Table 5. GHGs emission from biological treatment.
Parameter Wet weight Dry weight Average value
Waste generation (kg/year) 37,498.00 22,499.00 -
CH4 (kg/year) 145.00 224.98 187.49
N2O (kg/year) 11.20 13.49 12.37
Source : Data analysis.
Table 6. GHGs emission potensial from waste sector in Kendari City. Emission Source CO2 emission
(kg/year)
Source : Data analysis.
This was due to the unavailability of the service of transporting the waste, so that one of the options that were made to reduce the volume of garbage in a shortway was to burn it. Another reason was that the people did not understand yet the negative effects of waste burning on health and environment. And of course, the knowledge of community affected significantly to the waste handling practices (Akhtar and Soetjipto, 2014).
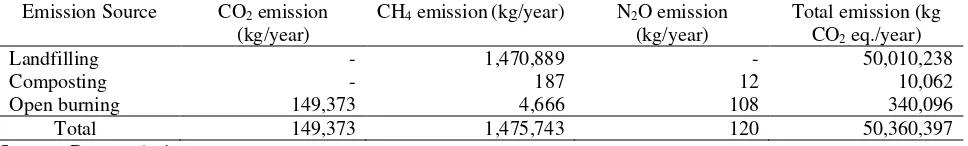
From laboratory analysis, it was found that CF and FCF for residential waste in Kendari city were 46,71 and 15.12 %, respectively. Thus GHGs emission from thermal processes can be obtained as follow: 149,372.86 kg CO2/year, 4,665.79 kg CH4/year, and 107.67 kg N2O/year.
Total GHGs Emission from Waste Sector in Kendari City
Total GHGs emission generally uses unit of CO2 equivalent. The conversion was made based on the following equation.
��
2����������
=
∑
(
����
�.
���
�)
(8)CO2equivalent : Emission potential in CO2 equivalent unit
GHGsi : GHGs emission of polutant i
GWPi : Global warming potential of polutant i
Global warming potential (GWP) is a relative measure of the amount of heat trapped by GHGs in the atmosphere. GWP value of particular gas are comparison between the amount of heat trapped by a certain mass of the gas of particular gas and the carbon dioxide gas for the same mass . A GWP is calculated over a specific time interval, usually 20, 100 or 500 years. GWP of carbon dioxide is expressed as a factor (which has a GWP value = 1 , the carbon dioxide is the standard value of GWP ). For example, 20-years GWP of methane is 86, which means that if the same mass of methane and carbon
dioxide emitted into the atmosphere, methane will cause the trapped 86 times the greenhouse effect of carbon dioxide over the next 20 years. GWP values used in this study was based on 2013 IPCC AR5 with GWP 100 years (as it was more commonly used in the international community), for CO2, CH4, and N2O were 1, 34, and 298, respectively.
Following Table 6 presents recapitulation of potential GHGs emissions in Kendari City form waste sector using the GWP conversion factors. The total potential GHGs emissions resulting from three sources of emissions in the waste management sector in Kendari City is 50,360 ton of CO2 equivalent per year.
Following mitigation efforts can be taken in order to reduce GHGs emission from waste management, i.e the composting process (either at the source or at the Landfill) need to be operated continuously, waste haul and transportation service levels needs to be improved in order to reduce the open burning that are made by resident, improving the operation of landfilling activities, especially with the application of soil cover more often, and optimizing the utilization of gas that is produced from Puuwatu Landfill. Waste to energy in form of landfill gas utilization combined with incineration became a prospective method to result a high net profit with better energy potential net GHGs emissions reduction (Tan et al, 2014; Zuberi and Ali, 2015).
implementation of 3R (Reduce, Reuse and Recycling) by local government is expected to comply with Act No. 18 year of 2008 on Waste Management. The 3R should be promoted extensively more by the governments to a larger-communities especially to the school-age generation.
CONCLUSION
Waste sector contributes to GHGs emission in Kendari City was dominantly by landfilling activity as the paradigm of waste management was only to collect, haul and dispose as much as possible to be dumped at open dumping site. The paradigm should be shifted by prioritizing the implementation of 3R starting from source. In addition to reduce GHGs emission and to comply with the regulations, the 3R can contribute to other local policy goals, such as job creation, economic development, and reducing total cost and workload for waste handling, as well as reducing land and river pollutions.
ACKNOWLEDGEMENT
This study was very much helped for every stage of sampling, data collection and analysis by my best student ever, Mr. Peter Chandra (RIP).
REFERENCES
Anonymous. 2011. Laporan Studi Inventarisasi Gas Rumah Kaca dari Sektor Persampahan. Ministry of Environment, Jakarta.
Anonymous. 2013. Kendari dalam Angka 2013. Badan Pusat Statistik Kota Kendari.
Akhtar, H., and Soetjipto, H.P., 2014. Peran Sikap dalam Memediasi Pengaruh Pengetahuan terhadap Perilaku Minimasi Sampah pada Masyarakat Terban, Yogyakarta. Jurnal Manusia dan Lingkungan, 21(3):386-392.
Aprilia, A., and Tezuka, T., 2013. GHGs Emissions Estimation from Household Solid Waste Management in Jakarta, Indonesia. Journal of Energy and Power Engineering, 7(1):661-668.
Chen, T.C., and Lin, C.F., 2008. Greenhouse Gases Emissions from Waste Management Practices using Life Cycle Inventory Model. Journal of Hazardous Materials, 155(1):23–31.
Johari, A., Ahmed, S.I., Hashim, H., Alkali, H., and
Ramli, M., 2012. Economic and
Environmental Benefits of Landfill Gas from Municipal Solid Waste in Malaysia. Renewable and Sustainable Energy Reviews, 16(5):2907–2912.
Philippe, F.X., and Nicks, B., 2015. Review on Greenhouse Gas Emissions from Pig Houses: Production of Carbon Dioxide, Methane and Nitrous Oxide by Animals and Manure. Agriculture, Ecosystems and Environment, 199(1):10-25.
Pipatti, R., and Vieira, S.M., 2006. IPCC Guidelines for National Greenhouse Gas Inventories for Waste Sector. WMO, Geneva
Purwanto, W., 2009. Perhitungan Gas Rumah Kaca dari Sektor Pengelolaan Sampah di Indonesia. Jurnal Teknologi Lingkungan, 10(1):1-8. Tan, S.T., Hashim H., Lim, J.S., Ho, W.S., Lee, C.T.,
and Yan, J., 2014. Energy and Emissions Benefits of Renewable Energy Derived from Municipal Solid Waste: Analysis of a Low Carbon Scenario in Malaysia. Applied Energy, 136 (4):797-804.
Tchobanoglous, G., Theisen, H., and Vigil, S.A., 1993. Integrated Solid Waste Management. McGraw-Hill International, Singapore. Zuberi, M.J.S., and Ali, S.F., 2015. Greenhouse