POWER STABILIZATION OF A STAND-ALONE SOLAR SYSTEM USING PERTURB
AND OBSERVE MPPT ALGORITHM
Mohd Saifuzam Jamri
1, Muhammad Nizam Kamarudin
2Department of Power Electronics and Drives, Faculty of Electrical Engineering, Universiti Teknikal Malaysia Melaka (UTeM)
1[email protected], 2[email protected]
Abstract
Solar energy is gaining more popularity for the choice of electricity generation as it is available everywhere especially in Malaysia and it is free to harness. This paper presents the method of power stabilization of a stand-alone solar system using perturb and observe (P&O) maximum power point algorithm. The PV module is modeled based on the parameters obtained from a commercial PV data sheet. A DC-DC boost converter is chosen to step up the input DC voltage of the PV module while the perturb and observe maximum power point algorithm is used and modeled to ensure the power stabilization is made. The model is simulated under a constant of solar irradiance and temperature in which follow the standard test condition (STC). The comparison between including and excluding of MPPT controller is also made and results show that the model yields the different performance.
Keywords: Solar system, Boost converter, P&O MPPT
1.
Introduction
Solar energy as one of many favored renewable energy resources has become an important part of power generation in the new millennium. The first conventional photovoltaic cells were produced in the late 1950sand throughout the 1960s were principally used to provide electrical power for earth-orbiting satellites. Solar systems produced electricity when the photons of the sunlight strike on the PV array. PV energy is environmental friendly and which generates electricity without hazardous emissions. Furthermore, the sunlight is free and it is available for long hours in a day throughout the year in Malaysia.
The stand-alone solar system is defined as an autonomous system that supplies the electricity without being connected to the utility grid. The installation of the system may include solar array, dc-dc converter, energy storage device, dc-dc-ac inverter and electrical load. The energy storage device is used as a back-up and to maintain the desired output during the low irradiance [1]-[7]. This paper focuses on modeling and control the stand-alone solar system using perturb and observe (P&O) maximum power point tracking algorithm without the connection with energy storage device.
The PV module produced the current-voltage characteristic with a unique point called as maximum power point. There are different ways in the literature to control the system such as using the fuzzy logic, neural networks, pilot cells and digital signal processor based implementation. Nevertheless, the Perturb and Observe (P&O) and Incremental Conductance (INC) algorithms are most widely used, especially for low-cost implementations [8].
This study begins with the description of modeling process and simulation work. Then, the simulation results will be shown and discussion of the results will be made. In addition to that, a simulation of model without using MPPT controller will be made to distinguish the system performance. Finally, conclusion will be drawn.
2.
Modeling and Simulation
A. Modeling of solar module
PV cell is a non-linear device and can be represented as a current source in parallel with diode [6]-[7] as shown in the circuit in Fig. 1. The practical solar cell model includes the connection of series and parallel internal resistance, namely Rs and Rp, which is
expressed as the following equation:
s
Fig. 1: The electrical equivalent circuit of a solar cell.
The IPV,cell is the light generated current produced by
a PV cell which has a linear relationship with the solar irradiance and temperature, as shown in the following equation:
PV,cell PV,n i
n
G
I (I K T)
G
= + ∆ (2)
where, IPV,n is the light generated current at the
standard test condition (STC) which are 25°C and 1000 W , ∆T = T-Tn where T and Tn is the
actual and nominal temperature in unit Kelvin, K respectively. While G (W ) is the solar irradiation by the PV cell surface and Gn is the
nominal solar irradiation [7].
The is the diode saturation current and its dependence on the temperature may be expressed by:
SC,n i
0
OC,n v
t
I K T
I
V K T
exp( ) 1
aV
+ ∆
=
+ ∆
−
(3)
where and are the open-circuit
voltage/temperature coefficient and the short-circuit current/temperature coefficient respectively . While and are the short-circuit current and open-circuit voltage under the nominal condition or STC respectively. The BP340 PV module is chosen for the PV module modeling. The electrical characteristics given by datasheet are shown in Table 1. This module consisting of 36 cells connected in 2 parallel strings. The model of solar module was implemented in MATLAB/simulink using Eq. 1-3. By using the electrical parameter of the module (ISC, VOC) and the
variables voltage, Irradiation (G) and Temperature (T) as the inputs to the model, the model yields the solar current I.
The simulated I-V and P-V characteristic curves are shown in the Fig. 2 and Fig. 3 respectively, where the model is simulated for a varies of solar irradiances and different temperatures. The results show that the
solar module is capable to reproducing the electrical characteristics as mentioned in Table 1.
Table 1: The electrical characteristic of BP340 PV module
Parameter Variable Value
Maximum power 40 W
Voltage at Pmax 17.3 V
Current at Pmax 2.31 A
Short-circuit current ISC 2.54 A
Open-circuit voltage VOC 21.8 V
Temperature coefficient -(80±10) of open-circuit voltage mV/°C Temperature coefficient (0.065±0.015)%/°C of short-circuit current
(a)
(b)
Fig. 2: PV module characteristic curves plotted under different irradiances, (a) I-V curve, (b) P-V curve
(b)
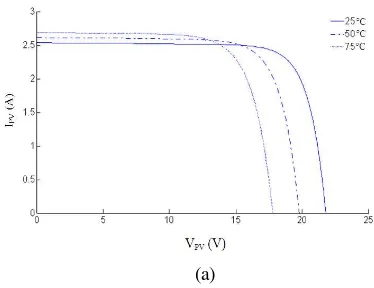
Fig. 3: PV module characteristic curves plotted for different temperatures, (a) I-V curve, (b) P-V curve.
B. Modeling of perturb and observe maximum power point algorithm
The solar module is a form of unstable energy affects in the location of the array’s maximum power. Hence, under uniform irradiance, it yields the current-voltage characteristic with a unique point which is known as the Maximum Power Point (MPP) [3]-[5]. As shown in the Fig. 2-3 in previous section, the MPP is change as a consequence of the variation of the irradiance level and temperature. It is necessary to track the MPP continuously in order to maximize the power output from the PV system for the prevailing conditions.
There are several MPP tracking methods in the literature, such as fuzzy logic control, neural network control, pilot cells and digital signal processor based implementation. Nevertheless, Perturb and Observe (P and O) and Incremental Conductance (INC) algorithms are most widely used, especially for low-cost implementations. In P and O MPP algorithm, a small perturbation is introduced in every iteration to alter the duty cycle in order to force the operating point to move near the MPP. This algorithm compares the power of the previous step cycle with the power of the new step cycle to determine the next perturbation direction. If the power increases due to the perturbation then the perturbation will remain in the same direction. If the peak power is reached, the power at the next instant decreases and hence, the perturbation reverses. When the steady-state is reached, the algorithm oscillates around the peak point. In order to keep the power variation small the perturbation size is kept very small [5]. The operation of P&O MPP algorithm is illustrated in the Fig. 4. The modeling of this MPPT
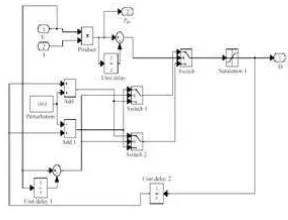
algorithm is done using MATLAB/simulink which is according to the flow of algorithm. Figure 5 shows the simulink block of this MPPT.
Fig. 4: The flowchart of P and O MPPT algorithm
Fig. 5: P and O MPP simulink block
perturbation value may affect the algorithm efficiency and oscillation around MPP.
3.
Simulation setup
In order to validate the proposed MPPT algorithm model, a simulation of the PV module together with a boost converter is performed as shown in Fig. 6. The idea is, the switching operation of boost converter is controlled by proposed MPPT algorithm itself. The value of duty cycle is varies depends on the perturbation of current and voltage from PV cells. The boost converter is designed to generate small
Fig. 6: Simulation set up of the PV module
4.
Result and Analysis
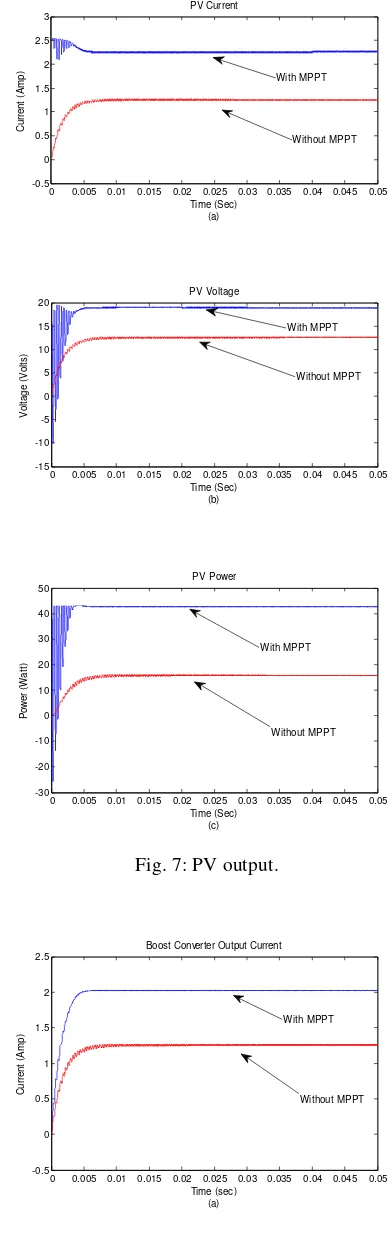
Fig. 7 shows a simulation result of the PV output current, PV output voltage as well as PV output Power for both MPPT equipped system and non-MPPT equipped system. non-MPPT tries to optimize the PV output power of maximum 40 Watt which is identical to the electrical characteristics of BP340 PV module as tabulated in the previous Table 1. The PV current and voltage at maximum power is 2.3 Ampere and 17 Volts respectively which again confirmed the characteristics.
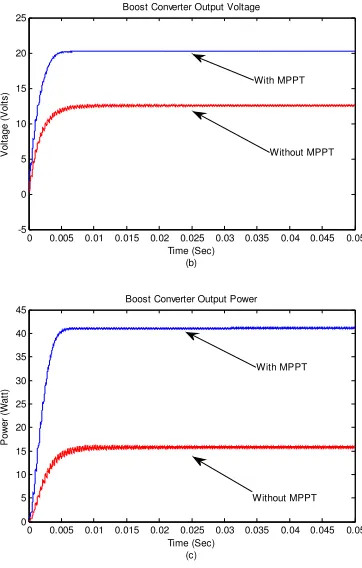
The MPPT tries to optimize the duty cycle of the power electronic switch through P&O algorithm to stabilize the output power at the load side. Fig. 8 confirmed that the system with MPPT assists the boost converter in producing stable output power which confirmed the characteristics of the BP340 PV module
0 0.005 0.01 0.015 0.02 0.025 0.03 0.035 0.04 0.045 0.05 -0.5
0 0.005 0.01 0.015 0.02 0.025 0.03 0.035 0.04 0.045 0.05 -15
0 0.005 0.01 0.015 0.02 0.025 0.03 0.035 0.04 0.045 0.05 -30
0 0.005 0.01 0.015 0.02 0.025 0.03 0.035 0.04 0.045 0.05
0 0.005 0.01 0.015 0.02 0.025 0.03 0.035 0.04 0.045 0.05 0
Fig. 8: Boost converter output.
5. Conclusion and Discussion
In this work, a PV system with MPPT controlled boost converter has been simulated. The results show that the P&O algorithm for MPPT performs very well in stabilizing the PV output at the converter side as well as at the PV side. In the simulation, the MPPT through intelligent P&O algorithm managed to optimize the output at 0.12
[1]A. D. Theocharis, A. Menti, J. Milias-Argitis, and T. Zacharias, "Modeling and simulation of a single-phase residential photovoltaic system," in Power Tech, 2005 IEEE Russia, 2005, pp. 1-7. [2] G. M. S. Azevedo, M. C. Cavalcanti, K. C.
Oliveira, F. A. S. Neves, and Z. D. Lins, "Evaluation of maximum power point tracking methods for grid connected photovoltaic systems," in Power Electronics Specialists Conference, 2008. PESC 2008. IEEE, 2008, pp. 1456-1462.
[3] R. E.-B. M. Salhi, "Maximum Power Point Tracking Controller for PV Systems using a PI
Regulator with Boost DC/DC Converter," ICGST-ACSE Journal, vol. 8, pp. 21-27, 2009.
[4] J.-H. P. Hyun-Su Bae, Bo-Hyung Cho, Gwon-Jong Yu, "New MPPT Control Strategy for Two-Stage Grid-Connected Photovoltaic Power Conditioning System," Journal of Power Electronics, vol. 7, pp. 174-180, 2007.
[5] S. Armstrong and W. G. Hurley, "Self-regulating maximum power point tracking for solar energy systems," in Universities Power Engineering Conference, 2004. UPEC 2004. 39th International, 2004, pp. 604-609 vol. 1
[6] F. M. González-Longatt, "Model of Photovoltaic Module in Matlab™,"IEEE, 2005.
[7] J. R. G. M. G. Villalva, E. Ruppert F, "Modeling and circuit-based simulation of photovoltaic," IEEE, 2008.