Global Positioning System (GPS) Positioning Errors
Modeling Using Global Ionospheric Scintillation
Model (GISM)
Y.H. Ho
Faculty of Electronic and Computer Engineering Universiti Teknikal Malaysia Melaka (UTeM)
Hang Tuah Jaya, Melaka. Malaysia [email protected]
S. Abdullah, M. H. Mokhtar Institute of Space Science (ANGKASA) Universiti Kebangsaan Malaysia (UKM)
43600 Bangi, Selangor, Malaysia [email protected], [email protected]
Abstract — As technology advancement progresses throughout the years in this modern age, every technology has its part to play in that the world is moving towards a brighter future. GPS (Global Positioning System) has diverse application in current globalized world, its application has pervasive benefits not only to navigation and positioning, it is pivotal in industries like logistics, shipping, financial services and agriculture. Since the decision to shut down the Selectivity Availability (SA) by former U.S. President, Bill Clinton, ionospheric effect is now the primary concern of error contributing factors in GPS. Ionospheric scintillation induces rapid fluctuations in the phase and the amplitude of received GNSS signals. These rapid fluctuations or scintillation potentially introduce cycle slips, degrade range measurements, and if severe enough lead to loss of lock in phase and code. Global Ionospheric Scintillation Model (GISM) was used to compute amplitude scintillation parameter for each GPS satellite visible from Melaka, Malaysia (Latitude 20 14’ N, Longitude 1020 16’ E) as its location has strong equatorial scintillation behavior. The output data from GISM was then used to calculate the positioning error. There are two schemes that were used. First, the positioning error was calculated for all the visible satellites. Secondly, the positioning error was calculated for those satellite that have amplitude scintillation index, S4 < 0.7. Comparison of results from the both schemes was then made.
Keywords—GPS, Scintillation, Positioning Error
I. INTRODUCTION
The Global Positioning System (GPS) is being developed and operated to support military navigation and timing needs. For the past few decades, more and more attention is given in its suitability for civil applications. The complete GPS system consists of 24 operational satellites and provides 24 hours, all weather navigation and surveying capability worldwide. A major milestone in the development of GPS was achieved on 8 Dec 1993, when the 24 satellites (Blocks I, II, IIA) were successfully operating.
The satellites transmit at frequencies L1 = 1575.42 MHz and L2 = 1227.6 MHz. Two types of codes and a
navigation message are modulated into the GPS signals. The two types of codes are the Coarse/Acquisition (C/A) code and restricted Precision (P) code. The C/A code is a 1,023 bit deterministic sequence called PseudoRandom Noise (PRN) code which, when transmitted at 1.023 Mbit/s, repeats every millisecond. These sequences only match up, or strongly correlate, when they are exactly aligned. Each satellite transmits a unique PRN code, which does not correlate well with any other satellite's PRN code. In other words, the PRN codes are highly orthogonal to one another. This is a form of code division multiple access (CDMA), which allows the receiver to recognize multiple satellites on the same frequency. The P code is also a PRN; however, each satellite's P code’s PRN code is 6.1871×1012 bits long (6,187,100,000,000 bits, ~720.213 gigabytes) and only repeats once a week (it is transmitted at 10.23 Mbit/s). The extreme length of the P code increases its correlation gain and eliminates any range ambiguity within the Solar System. However, the code is so long and complex it was believed that a receiver could not directly acquire and synchronize with this signal alone. It was expected that the receiver would first lock onto the relatively simple C/A code and then, after obtaining the current time and approximate position, synchronize with the P-code. Whereas the C/A PRNs are unique for each satellite, the P code PRN is actually a small segment of a master P code approximately 2.35 × 1014 bits in length (235,000,000,000,000 bits, ~26.716 terabytes) and each satellite repeatedly transmits its assigned segment of the master code.
Selective Availability (SA) was an intentional degradation of the GPS signal by the U.S. government. Due to this, the level of accuracy was limited to 100 m horizontal position (95% probability) and 140 m vertical position (95% probability). This condition was imposed in order to restrict the full accuracy of the GPS system to authorized military users only. After the SA was officially turned off at midnight on May 1, 2000, the ionosphere became the greatest source of error in GPS applications.
The ionosphere is part of the upper atmosphere and extends over the region between approximately 50 and 1500 km above the Earth’s surface where free electrons and positive charged particles (ions) exist in sufficient density to influence the propagation of electromagnetic waves. The ionosphere is a dispersive medium up to microwave frequencies. It affects Global Navigation Satellite System (GNSS) signals traveling from a satellite through ionosphere to a receiver located near Earth’s surface. The effect is a function of carrier frequency and the electron density along the signal path. However, the properties of the ionosphere are well-known with its structure and electron density varies strongly with time, geography location, solar activities and geomagnetic activity. The dynamics of the ionosphere is remarkable whereas one or two orders changes in magnitude of the electron content are not a rare event.
Ionospheric scintillations are rapid variations in the amplitude and phase of transionospheric radio signals resulting from density irregularities in the ionosphere. Scintillations show strong diurnal, seasonal, geographic and solar cycle dependence being at their most severe during the evening hours, in the months of the equinox, at equatorial latitudes and during the years of solar maximum. As the next solar maximum is predicted to occur in May 2013, it is expected that scintillation activity will increase over the coming years.
Scintillations affect GPS receivers at the tracking loop level and so have the potential to disrupt all GPS systems, including both single and dual frequency receivers and both stand-alone and differential systems. The errors introduced into the code and carrier tracking loops of a GPS receiver result in an increase in range measurement errors and under extreme conditions can lead to a complete loss of signal lock. Other effects include an increase in the probability of errors within the GPS navigation data and an increase in the time taken to acquire the GPS signal when a receiver is first turned on. However, as scintillations are unlikely to affect all of the satellites in a receiver’s field of view simultaneously, their impact on navigational accuracy will be through degradation in the geometry of the available constellation. Consequently, the coverage of both the satellites and the irregularities, as well as the intensity of scintillation activity will all contribute to the accuracy of the final position solution.
II. POSITIONING ERRORS MODELING USING GLOBAL
IONOSPHERIC SCINTILLATION MODEL (GISM) GISM is a model that was developed at IEEA, Courbevoie, France by Yannick Beniguel. It uses the Multiple Phase Screen technique (MPS) which consists of an application of the Parabolic Equation (PE) for a medium divided into successive layers. Each of the layers acts as a phase screen [1]. The GISM program is a mixed climatological and physical model which includes a model of irregularities and their variation with geomagnetic latitude, longitude, time of day, season of year and sunspot number. Mean errors are obtained employing a ray technique using the values of the ionosphere electron density obtained with NeQuick model [2] which is
included in GISM. The normalized standard deviations of intensity (S4) and phase (σφ) at ground level are
calculated in the first stage. After specification of the receiver characteristics, the signal scintillations at receiver level are then calculated. Further details of the GISM program can be found in [3].
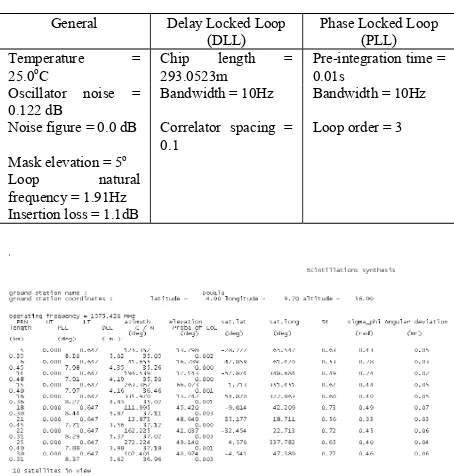
GISM was used to compute amplitude and phase scintillation parameters for each GPS satellite visible from Melaka, Malaysia (Latitude 20 14’ N, Longitude 1020 16’ E) as its location has strong equatorial scintillation behaviour in that region. The errors were derived from these parameters and from typical receiver characteristic. Some parameters for typical receiver characteristics are shown in Table 1. Figure 1 shows results obtained from GISM.
The output data from GISM was then used to calculate the positioning error. There were two schemes that were used. First, the positioning error was calculated for all the visible satellites. Secondly, the positioning error was calculated for those satellites that have S4 < 0.7. Comparison of results from both schemes was then made.
TABLE I. TYPICAL THE RECEIVER CHARACTERISTICS OF GISM General Delay Locked Loop
(DLL)
Phase Locked Loop (PLL) Temperature =
25.0o
C
Chip length = 293.0523m
Pre-integration time = 0.01s
Oscillator noise = 0.122 dB
Bandwidth = 10Hz Bandwidth = 10Hz Noise figure = 0.0 dB Correlator spacing =
0.1
Loop order = 3 Mask elevation = 5o
Loop natural frequency = 1.91Hz
Insertion loss = 1.1dB
Figure 1. Scintillations synthesis from GISM
A.Positioning Errors
In most cases, scintillation doesn’t affect all visible satellites. If the number of satellites is four or more than a standard receiver should be able to provide positioning information. However, the number of satellites and their positions affect the positioning precision. The Dilution of Precision (DOP) is usually used to quantify this precision. The DOP is related to the geometrical distribution of the visible satellites. It is used to derive the positioning error (σp) from the User Equivalent Range
UERE DOP
p= ×
σ (1)
B.Dilution of Precision
Scintillations in GPS reduce the effectiveness of determining the position. They will affect the signals received from the GPS satellite. However, not all are necessarily affected by it. It depends on the satellite’s locations and the location and properties of the irregularities. Usually each receiver is able to detect between 9 to 11 GPS satellites at a time. A minimum of four satellites are required to enable each receiver to determine a position. As long as scintillation does not affect a minimum of four satellites, the receiver may still be able to provide the receiver position, though the position will be less accurate.
DOP is measured by each receiver based on the visible satellites at each time. In general, the more the satellites, the better the DOP value will be. However, the DOP also depends on the geometrical position of all the satellites. The lower the DOP, the more accurate the positioning will be. Satellites that are situated far from each other will produce a better (lower) DOP value compared with the situation where satellites that are close to each other which has a poor geometry. Poor geometry is when the satellites are in the same plane, orbiting close to each other, or at similar elevations.
DOP can be calculated in a number of ways. There are 5 measures of DOP; Geometrical Dilution of Precision (GDOP), Position Dilution of Precision (PDOP), Horizontal Dilution of Precision (HDOP), Vertical Dilution of Precision (VDOP) and Time Dilution of Precision (TDOP). PDOP consists of HDOP and VDOP. GDOP consists of PDOP and TDOP.
C.DOPs Calculation
In order to calculate the DOP values, the satellites and receiver position in World Geodetic Survey 1984 (WGS84) Earth-Centered Earth-Fixed (ECEF) coordinate is required. From the GISM program, each of the satellites position in latitude, longitude and altitude is given for every epoch. This position was converted to ECEF coordinate using the equations below.
2 2
cos .cos
1
sin
a
x
h
e
λ
λ
φ
⎡
⎤
=
⎢
+
⎥
−
⎣
⎦
2 2
cos .sin
1
sin
a
y
h
e
λ
φ
λ
⎡
⎤
=
⎢
+
⎥
−
⎣
⎦
(2)(
2)
2 2
1
sin
1
sin
a
e
z
h
e
λ
λ
⎡
−
⎤
⎢
⎥
=
+
⎢
−
⎥
⎣
⎦
wherex is ECEF x-coordinate (m) y is ECEF y-coordinate (m) z is ECEF z-coordinate (m)
a is equatorial Earth’s radius (6378137 m)
e is first eccentricity (0.081819190842622 m) h is height above WGS84 ellipsoid (20200000 m)
λ is geodetic latitude (radians)
φ is geodetic longitude (radians)
Then, pseudoranges (Ri) from receiver position to each
of the satellites are calculated using equation
(
) (
2) (
2)
2i i i i
R
=
SVx
−
Rx
+
SVy
−
Ry
+
SVz
−
Rz
(3)where,
SVxi is ith satellite position in ECEF x-coordinate (m)
SVyi is ith satellite position in ECEF y-coordinate (m)
SVzi is ith satellite position in ECEF z-coordinate (m)
Rx is receiver position in ECEF x-coordinate (m) Ry is receiver position in ECEF x-coordinate (m) Rz is receiver position in ECEF x-coordinate (m)
Directional derivatives (D) for xyz (Dx, Dy, Dz) and time (Dt) was computed
i i i
SVx
Rx
Dx
R
−
=
i i iSVy
Ry
Dy
R
−
=
(4)i i i
SVz
Rz
Dz
R
−
=
1 − = − = t t t Dti i rwhere ti is i
th
satellite time (s) tr is receiver time (s)
t is signal travelling time from ith satellite to receiver (s)
From the directional derivatives, covariance matrix (A) for each of the satellites was produced as below.
1 1 1 1
:
:
:
:
:
:
:
:
i i i i
Dx
Dy
Dz
Dt
A
Dx
Dy
Dz
Dt
⎡
⎤
⎢
⎥
⎢
⎥
=
⎢
⎥
⎢
⎥
⎣
⎦
(
)
1.
T
P
=
A A
−where
A
T = transposeA
1,1 1,2 1,3 1,4
2,1 2,2 2,3 2,4
3,1 3,2 3,3 3,4
4,1 4,2 4,3 4,4
P
P
P
P
P
P
P
P
P
P
P
P
P
P
P
P
P
Then, DOP was calculated using this equation.
1,1 2,2 3,3 4,4
1,1 2,2 3,3
1,1 2,2
1,1
4,4
GDOP
P
P
P
P
PDOP
P
P
P
HDOP
P
P
VDOP
P
TDOP
P
=
+
+
+
=
+
+
=
+
=
=
D.User Equivalent Range Error (UERE)
User Equivalent Range Error (UERE) represents the combined effect of space and control segment errors (satellite vehicle position and clock errors), atmospherics (ionospheric and tropospheric), and user equipment errors (receiver measurement uncertainties).
Space and control segment errors are indicated in the form of User Range Accuracy (URA). Each of the GPS satellite transmits the URA value consists all errors such as satellite clock error and Selective Availability (SA). All of these errors will be corrected by the control segment on earth and will be uploading to each of the satellites. The URA index broadcast by each satellites will change over time and its value depends on the length of time since the last control segment upload to that satellite.
Atmospheric errors are errors that are caused by the ionosphere and troposphere affecting the satellite RF signal. Ionospheric effects include the delay and loss of signal and this depends on the time of day, season of the year, sunspot activity and satellite’s elevation angle. The tropospheric effect is quite small in comparison.
User Equipment Errors (UEE) are errors that are caused by the uncertainties in the measurements. These uncertainties include the design of tracking loops, the code type being tracked (C/A or P(Y)), and the strength of satellite signals, receiver noise, multipath, and antenna orientation.
UERE cannot be broadcast by the satellites and can only be estimated at the receiver. The fact that sets UERE apart from other measures of error is that the UERE does not take into account any satellite geometry effects, such as HDOP or VDOP.
UERE are calculated using the mean of range error that was produced from GISM program.
j R
UERE=
∑
i (5)where
Ri is range error
j is number of satellites
III. RESULTS AND ANALYSES
A. Results Obtained for DOPs
The GISM program was used to compute all the scintillation parameters for each GPS satellite visible from Melaka, Malaysia (Latitude 20 14’ N, Longitude 1020 16’ E). The tracking error was derived from these parameters and from typical receiver characteristics. DOP values were evaluated with a 5o antenna mask (signals 5o or more above the horizon).
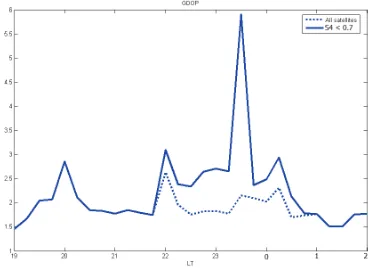
Figure 2. GDOP at Melaka under scintillation conditions computed with GISM
Figure 3. PDOP at Melaka under scintillation conditions computed with GISM
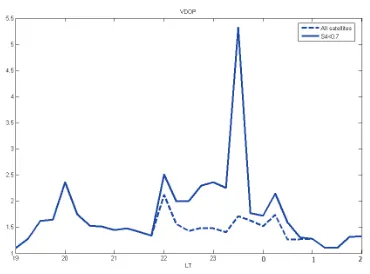
Figure 5. VDOP at Melaka under scintillation conditions computed with GISM
As mentioned before, in general, the more satellites there are, the better (lower) the DOPs value will be. Figure 2 – 5 above presents the comparison of DOPs (GDOP, PDOP, HDOP and VDOP) that was evaluated in two cases; for all satellites and also for just those with S4 < 0.7. Satellites with S4 above 0.7 were considered facing strong amplitude scintillation and were ignored for the DOP evaluation. DOPs values for all satellites are better compared with the value of the several satellites that was taken with the S4 below the 0.7 threshold. The above threshold value was chosen based on the widely agreement for definition of strong amplitude scintillation with S4 > 0.7. S4 above the 0.7 threshold occurs during the post sunset time from about 10.00 pm to 1.00 am local time in equatorial region.
B. Results for Positioning Errors
For the positioning error, the DOP values that were calculated were multiplied by the UERE as Equation 1. The UERE was calculated from the mean of the range error that was produced from GISM as Equation 5.
There are two schemes that were considered in calculating the positioning error. First, the calculation of DOPs and UERE values were for all the visible satellites. For this scheme, the expectation of the value of DOP should be low but the UERE may be high. Secondly, satellites with S4 above 0.7 were ignored for the DOPs and UERE calculation. Conversely from the first scheme, the expectation of the DOPs values should be high but the UERE may be lower. Both of these schemes are then compared.
Figure 6. UERE at Melaka under scintillation conditions computed with GISM
Figure 6 shows resulting UERE on both schemes. As expected, high values of UERE were obtained from all satellites considered. It is because of the additional error due to strong scintillation. Lower values of UERE were obtained from satellites with S4 < 0.7 to reduce the errors due to scintillation.
Figure 7. Geometrical errors at Melaka under scintillation conditions computed with GISM
Figure 8. Positional Errors at Melaka under scintillation conditions computed with GISM
Figure 10. Vertical errors at Melaka under scintillation conditions computed with GISM
Figure 6 – 10 show positioning errors as from Equation 1 for GDOP, PDOP, HDOP and VDOP respectively at Melaka under scintillation conditions computed with GISM. Dashed lines show positioning errors obtained with all satellites consideration, and solid lines show positioning errors obtained from satellites with S4 < 0.7.
Results show positioning errors due to scintillation effects cannot be simply improved by excluding satellites with high scintillation parameter in positioning computation. UERE can always been improved by excluding satellites with high scintillation parameter, however, DOP will always increase. From the simulation results, the positioning errors improved during 2200 – 2300 LT and 0000 – 0100 LT. However, during 2300 – 2400 LT, the decreased values of UERE could not counter increased values of DOP and lead to an increase of positioning errors.
IV. CONCLUSION &FUTURE WORKS
In this paper, the GISM was used to simulate all scintillation parameters for each GPS satellite visible from Melaka, Malaysia (Latitude 20 14’ N, Longitude 1020 16’ E). The output data from GISM was then used to calculate the positioning error. There were two schemes that been used. First, positioning error was calculated for all the visible satellites. Secondly, the positioning error was calculated for those satellites that have S4 < 0.7.
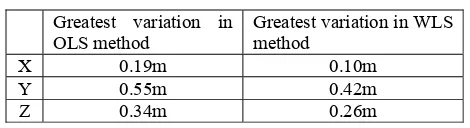
To conclude, positioning errors cannot simply be improved by excluding those GPS paths affected by strong scintillation. The positions of all visible satellites play a vital role in positioning accuracy. The plan of excluding GPS satellite paths with S4 > 0.7 is not sufficient to counter positioning errors due to increased values of DOPs. Currently, Weighted Least Square method (WLS) for single point positioning was developed in MATLAB platform to test different weighting parameters in aim to improve positioning errors. Initial tested results using individual satellite elevation angle shows a promising result with improved positioning accuracy. Table II shows the greatest single point positioning variations in Ordinary Least Square (OLS) method and WLS method using satellite elevation angle.
TABLE II. THE GREATEST SINGLE POINT POSITIONING VARIATIONS Greatest variation in
OLS method
Greatest variation in WLS method
X 0.19m 0.10m
Y 0.55m 0.42m
Z 0.34m 0.26m
Strangeways et. al. [4] reported GPS positioning improvement inpolar region by scintillation mitigation using tracking error variance. Ho and David [5] reported a better improvement for RMS 3D errors using tracking error variance compared to satellite elevation angle as weighting parameter in stochastic model tested in DGPS.
The developed WLS model in UTeM will be further tested using different weighting parameters such as amplitude scintillation parameter, S4; phase scintillation parameter, σφ; tracking error variance etc.
ACKNOWLEDGMENT
The authors would like to acknowledge the support of this work by Ministry of Higher Education Malaysia and Universiti Teknikal Malaysia Melaka (UTeM) on research grant FRGS/2012/FKEKK/SG02/02/1/F00125.
REFERENCES
[1] Beniguel Y., Forte B., Radicella S., Strangeways H., Gherm V., & Zernov N., Scintillation Effects on Satellite to Earth Links Telecommunication and Navigation Purposes, Annals of Geophysics, Vol. 47, N. 2/3, 2004.
[2] Di Giovanni, G. and S.M. Radicella, An Analytical Model of the Electron Density Profile in the Ionosphere, Adv. Space Res., 10
(11), 27-30. 1990.
[3] Beniguel Y., Global Ionospheric Scintillation Model, Technical Manual Vers. 5.1, IEEA, ITU-R, Oct 2004.
[4] Strangeways, H. J., Y.-H. Ho, M. H. O. Aquino, Z. G. Elmas, H. A. Marques, J. F. G. Monico, and H. A. Silva (2011), On determining spectral parameters, tracking jitter, and GPS positioning improvement by scintillation mitigation, Radio Sci., 46, RS0D15, doi:10.1029/2010RS004575.