Distinctive features of radiation pulses in the very
fi
rst moment
of lightning events
M.R.M. Esa
a,b, M.R. Ahmad
a,c, M. Rahman
a, V. Cooray
aaÅngström Laboratory, Division of Electricity, Department of Engineering Sciences, Uppsala University, 534 SE-75121 Uppsala, Sweden bUniversiti Teknologi Malaysia, 81310 UTM Skudai, Johor, Malaysia
cUniversiti Teknikal Malaysia Melaka, Hang Tuah Jaya, 76100 Durian Tunggal, Malacca, Malaysia
a r t i c l e
i n f o
Article history:
Received 19 June 2013 Received in revised form 28 November 2013 Accepted 28 December 2013 Available online 8 January 2014
Keywords:
Initial breakdown Cloud to ground discharges Cloud discharges Isolated breakdown
a b s t r a c t
This paper investigates the existence of distinctive features between 4 different types of lightning discharges, namely negative cloud to ground discharge ( CG), positive cloud to ground discharge (þCG), cloud discharge (IC) and isolated breakdown discharge (IB). A total of 110 veryfine structure waveforms of 44 CG, 16þCG, 39 IC, and 11 IB discharges have been selected from a collection of 885 waveforms measured using fast electricfield broadband antenna system. The measurements were carried out in Uppsala, Sweden from May to August 2010. We found that there are significant distinctions within the first 1 ms among different types of lightning discharges ( CG,þCG, IC, and IB). For example, the pulses in CG discharges are more frequent than other discharges; the pulses in þCG discharges have the highest intensity and the IC discharge pulses tend to have shorter duration.
&2014 Elsevier Ltd. All rights reserved.
1. Introduction
Any lightning discharge must be initiated with an electrical breakdown process. Thus breakdown process marks a starting point of all lightning discharges. However information regarding the initiation of the breakdown process is still not really well understood. Two hypothetical mechanisms have been proposed to explain the lightning initiation process in the cloud namely the conventional breakdown theory and the runaway breakdown theory (Gurevich and Zybin, 2005).
Initial breakdown process can be defined as an in-cloud process associated with lightning initiation that involves the formation of one or more channels in random directions by bridging two charge regions. Clarence and Malan (1957) suggested that electrical discharges occur when a vertical channel bridging the main negative charge centre (N region) and lower positive charge pocket (p region). Moreover, Proctor (1997) observed vertical channels bridging the main negative and main positive charge (P
region) sources gave rise to electrical discharge process. On the other hand, Norinder and Knudsen (1956) and Krehbiel et al. (1979)suggested that horizontal channel extended from the main negative charge source gave rise to electrical discharges. In addition, Norinder and Knudsen (1956) also observed oblique channels extended from the main charge sources.
The breakdown process during lightning initiation could be grouped into three categories as suggested bySharma et al. (2008). Breakdown process leading to cloud-to-ground discharge (CG) return strokes is the most common and well-studied category particularly the negative CG discharges ( CG). The initial break-down process is believed to lead the initiation of the break- downward-moving stepped leader. Such breakdown process is commonly known as preliminary breakdown process (PBP) in CGflash. The second category is a breakdown process associated with cloud discharge (IC) and the final category is an isolated breakdown discharge (IB) that does not lead to any subsequent activities.Nag and Rakov (2009)have used different terms to describe IB process that is attemptedfirst cloud-to-ground leaders.
Each breakdown process associated with CG, IC, and IB consists of train of pulses with both initial half-cycle polarities (Gomes and Cooray, 2004; Sharma et al., 2008). Furthermore, Sharma et al. (2008)observed that positive initial polarity pulses generally lead to the IC and negative initial polarity pulses generally lead to the CG. In addition, Gomes and Cooray (2004) also observed that positive initial polarity pulses generally lead to the positive CG (þCG).
Sharma et al. (2008) have made comparison of initial break-down processes between CG, IC and IB captured from Swedish thunderstorms. They found that it is hard to differentiate between the negative initial polarity of IB and CG breakdown pulses. Both of IB and CG negative initial polarity breakdown process have comparable train duration, total number of pulses and inter-pulse duration (IPD). In contrast, the negative initial polarity of IC Contents lists available atScienceDirect
journal homepage:www.elsevier.com/locate/jastp
Journal of Atmospheric and Solar-Terrestrial Physics
1364-6826/$ - see front matter&2014 Elsevier Ltd. All rights reserved. http://dx.doi.org/10.1016/j.jastp.2013.12.019
E-mail addresses:[email protected],
breakdown pulses has higher average total number of pulses compared to IB and CG by a factor of 1.5. On the other hand, differences of the positive initial polarity breakdown process between CG, IC and IB could be observed. The average total number of pulses of positive initial polarity of IB breakdown pulses is smaller compared to CG and IC by a factor of 2.5 and 3.5, respectively.
Nag et al. (2009) andNag and Rakov (2009) provided detail comparison of initial breakdown processes between CG, IC, and IB captured from Florida thunderstorms. They observed the existence of submicrosecond-scale pulses in both CG and IC but none have been observed in IB. The pulse duration (PD) for the majority of the pulses in CG (478%) and IC (485%) was equal
or less than 4μs. In contrast, the average PD for IB breakdown pulses was 17. This implies that the initial breakdown pulses of CG and IC contain“narrow”or“shorter”pulses compared to IB pulses. Furthermore, the average PD of CG breakdown pulses was longer than IC by a factor of 1.3, which implies that the initial breakdown pulses of IC are narrower or shorter than CG. More-over, the average total number of pulses of IC breakdown process was higher than CG with 110.25 compared to 58.83, which means that the initial breakdown pulses of IC is not only shorter but also more compact compared to CG.
Gomes and Cooray (2004)made a comparison of initial break-down processes between þCG and CG captured from Swedish
thunderstorms. They discovered that the leading edges of the initial half-cycle ofþCG breakdown pulses were relatively smooth
compared to CG. Typically, the initial half-cycle of the CG initial breakdown pulses are superimposed by a few sharp, narrow, unipolar pulses. They observed that their average PD was longer than previous study, 38μs compared to 18.8μs (Ushio et al., 1998). Ushio et al. (1998)have considered all the pulses in the breakdown train in their analysis whileGomes and Cooray (2004)only used selected largest pulses from the breakdown train and this reason may have contributed to the different values of average PD.
In all previous studies, the analysis was based on considering the whole duration of the train of breakdown pulses, which leads to the above observations and conclusions. In this paper, we are motivated to examine the very first moment of the breakdown process (within thefirst 1 ms). The individual pulses in the earliest part of the train may give useful information about lightning initiation process in the cloud and give us some clue on distinctive features that may exist leading to different lightning discharge processes. Moreover, we believe that there are no studies where all four types of initial breakdown processes leading toþCG, CG,
IC and IB lightning discharges were compared in a single analysis. Sharma et al. (2008),Nag and Rakov (2009), andNag et al. (2009) have made comparison between CG, IC and IB only whileGomes and Cooray (2004) provided comparison between þCG and
CG only.
2. Experimentation
The measurements were done in a stationary and fully grounded van (Fig. 1) located in the premise of Ångström Labora-tory, Uppsala University, Sweden (59.81N and 17.61E) during
summer thunderstorm between 25th of May and 31st of August 2010. The measuring station is situated at about 100 km from the Baltic Sea. The measuring system consists of three main parts as shown inFig. 2, namely the parallelflat plate antenna unit, the buffer circuit unit and the recording unit (digital storage oscillo-scope or DSO).
A set of broadband antenna system (together with a buffer circuit in the protected metal case beneath the parallel plate antenna) was installed approximately 2 m away from the van
and mounted about 1.5 m above the ground plane using a grounded rod as shown inFig. 3. The antenna was used to record the fast variation of vertical electricfields. To capture fast variation field, the buffer circuit unit was designed to have around 10 ns rise time and 15 ms decay time constants. The resistorR2and capacitor
Cvalues shown by the circuit schematic diagram inFig. 4 deter-mined the value of decay time constant. The upper and lower
Fig. 1.The measurement instruments are placed within fully grounded and
protective metal van.
Fig. 2.The fast electricfield broadband antenna system.
Fig. 3.Parallelflat plate antenna used for the measurement of fast electricfield
frequency limits are determined by the rise time and decay time constants, τr and τd, respectively. Theoretically, the higher 3 dB frequency limit of bandwidth is given by 1/2πτr, while for lower frequency limit of bandwidth is given by 1/2πτd. The rise time and decay time constants used for our measuring system are 10 ns and 15 ms, respectively. Therefore, our system translates it to 3 dB frequency limits of 10 Hz and 16 MHz. The fast variation electric field that have been acquired by the antenna are then being driven to the buffer circuit unit via a 60 cm long RG58 coaxial cable. The reasons to have the buffer circuit unit in the measurement system are to isolate the high input impedance coming from the antenna through the coaxial cable and powerful enough to send the input signal to the recording unit. Considering the sensitivity of the electronic circuits to disturbances, batteries were used to power up the buffer circuit in order to minimize interferences from other electronic devices and recording equipments.
The signal from the buffer circuit unit was directed by using a 10 m RG58 coaxial cable to the DSO, which was placed in the stationary van. The inner part of the van is half-covered with an aluminium metal plate and fully grounded. The DSO is an independent, isolated 4-channel 12-bit Yokogawa SL1000 and equipped with DAQ modules 720210 as shown in Fig. 5. The recorder0s sampling rate was set to 20 MS/s (50 ns time resolution)
and pre-trigger delay was 200 or 300 ms with the total of 1 s window frame. A total of 885 waveforms were recorded during this measurement campaign.
The equivalent circuit for the complete measurement system is shown in Fig. 6whereCais the antenna capacitance, e(t) is the background electric field, he is the effective height (or effective length) of the antenna,Ccis the cable capacitance,R1is the cable resistance,Cis the capacitance used to set the decay time constant,
R2is the resistance that also used to set the decay time constant,Ro
and Cv are the resistance and capacitance used to match with
buffer output impedance and coaxial cable to recording unit,Vmis the measured voltage at the oscilloscope andRmis the matching resistor for the coaxial cable connection to the oscilloscope.
3. Data
A total of 885 waveforms were recorded and examined during this campaign. Out of these 110 waveforms of veryfine structure were selected and these were then divided into a particular category. 44 out of 110 were CG, 16 were þCG, 39 were IC,
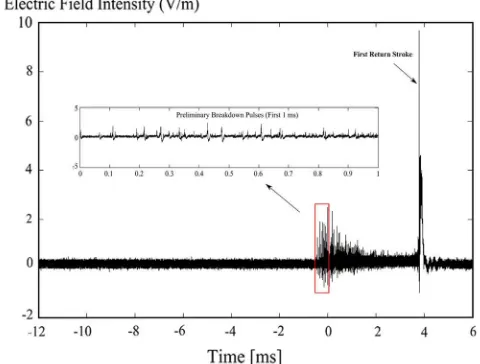
and the remaining 11 waveforms were IB. The analysis was focusing on the pulses found from the initial breakdown process for thefirst 1 ms duration.Figs. 7–10show an example of thefirst 1 ms of preliminary breakdown pulses extracted from CG,þCG,
IC and IB discharges, respectively.
The selected waveforms must be processed before they can be analyzed. The step-by-step data processing of the selected wave-forms are explained below:
Step1. Filtering
The waveforms werefiltered with afirst order 2 kHz high pass filter in order to eliminate lower frequency and static field components.Step2. Waveform inversion (IC andþCG only)
This particular step was done only for IC and þCG waveforms.
This is because both waveforms have polarities opposite to CG and IB. The inversion of the waveforms was done using Matlab before zeroing it to the offset level.Step3. Zeroing the offset level
During the measurement, it often occurred that the captured waveforms were displaced from zero or reference line due to low battery voltage supply. The waveforms were moved to the zero reference line based on the offset value. The waveform-offset value was determined visually from Xviewer waveform reader and a horizontal line was dragged either up or down to
Fig. 4.The schematic diagram of the buffer electronic circuit.
Fig. 5. The recording unit placed in the van.
Fig. 6.Equivalent circuits for the fast electricfield broadband antenna measuring
system.
Fig. 7.Activity recorded on 24 August 2010, trace number 30 at 15:41:41, the time
get the best reference or zero crossing line in the middle of the waveform.
Step4. Categorization method
Pulse categorization method (Ahmad et al., 2010) was applied in order to choose an appropriate starting point of the first 1 ms. All pulses in a waveform were grouped into 3 different categories; large (L), medium (M) and small (S). Within thefirst 1 ms, 5 pulses with the largest amplitudes were selected and averaged. This average value was then used to group the pulses. The definitions of each category are as follows:
i. Large category (L): the amplitude of the pulse is more than or equal to 50% of average value.
ii. Medium category (M): the amplitude of the pulse is between 25% and 49% of the average value.
iii. Small category (S): the amplitude of the pulse is between 12.5% and 24% of the average value.
If the noise was dominant where the calculated S category value was lower than noise level, then the noise level would become the S category value.Step5. Definition of thefirst pulse of1ms duration
The manual visual scanning to get the first pulse began from the left of the waveform. If the amplitude of thefirst detected pulse was lower than S category value, the scanning continued to the next pulse. Once the amplitude of the pulse was in the S category value, that pulse was marked as the first pulse. The 1 ms duration began with thisfirst pulse.Step6. Total number of pulses
Each pulse has a starting point and an end point relative to the reference line as shown inFig. 11. The total number of pulses in the first 1 ms duration was counted for each waveform and would be used to estimate the average of normalized amplitude later.Step7. Amplitude normalization
In each waveform, a pulse with the largest amplitude was chosen as a reference pulse. Then the amplitude of the remaining pulses was normalized to the reference pulse. Since we do not know the distance between the lightning source and the point of observation, amplitude normalization would help us to analyze the waveform amplitude pattern, relative to the largest amplitude. Finally, the normalized amplitudes were averaged to the total number of pulses for each waveform.Step
8. Pulse duration (PD)
Pulse duration is the duration of one complete cycle. When the pulse amplitude was higher than S category value, we defined the start point and the end point as shown inFig. 11.
Fig. 8.Activity recorded on 28 August 2010, trace number 12 at 17:17:58, the time
window during this measurement was 1 s with pre-trigger delay of 200 ms. As is seen, activity consists of a return stroke and the expanded part which is thefirst 1 ms of the breakdown pulses that leads to positive CG discharges (þCG).
Fig. 9.Activity recorded on 24 August 2010, trace number 31 at 15:43:38, the time
window during this measurement was 1 s with pre-trigger delay of 300 ms and the expanded part which is thefirst 1 ms of the breakdown pulses that lead to cloud discharge (IC).
Fig. 10.Activity recorded on 25 August 2010, trace number 15 at 13:54:40, the time
window during this measurement was 1 s with pre-trigger delay of 200 ms. As is seen, no further activity is found after the isolated breakdown and the expanded part which is thefirst 1 ms of the isolated breakdown pulses (IB).
Fig. 11.Waveform characterizations. (Note: Green dotted lines show the small
4. Results and discussions
The statistical distribution of the total number of pulses, the average normalized amplitude, and the pulse duration are given for all four different categories as side-by-side box plots in Figs. 12–14, respectively. The plots in Fig. 12 suggest that it is almost impossible to differentiate betweenþCG, IC, and IB groups.
They have very close mean and Standard Deviation (SD) values, which gives us an idea that they are almost indistinctive. The only significant distinction could be made is by CG group where the mean value of CG is significantly higher than the others. The plots inFigs. 13 and 14indicate the same pattern due to the very same reason. The only significant distinction could be made in Fig. 13 is by þCG group where the mean value of þCG is
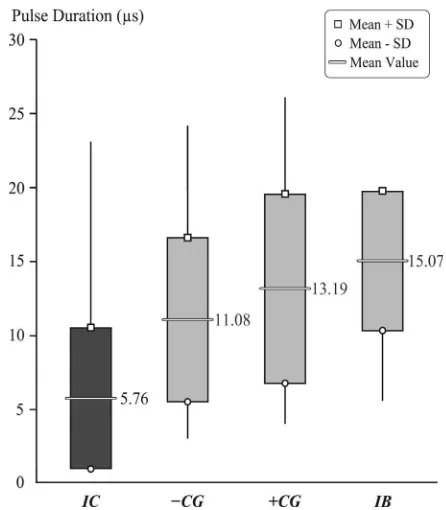
significantly higher than other three. Furthermore the only sig-nificant distinction could be made inFig. 14is by IC group where the mean value of IC is one third from IB mean value and less than half from CG andþCG values. The complete statistical
distribu-tion informadistribu-tion can be obtained fromTable 1.
Each parameter indicates different significant distinctive group. The total number of pulses suggests that CG is significantly distinctive from the others while average of normalized amplitude suggestingþCG to be significantly distinctive instead of CG. On
the other hand, PD parameter suggests that IC is more distinctive compared to the others. However, if we consider that much longer PDs of CG, þCG, and IB groups were affected by propagation
over land, it is possible that we cannot observe any distinction between the groups. As we do not have distance information to relate this possibility, we are not in the position to comment further about the effect of propagation over land.
The basis of the claim that these groups are significantly distinctive is their mean values differ a lot from the others, which makes sure that they are not overlapping (individual data are less overlap) or at least the overlapping percentage is small. The Analysis Of VAriance (ANOVA) statistical test was used to test if the groups have the same mean values or not as have been used by Ahmad et al. (2010). ANOVA test is the best statistical tool to be used in order to compare more than 2 groups and having the unbalance sample numbers (Gravetter and Wallnau, 2007). Sum-mary of ANOVA test results is tabulated inTable 2below.
FromTable 2,P-value andF-value for all parameters are much less thanαand are much higher than Fcriticalvalue, respectively. These results tell us that all four lightning groups are significantly distinctive to some extent. The correlation coefficient (ω2) gives us an idea about how strong the magnitude of distinction between groups are and the calculated values are 53.15%, 25.60%, and 26.04% for the total number of pulses, average normalized ampli-tude, and pulse duration respectively.
Fig. 12.Statistical distribution of the total number of pulses for IC, CG,þCG and
IB groups.
Fig. 13.Statistical distribution of the averaged normalized amplitude for IC, CG,
þCG and IB groups.
Fig. 14.Statistical distribution of the pulse duration (PD) for IC, CG,þCG and IB
A post-hoc multiple-comparison Tukey statistical test was chosen to evaluate the distinction level between two groups given significance levelsαequal to 95% and 99%. If we have 4 groups that means there are 6 pair-wise combinations. In this test, itfinds the
differences between the mean values of all groups and then this difference value is compared to a critical value so called honestly significant difference (HSD) to see if the difference is significant.
From Table 3, the total number of pulses parameter suggests that there is significant distinction with 99% confidence level between CG and the other groups. Also there is significant distinction with 95% confidence level between þCG and IB.
Interestingly, IC cannot be differentiated significantly from other groups except with CG. The average of normalized amplitude parameter suggests that there is significant distinction with 99% confidence level between þCG and the other groups. Moreover,
CG, IC, and IB cannot be differentiated significantly except with
þCG. The pulse duration parameter suggests that there is
sig-nificant distinction between IC and the other groups. Moreover, CG, þCG, and IB cannot be differentiated significantly except
with IC. Therefore we can summarize that, the total number of pulses parameter can be used to differentiate between CG and other groups significantly, the averaged of normalized amplitude parameter can be used to differentiate between þCG and other
groups significantly, and the pulse duration can be used to differentiate between IC and other groups significantly.
These findings through statistical test mean tell us that the initial breakdown mechanism of each type of discharges is different. The CG discharge has the total number of initial pulses that is significantly distinctively higher from other discharges. We suggest that the CG discharge tends to radiate pulses more frequently in the initial stage when compared to other discharges. Our finding contradicts the observations made bySharma et al. (2008)and Nag et al. (2009)where they suggested IC discharge tends to radiate pulses more frequently. This contradiction may be due to the fact that they analyzed the whole train of pulses while we focusing our analysis only within thefirst 1 ms of the train. The
þCG discharge could be differentiated from CG and the other
discharges by observing the average normalized amplitude para-meter. We suggest that theþCG discharge tends to radiate pulses
with higher electricfield intensity compared to other discharges.
Table 2
Summary of ANOVA statistical test results for different temporal parameters.
Parameter P-value F-value Correlation
coefficient,ω2(%)
Remarks
α¼0.05Fcritical¼2.69 IfPoαandFZFcritical, we reject the null hypothesis and the mean
is different between groups, otherwise we accept the null hypothesis Total number of pulses 3.9E 18 42.59 53.15
Average of normalized amplitude 1.4E 07 13.62 25.60 IfF-value andω2are higher, the distinction variations between
groups are more coherent Pulse duration 1.0E 7 13.91 26.04
Table 3
Summary of post-hoc Tukey test.
Parameters CG andþCG CG and IC CG and IB þCG and IC þCG and IB IC and IB
Total number of pulses HSD0.05¼9.61 and HSD0.01¼11.73
Group mean difference 27.8 25.92 18.06 1.88 9.74 7.86
P-value condition o0.01 o0.01 o0.01 Not significant o0.05 Not significant
Confidence level 99 99 99 95
Average of normalized amplitude HSD0.05¼0.08 and HSD0.01¼0.1
Group mean difference 0.18 0.03 0.02 0.15 0.16 0.02
P-value condition o0.01 Not significant Not significant o0.01 o0.01 Not significant
Confidence level 99 99 99
Pulse duration HSD0.05¼4.43 and HSD0.01¼5.41.
Group mean difference 2.11 5.32 3.99 7.43 3.99 9.31
P-value condition Not significant o0.05 Not significant o0.01 Not significant o0.01
Confidence level 95 99 99
Table 1
Complete statistical distribution information for IC, CG,þCG and IB groups.
From here we can deduce that CG radiates pulses more fre-quently thanþCG but with much lower intensity in thefirst 1 ms
duration. Furthermore, the IC discharge also could be differen-tiated significantly from CG,þCG, and IB by observing the pulse
duration parameter. We suggest that IC discharge tends to radiate shorter pulses when compared to the others, which is in perfect agreement with observations byNag et al. (2009). Also we suggest that IC discharge tends to radiate less frequent compared to CG and much lower intensity when compared toþCG.
In the light of recent optical radiation and electricfield studies, the leader velocity during the initial stage of breakdown process in CG discharge is much faster than the later stage of breakdown process as evidence fromFig. 2inCampos and Saba (2013). In the initial stage, the velocity has dropped drastically from 1.2106m s 1to 6105m s 1along the 800 m leader channel
in just 1 ms. Further evidence fromTable 3inStolzenburg et al. (2013)shows that the velocity of thefirst leader channel (corre-sponds to thefirst electricfield breakdown pulse) is much faster than the subsequent leader channels extension (subsequent elec-tric field breakdown pulses). The average velocity of the first leader channel is estimated at 1.09106m s 1, much higher than
the average velocity of the second leader channel extension at 7.8105m s 1. Stolzenburg et al. (2013) has inferred that very
fast leader channel extension during the initial stage of CG was due to very rapid impulsive breakdown processes. Consequently, we infer that the initial stage of breakdown process in CG discharge is temporally more compact with radiation pulses than the later stage based on the fact that very rapid impulsive break-down processes radiated large number of breakbreak-down pulses during the initial stage. This inference may explain why we found that CG discharge has the total number of pulses that is significantly distinctively higher from other discharges in thefirst 1 ms. On the other hand, this inference also suggesting that the ionizations during breakdown process of IC, þCG, and IB
dis-charges were less rapid when compared to CG discharge. Furthermore, recent finding based on wavelet analysis by Esa et al. (2013)shows that thefirst electricfield pulse of IC discharge radiates higher frequency component when compared to the other discharges. They suggested that the PD of the first electric field pulse of IC discharge must be much shorter than the other discharges, which supported our observation about PD of IC pulses within thefirst 1 ms.
5. Conclusion
We found that there are significant distinctions between all the lightning discharge groups ( CG,þCG, IC, and IB) within thefirst
1 ms of the electrical breakdown process. The CG radiates pulses more frequently than other discharges with much lower intensity
when compared to þCG in the first 1 ms duration. The þCG
always radiates the highest intensity pulses compared to other discharges. The IC discharge tends to radiate shorter pulses but less frequent compared to CG with much lower intensity when compared toþCG.
Acknowledgement
Research work in this paper was funded and supported by Ministry of Higher Education Malaysia. Participation of Prof. V. Cooray and Dr. M. Rahman was funded by the fund from the B. John F. and Svea Andersson donation at Uppsala University. We would like to acknowledge Dr. Azlinda Ahmad, Mr. Zikri Abadi Baharudin and Mr. Pasan Hettiarachchi for providing the measure-ment data.
References
Ahmad, N.A., Fernando, M., Baharudin, Z.A., Rahman, M., Cooray, V., Saleh, Z., Dwyer, J.R., Rassoul, H.K., 2010. Thefirst electricfield pulse of cloud and cloud-to-ground lightning discharges. J. Atmos. Sol. Terr. Phys. 72, 143–150. Campos, L.Z.S., Saba, M.M.F, 2013. Visible channel development during the initial
breakdown of a natural negative cloud-to-groundflash. Geophys. Res. Lett. 40, 1–6,http://dx.doi.org/10.1002/grl.50904.
Clarence, N.D., Malan, D.J., 1957. Preliminary discharge processes in lightning
flashes to ground. Q. J. R. Meteorol. Soc. 83, 161–172.
Esa, M.R.M., Ahmad, M.R., Cooray, V., 2013. Wavelet analysis of thefirst electricfield pulse of lightningflashes in Sweden. Atmos. Res. (http://dx.doi.org/10.1016.j. atmosres.2013.11.019)
Gomes, C., Cooray, V., 2004. Radiationfield pulses associated with the initiation of positive cloud to ground lightning flashes. J. Atmos. Sol. Terr. Phys. 66, 1047–1055.
Gravetter. Frederick J., Wallnau, Larry B., 2007. Introduction to Analysis of Variance, Statistics for the Behavioural Sciences. Thomson Wadsworth, pp. 392–397. Gurevich, A.V., Zybin, K.P., 2005. Runaway breakdown and the mysteries of
lightning. Phys. Today 58 (5), 37,http://dx.doi.org/10.1063/1.1995746.
Krehbiel, P.R., Brook, M., McCrory, R., 1979. An analysis of the charge structure of lightning discharges to the ground. J. Geophys. Res. 84, 2432–2456.
Nag, A., Rakov, V.A., 2009. Electricfield pulse trains occurring prior to thefirst stroke in negative cloud-to-ground lightning. IEEE Trans. Electromagn. Compat 51 (1), 147–150.
Nag, A., DeCarlo, B.A., Rakov, V.A., 2009. Analysis of microsecond- and submicrosecond-scale electric field pulses produced by cloud and ground lightning discharges. Atmos. Res. 91, 316–325.
Norinder, H., Knudsen, E., 1956. Pre discharges in relation to subsequent lightning strokes. Arkiv foer Geofysik 2 (27), 551–571.
Proctor, D.E., 1997. Lightning flashes with high origin. J. Geophys. Res. 102, 1624–1693.
Sharma, S.R., Cooray, V., Fernando, M., 2008. Isolated breakdown activity in Swedish lightning. J. Atmos. Sol. Terr. Phys. 70, 1213–1221.
Stolzenburg, M., Marshall, T.C., Karunarathne, S., Karunarathna, N., Vickers, L.E., Warner, T.A, Orville, R.E., Betz, H.-D., 2013. Luminosity of initial breakdown in lightning. J. Geophys. Res. Atmos. 118, 2918–2937,http://dx.doi.org/10.1002/ jgrd.50276.