Wavelet analysis of the
fi
rst electric
fi
eld pulse of lightning
fl
ashes in Sweden
Mona Riza Mohd Esa
a,b,1, Mohd Riduan Ahmad
a,c,⁎
, Vernon Cooray
a,1aÅngström Laboratory, Division of Electricity, Department of Engineering Sciences, Uppsala University, Box 534, SE-75121 Uppsala, Sweden bUniversiti Teknologi Malaysia, 81310 UTM Skudai, Johor, Malaysia
cUniversiti Teknikal Malaysia Melaka, Hang Tuah Jaya, 76100 Durian Tunggal, Malacca, Malaysia
a r t i c l e
i n f o
a b s t r a c t
Article history: Received 6 August 2013
Received in revised form 24 October 2013 Accepted 21 November 2013
In this paper, we investigate the wavelet characteristics of the first electric field pulse of four different flash types namely negative cloud-to-ground flash (−CG), positive cloud-to-ground flash (+CG), cloud flash (IC) and isolated breakdown flash (IB). A total of 110 fine waveforms out of 885 were selected which have been recorded during summer between May and August 2010 in Uppsala, Sweden. The measurement was done by using an electric field broadband antenna system with the time resolution of 20 Megasample per second. Evidence from our wavelet analysis suggests that the ionization process during the initial leader development (coincide with the detection of the first electric field pulse) of at least three flashes (−CG, IC, and IB) in Sweden was dictated directly by the existence and magnitude of localized free ions region and lower positive charge center (pregion). In general, we found that both single peak and multiple peaks pulses of the negative CG and IC flashes radiated energy at higher frequencies and gain larger bandwidth when compared to positive CG and IB flashes. We suggest that the initial leader development of both IC and negative CG flashes underwent very rapid and much more extensive ionization process when compared to the positive CG and IB flashes. In specific comparison between negative CG and IC flashes, both temporal and wavelet analyses suggest that the first electric field pulses of IC flash radiated energy at higher frequency in both single spread categories and radiated energy at lower frequency in both multiple spread categories when compared to the negative CG flash. This finding may explain the observation of much slower and less bright type αleader (ionization process not so extensive) compared to much faster and very bright typeβleader (ionization process very rapid and more extensive). As for positive CG and IB flashes, the single peak pulses of positive CG radiated energy at much higher frequency while the multiple peaks pulses radiated energy at much lower frequency than IB flash. We suggest that the initiation mechanism of positive CG was dictated directly by the background electric field between the main positive charge center and the ground, which is distinct from the initiation mechanism of IB flash. The presence of small magnitude of localized free ions region facilitated the rapidity of the ionization process in the initial leader development of IB flash.
© 2013 Elsevier B.V. All rights reserved. Keywords:
Cloud to ground flash Cloud flash Isolated breakdown Wavelet
First electric field pulse
1. Introduction
Understanding initial breakdown process of each light-ning flashes is the key to understand the lightlight-ning initiation process in the thundercloud. So far the information regarding the lightning initiation within the thundercloud is still not really well understood. This remains a big challenge to be
⁎Corresponding author at: Ångström Laboratory, Division of Electricity, Department of Engineering Sciences, Uppsala University, Box 534, SE-75121 Uppsala, Sweden. Tel.: +46 184715849; fax: +46 184715810.
E-mail addresses:[email protected](M.R.M. Esa), [email protected](M.R. Ahmad),
[email protected](V. Cooray). 1Tel.: +46 184715849; fax: +46 184715810.
0169-8095/$–see front matter © 2013 Elsevier B.V. All rights reserved. http://dx.doi.org/10.1016/j.atmosres.2013.11.019
Contents lists available atScienceDirect
Atmospheric Research
investigated. Classical studies by Schonland (1956) and
Clarence and Malan (1957)have identified the initial break-down process as“B”stage preceding the stepped leader (L) stage in negative cloud-to-ground flash (−CG). In addition, Clarence and Malan (1957)identified intermediate (I) stage in betweenBandLstages. Both studies suggested thatBstage is started somewhere between the main negative charge center (Nregion) and lower positive charge center (pregion). Further,
Clarence and Malan (1957) suggested that the discharge mechanism ofB stage is totally different from the Lstage. In contrary,Schonland (1956)hypothesized that bothBand
Lstages are initiated by the same discharge mechanism and
L stage is actually continuation or extension process from
Bstage.
TheBstage could be grouped into three general categories as suggested bySharma et al. (2008). The first category is a breakdown process leading to CG and commonly known as preliminary breakdown process (PBP). The second category is a breakdown process associated with cloud flash (IC) and the final category is an isolated breakdown (IB) flash that does not lead to any subsequent activities.Nag and Rakov (2009)have used‘attempted first cloud-to-ground leaders’
and‘inverted IC flash’terms to describe IB flash.
From photographic evidence, Schonland (1938) has observed two different types ofB–Lprocess development in negative CG namelyαandβ. Typeαis the most common and
frequent where the negative leaders travel downward to the ground without excessive branching with effective velocity of the leader ranges from 1 to 5 × 10⁵m s−1. Typeβ(30% of
the observed cases) is much faster and brighter in its initial stage than theαtype with effective velocity in the order of 106m s−1. This initial stage is always associated with an
extensive branching process at its end. The later stage ofβ
type is similar to theαtype with slower velocity and less
brightness.
Schonland (1938, 1956) hypothesized that the very intense luminosity of very fast leaders in initial stage ofβ
type implies a very high field (much more higher than critical field needed for breakdown) in front of the leaders' tip. Most probably the existence of very high electric field is due to the existence of large magnitude ofpregion near the cloud base as inferred byClarence and Malan (1957). However, abnormally large magnitude ofpregion would enhance significantly the electric field but may block the propagation of negative leaders to the ground as suggested byNag and Rakov (2009)and gives rise to IB flash. Alternatively, the local electric field in front of the leaders' tip could be enhanced significantly caused by rapid charge reset from hydrometeors to the free ions as suggested byGurevich and Karashtin (2013)due to the fact that large number of electrically charged hydrometeors is available betweenNandpregions.
Recent studies byCampos and Saba (2013)andStolzenburg et al. (2013)present observations of optical radiation and fast electric field data of negative leader event indicate that theB
pulse trains occur simultaneously with the development of the lightning channel. Both studies have observed leader events similar to typeβwith very bright and fast leader propagation in the order of 106m s−1in its initial stage. The later stage was
observed to be less bright and slower leader propagation in the order of 105m s−1. In addition,Campos and Saba (2013)have
observed that the initial stage ended with branching.
Campos and Saba (2013)found that the first electric field pulse was detected simultaneously with the observation of the first, very bright leader channel at altitude 4800 m just above the estimatedpregion. The 2D velocity of the first leader was about 1.2 × 10⁶m s−1. The initial branching event was
ob-served to occur near cloud base at altitude approximately 4000 m with the 2D velocity estimated around 6 × 10⁵m s−1.
The total length of the leader channel was estimated at 800 m.
Stolzenburg et al. (2013)have observed a short and dim, the first negative leader appeared at altitude between N and p
regions in less than 50μs before the first pulse was detected.
The first electric field pulse was not detected until the negative leader became very bright (most likely when the ascending positive space leader made contact with the descending negative leader). Therefore it was inferred that the first electric field pulse was due to impulsive breakdown event (current pulse originated at the tip of the negative leader and pro-pagated along the channel). The average 2D velocities of the first leader and the last leader were estimated at 1.09 × 10⁶m s−1and 3.5 × 10⁵m s−1, respectively, which is
com-parable to the range of velocity values obtained byCampos and Saba (2013). The average total length of the leader channel was estimated at 872 m, which is also comparable to the total length obtained byCampos and Saba (2013). In addition to the negative CG flash,Stolzenburg et al. (2013)have analyzedB
stage from three IC flashes. They found that the luminosity observed during IC flashes looks generally the same to that observed during negative CG flashes.
From temporal evidence, (Gomes and Cooray, 2004; Sharma et al., 2008; Nag and Rakov, 2009; Nag et al., 2009) have made comparison between negative CG, IC, IB, and positive CG (+CG) flashes and their common discovery is that the IC flash has the shortest pulse duration and the largest number of total pulses when compared to the other flashes. The temporal analyses of previous studies were done for the whole duration of the train of breakdown pulses. Instead of analyzing the whole duration of the train,Ahmad et al. (2010)have chosen to consider only the first pulse from the train of breakdown pulses. They made comparison between IC and negative CG lightning flashes and they found that the temporal characteristics of the first pulse for both IC and negative CG are similar, which contradicts previous observations. Therefore they suggested that the initial break-down process of both lightning flashes could be the same.
Sharma et al. (2011)looked beyond the temporal domain and investigated the characteristics of PBP pulse train of negative CG in time–frequency domain that can be obtained through wavelet transform. Unlike the Fourier transform, wavelet transform is capable to identify the power content of the investigated peak in time–frequency domain and moreover to localize the power in the frequency domain. The analysis was done within 200μs time frame. They analyzed
Sharma et al. (2011) have used Derivative of Gaussian (DOG) wavelet algorithm to capture both the positive and negative peaks as separate waves and consequently the analysis of both the initial half and the overshoot of a bipolar pulse could be done. The usage of DOG wavelet algorithm has been established earlier in lightning research by Miranda (2008)to analyze the negative and positive return strokes in Brazil. Recent work by Li et al. (2013) has used Laplace wavelet algorithm to analyze the time–frequency character-istic of the first and subsequent return strokes. However as suggested bySharma et al. (2011)the DOG wavelet is the most stable so far (divergence of the results is much less) and therefore in this paper we continue to use DOG wavelet algorithm rather than Laplace wavelet algorithm. Detail ex-planation about DOG and Laplace theories and algorithms can be found inMiranda (2008),Sharma et al. (2011), andLi et al. (2013).
In this paper, we are motivated to investigate the wavelet characteristics of the first pulse of the electrical breakdown pulses, which can be seen as an extension to temporal characteristics investigation byAhmad et al. (2010). The first pulse may give useful time–frequency information about lightning initiation process in the thundercloud and provides us some clue on distinctive features that may exist leading to different discharge processes. Furthermore, we also provide detail wavelet analysis and made detail comparison between all four types of lightning flashes (−CG, IC, +CG, and IB),
where we believe this comparison study was absent in both
Ahmad et al. (2010)andSharma et al. (2011)work.
2. Experimentation
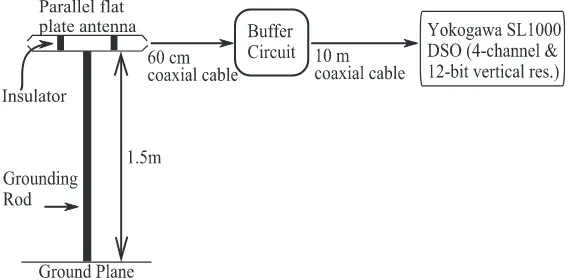
The measurements were done in a stationary and fully grounded van located in the premise of Ångström Laboratory, Uppsala University, Sweden (59.8°N and 17.6°E) during summer thunderstorm between the 25th of May and 31st of August 2010. The measuring station is situated at about 100 km from the Baltic Sea. The measuring system consists of three main parts as shown inFig. 1, namely the parallel plate antenna unit, the buffer circuit unit and the recording unit (digital storage oscilloscope or DSO) and similar to the mea-suring system used inSharma et al. (2008). A set of broad-band antenna system (together with a buffer circuit in the protected metal case beneath the parallel plate antenna) was
installed approximately 2 m away from the van and mounted about 1.5 m above the ground plane using a grounded rod. The antenna was used to record the incident vertical electric fields. The fast variation electric field that has been acquired by the antenna is then being driven to the buffer circuit unit via a 60 cm long RG58 coaxial cable. Essentially, the buffer circuit is used to isolate high input impedance coming from the antenna unit and the captured signal is not amplified because the antenna gain is unity. The upper and lower frequency limits are determined by the rise time and decay time constants, τr and τd, respectively. Theoretically, the
higher 3 dB frequency limit of bandwidth (BW) is given by 1/2πτr, while for lower frequency limit of BW is given by
1/2πτd. The rise time and decay time constants used for
our measuring system are 10 ns and 15 ms, respectively. Therefore, our system translates it to 3 dB frequency limits of 10 Hz and 16 MHz. Considering the sensitivity of the electronic circuits to disturbances, batteries were used to power up the buffer circuit in order to minimize disturbances from other electronic devices and recording equipments. The electrical signal from the buffer circuit unit was directed by using a 10 m RG58 coaxial cable to the DSO, which was placed in the stationary van. The inner part of the van is half-covered with an aluminium metal plate and fully ground-ed. The DSO used is a 4-channel 12-bit Yokogawa SL1000 and equipped with DAQ modules 720210. The recorder's sampling rate was set to 20 MS/s (50 ns time resolution) and pre-trigger delay was 200 or 300 ms with the total of 1 s window frame. The trigger setting of the oscilloscope was set such that the signals of both polarities could be recorded automatically. The trigger level was set between the range of 100 mV to 1 V in order to capture both remote and close lightning flashes. A total of 885 waveforms were recorded during this measurement campaign.
3. Results and discussion
From a total of 885 recorded waveforms that have been examined, 110 very fine structure waveforms are selected and divided into 4 categories. 44 out of 110 are negative CG, 16 positive CG, 39 IC, and the remaining 11 waveforms are IB. The analysis is focusing on the first electric field pulse found in the initial breakdown process from each category. The criteria and selection method for the first pulse are the same
as used by Ahmad et al. (2010). The pulses were then wavelet-transformed using DOG algorithm and the normal-ized power spectrum was estimated and plotted. The power spectrum was normalized to the maximum value because the information of the distance between the source of radiation and the point of observation was absent.
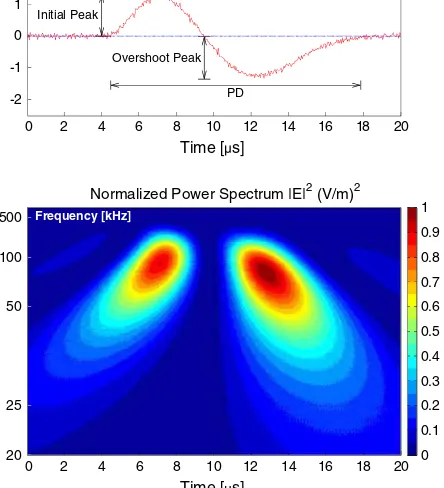
Fig. 2shows an example of the first electric field pulse in initial breakdown process of negative CG in time domain (top) and its corresponding normalized power spectrum in wavelet or time-frequency domain (bottom) for both initial and overshoot stages of the electric field pulse. The initial stage is basically the zero crossing time (ZCT) and the overshoot stage can be defined as the difference between the total pulse duration (PD) of the electric field pulse and the ZCT. The intensity level of the normalized power spectrum is plotted according to color coding contour. The vertical color bar on the right hand side of the bottom figure shows the scale for intensity level from 0 to 1. Dark-red color contour represents the highest intensity level while dark blue color represents the background noise. The spread region is bounded by the dark-red color contour while the spectral region is bounded by the light-blue color contour.
The statistical distributions of the spectral region, spread region, bandwidth, and ratio of power peak for both initial and overshoot stages are analyzed and discussed in this section. These parameters except the ‘bandwidth’ were introduced and utilized byMiranda (2008)and Sharma et al. (2011)in their analyses. We introduce the‘bandwidth’
parameter in order to compare the frequency spread of the
spectral and spread regions between all four types of flashes (−CG, IC, +CG, and IB). Bandwidth of spectral and spread
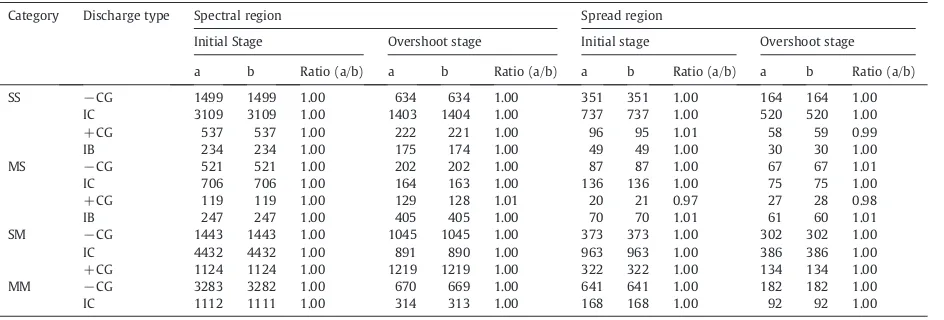
regions in wavelet domain can be estimated from two different approaches; (i) BW is defined as the difference between the average of maximum frequency of the spectral (or spread) and the average of minimum frequency, and (ii) BW is estimated from the bandwidth distribution. Both approaches resulted to almost the same bandwidth values as evidence inTable 2. For example, the maximum frequency of the spectral region inFig. 2is about 200 kHz during initial stage and slightly lower during overshoot stage at about 150 kHz. On the other hand, the minimum frequency of the spectral region is about 40 kHz during initial stage and 30 kHz during overshoot stage. Therefore, the BW of spectral region inFig. 2is estimated about 160 kHz and 120 kHz for initial and overshoot stages, respectively. The definitions and detail explanations of all parameters are given inTable 1.
3.1. Temporal-wavelet categorical composition
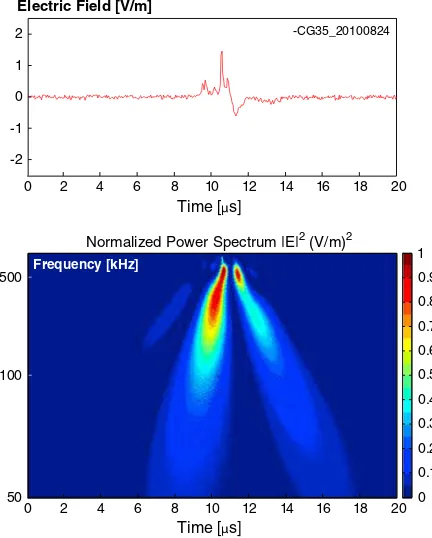
We found that the first electric field pulses of the ini-tial breakdown processes have two distinctive structures: (1) smooth single peak structure (an example from IB flash in Fig. 2) and (2) multiple peaks structure with small unipolar structure superimposed on the initial stage of the pulse (an example from negative CG is shown in Fig. 3). These structures are similar to the one observed byAhmad et al. (2010) and Sharma et al. (2011). Further, both pulse structures were found to compose (after wavelet transfor-mation) not just single (as observed bySharma et al., 2011) but multiple spread regions. Fig. 4 shows a single peak structure with the corresponding two spread regions at the initial stage. One spread region is centered at 500 kHz and the other one is centered between 60 and 70 kHz. Fig. 2
shows an example of single peak electric field pulse with the associated single spread region. On the other hand,Figs. 3 and 5show examples of multiple peaks electric field pulse category with the associated multiple and single spread regions, respectively. The definitions and explanations of each category are tabulated inTable 1.
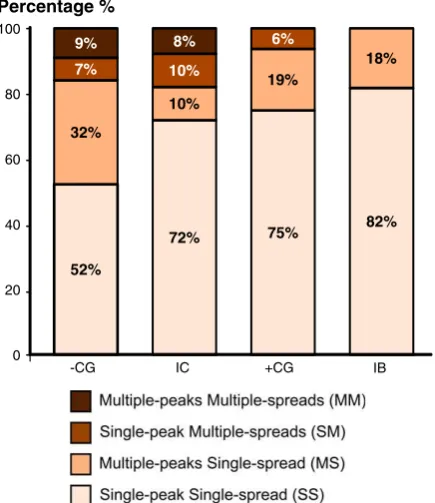
Fig. 6 shows the categorical composition of each flash group. Clearly from the figure, only negative CG and IC flashes compose all 4 categories while multiple-peak multiple-spread (MM) category is absent from positive CG flash and all multiple spread categories are absent from IB flash. This categorization method provides clear distinction between the group of IB and positive CG flashes and the group of negative CG and IC flashes as the latter group has all 4 categories. Also, clear distinction could be made between IB and positive CG. On the other hand, no clear distinction could be made between negative CG and IC in wavelet domain as both flashes have comparable amount of single spread category (84% in negative CG and 82% in IC) and almost the same amount of multiple spreads category (16% in negative CG and 18% in IC). However, in time domain, single peak could be differentiated from multiple peaks, just for the single spread category only. The IC flash consists higher number of Single-peak Single-spread (SS) category at 72% compared to negative CG flash at 52% while negative CG flash consists higher number of Multiple-peak Single-spread (MS) category at 32% compared to IC flash at 10%.
Frequency [kHz]
Normalized Power Spectrum |E|2 (V/m)2 Time [ s]
The single spread category of both single peak (SS) and multiple peaks (MS) is dominant among all lightning flashes where the smallest amount recorded from IC flash is at 82% and the largest amount recorded from IB flash is at 100%. IB flash has the largest amount of SS category at 82% and negative CG flash has the smallest amount of SS category at 52%. In contrast, negative CG flash has the largest amount of MS category with 32% compared to IC, IB and positive CG with 10, 18 and 19%, respectively. On the other hand, multiple spreads category of
both single peak (SM) and multiple peaks (MM) has the largest amount recorded from IC flash at 18%, small percentage when compared to their counterpart of single spread category (SS and MS).
3.2. Spectral and spread regions
Comparison between all four flash groups for all temporal-wavelet categories is shown in Figs. 7 and 8 for spectral
Table 1
Definitions and explanations of important wavelet parameters and categories.
Parameter/category Definition Remarks
Spectral region Region where predominant energy radiate. Color bar value of 0.3 and above and is bounded by the light-blue color contour.
Spread region Part of spectral region, which is the most intense energy radiation.
Color bar value of 0.9 and above and is bounded by the dark-red color contour.
Bandwidth Difference between average maximum frequency and average minimum frequency.
Spectral region and spread region are bounded by lower bound (minimum) frequency and upper bound (maximum) frequency.
Ratio of power peak Ratio of power peak of initial stage corresponds to overshoot stage power peak.
Peak values are the normalized values.
*Single-peak Single-spread (SS) Pulse with single peak (in time domain) with single spread region (in wavelet domain).
Illustrated byFig. 2.
*Single-peak Multiple-spread (SM) Pulse with single peak (in time domain) with multiple spread regions (in wavelet domain).
Illustrated byFig. 4.
*Multiple-peak Single-spread (MS) Pulse with multiple peaks (in time domain) with single spread region (in wavelet domain).
Illustrated byFig. 5.
*Multiple-peak Multiple-spread (MM) Pulse with multiple peaks (in time domain) with multiple spread regions (wavelet domain).
Illustrated byFig. 3.
Note: The asterisk (*) indicates SS, MS, SM and MM are correspond to wavelet categories
1
Normalized Power Spectrum |E|2 (V/m)2
Fig. 3.Wavelet power spectrum of the first pulse for negative CG (−CG)
with multiple peaks and multiple spreads (−CG with trace no. 35 taken on
24th of August 2010).
0 2 4 6 8 10 12 14 16 18 20 0 2 4 6 8 10 12 14 16 18 20
Time [ s]
Time [ s]
Normalized Power Spectrum |E|2 (V/m)2 Electric Field [V/m]
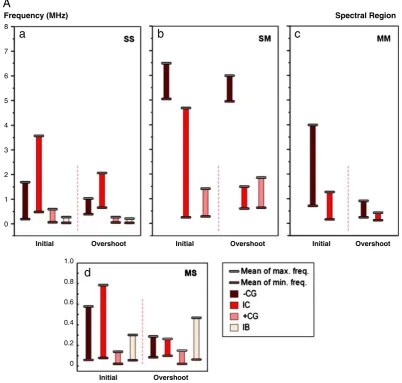
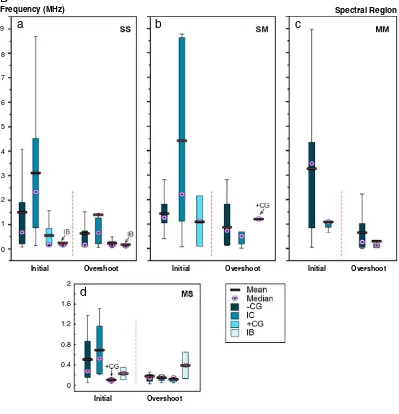
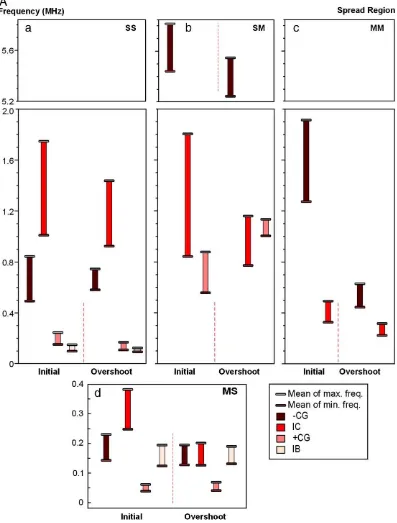
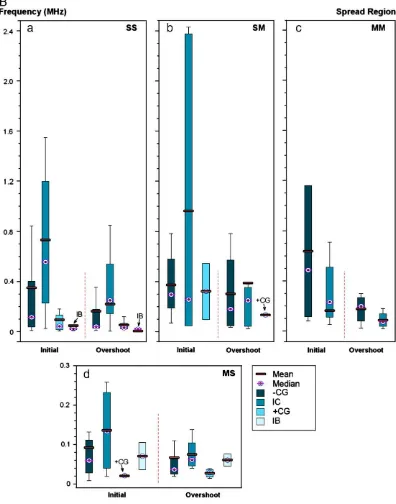
region and spread region, respectively.Figs. 7A and 8Ashow the estimated bandwidth of spectral and spread region by using approach (i). Figs. 7B and 8B show the distribution of bandwidth using box plots defined using approach (ii). The perfect agreement between approaches (i) and (ii) is evidenced inTable 2. For both spectral and spread regions, positive CG and IB flashes seem to radiate predominantly at lower frequencies when compared to negative CG and IC flashes especially in SS and MS categories. IC flash seems to have higher BW than negative CG in SS, MS and SM categories with the factor of 3 as shown inFig. 7A. However, in MM category, negative CG gains at least 3 times higher BW than IC flash. This is because IC flash frequencies are distributed across a wider range between 100 kHz and 9 MHz for spectral region in SS, SM and MS categories as illustrated in
Fig. 7B and negative CG bandwidth is distributed within the same frequency range in MM category. The same pattern has been observed in spread region as shown inFigs. 8A and 8B but with smaller frequency range (between 20 Hz and 2.4 MHz).
In SM category, the radiation frequency of positive CG was lower than negative CG and IC flashes during initial stage but comparable to the spectral and spread regions of IC flash particularly during overshoot stage. In general, we could observe high degree of distinction between the group of positive CG and IB flashes and the group of negative CG and IC flashes from the analysis of spectral and spread regions as we have been observed from temporal-wavelet categoriza-tion. Moreover, single peak pulses of each flash (SS and SM) were observed to radiate predominantly at higher frequen-cies compared to the multiple peak pulses (MS and MM).
In negative CG flash, the SS category is observed to radiate at higher frequencies than MS category. The largest value of the average maximum (upper bound) frequency of SS category during initial stage is estimated at 1694 kHz, higher by a factor of 3 compared to the largest value of MS category at 579 kHz. Also, similar pattern can be seen during the overshoot stage as shown in bothFigs. 7 and 8. Further, the same pattern could be observed from multiple spreads category (between SM and MM) for both initial and overshoot stages. The largest value of the average maximum (upper bound) frequency of SM category during initial stage is estimated at 6512 kHz, higher by a factor of 1.6 compared to the largest value of MS category at 4021 kHz.
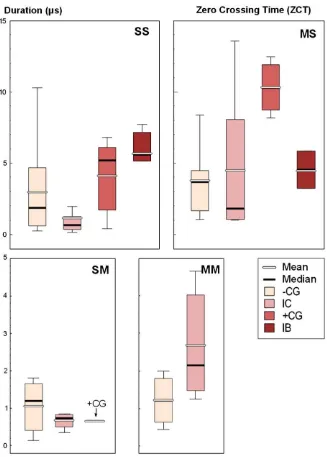
From time domain perspective, this observation would suggest that ZCT and PD of the single peak pulses are much shorter than multiple peaks pulses.Figs. 9 and 10provide the statistical distributions of ZCT and PD for all categories. Clearly we can see that the average ZCT of SS category is much shorter than the MS category, 2.98 ± 2.76μs compared to
3.78 ± 2.83μs, respectively. Moreover, the average PD of SS
category is much shorter than MS category, 6.72 ± 6.14μs
compared to 10.29 ± 5.82μs, respectively. Furthermore,Ahmad et al. (2010)have discovered that the average PD of the single peak pulses is much shorter than multiple peaks pulses, 2.33 ± 3.48μs compared to 16.3μs, which reflects very well
with our observation in wavelet domain.
By comparing between negative CG and IC flashes, we found that the first electric field pulses of IC flash were tending to radiate at higher frequency in both single spread categories (SS and MS). The largest value of the average maximum (upper bound) frequency of IC flash was estimated at 3570 kHz compared to negative CG at 1694 kHz during initial stage of SS
Electric Field [V/m]
Normalized Power Spectrum |E|2 (V/m)2
Fig. 5.Wavelet power spectrum of the first pulse for positive CG (+CG) with multiple peaks and single spread (+CG with trace no. 2 taken on 28th of August 2010).
category, higher by a factor of 2.1. Also, similar pattern can be seen during the overshoot stage as shown in bothFigs. 7 and 8. From time domain perspective, this observation would suggest that ZCT and PD of the single peak pulses of IC flash are much shorter than the negative CG flash.Fig. 9shows that the average ZCT of SS category for IC flash is much shorter than the−CG flash, 1.16 ± 1.55μs compared to 2.98 ± 2.76μs,
respectively. Moreover, the average PD of IC flash is much shorter than negative CG flash for SS category with 2.99 ± 4.35μs compared to 6.72 ± 6.14μs, respectively and for MS
category with 8.49 ± 9.75μs compared to 10.29 ± 5.82μs.
The comparison of temporal characteristics between negative CG and IC flashes reflects very well with our observation in wavelet domain.
By comparing between positive CG and IB flashes, we found that positive CG flash radiated predominantly at higher frequency in SS category for both initial and overshoot stages when compared to IB flash. The largest value of the positive CG average maximum (upper bound) frequency was estimated
at 599 kHz compared to IB at 218 kHz, higher by a factor of 2.8. This observation would suggest that ZCT and PD of the single peak pulses of positive CG flash are much shorter than the IB flash. The temporal characteristics of positive CG and IB flashes inFigs. 9 and 10confirm the wavelet observation.
On the other hand, we found that IB flash radiated pre-dominantly at higher frequency in MS category for both initial and overshoot stages when compared to positive CG flash. The largest value of the IB average maximum (upper bound) frequency was estimated at 283 kHz com-pared to +CG at 139 kHz, higher by a factor of 2.0. Once again, the temporal characteristics of positive CG and IB flashes tabulated inFigs. 9 and 10confirm our wavelet observation. Clearly, both temporal and wavelet observations suggest that initiation mechanism of the breakdown process in IB flash is a unique event and distinctive from positive CG. Further, the initiation mechanism of the breakdown process for both IB and positive CG flashes is definitely distinctive from both negative CG and IC flashes.
Frequency (MHz)
Initial Overshoot 1.0
0.8
0.6
0.4
0.2
0
Initial Overshoot Initial Overshoot Initial Overshoot 0
1 2 3 4 5 6 7 8
Spectral Region
a
b
d
c
A
3.3. Bandwidth and ratio of power peaks
In general, negative CG and IC flashes are observed to have larger bandwidth than positive CG and IB as shown in
Figs. 7 and 8and tabulated values inTable 2. In particular, there are two exception cases when the bandwidths of the positive CG and IB flashes are slightly larger than negative CG and IC flashes during overshoot stage. The positive CG flash has larger bandwidth than negative CG and IC flashes in SM category by a ratio of 1.2 and 1.4, respectively. The IB flash has larger bandwidth than negative CG and IC flashes in MS category by a ratio of 1.1 and 1.3, respectively.
However, these ratios are relatively small and occurred during overshoot stage, thus making the exception cases in-significant. For example, the ratios between the largest band-width of negative CG and the largest bandband-width of positive CG and IB flashes are 2.7 and 13.9, respectively. Moreover, the
ratios between the largest bandwidth of IC and the largest bandwidth of positive CG and IB are 3.6 and 18.8, respectively. Therefore in general, we could say that the bandwidths of negative CG and IC are always larger than the bandwidths of positive CG and IB.
Significant distinction could be observed between negative CG and IC flashes as shown inFigs. 7 and 8. The bandwidth of IC flash is significantly larger than negative CG in SS category while the bandwidth of negative CG is significantly larger than IC in MM category, for both initial and overshoot stages. How-ever, in SM and MS categories, IC flash has larger bandwidth when compared to negative CG only during initial stage, while the bandwidth of negative CG is larger during overshoot stage. Furthermore, significant distinction could be observed between positive CG and IB flashes. We found that the single peaks pulses of positive CG tend to radiate energy with larger bandwidth when compared to the single peak pulses of IB flash. In contrast,
Frequency (MHz) Spectral Region
9
8
7
6
5
4
3
2
1
0
Initial Overshoot Initial Overshoot
Initial Overshoot
Initial Overshoot
2
1.6
1.2
0.8
0.4
0
a
b
d
c
B
the multiple peaks pulses of positive CG tend to radiate energy with smaller bandwidth when compared to the multiple peaks pulses of IB flash.
Fig. 11shows the ratio of power peak of initial stage to overshoot stage. The IC flash always has the highest average ratio while positive CG has the lowest average ratio in all
categories. Moreover, both IC and negative CG flashes are observed to have higher ratios compared to the positive CG and IB flashes in all categories. The average ratio value of negative CG flash for SS category is comparable to the ratio value obtained bySharma et al. (2011)at about 1.8 for both SS and MS categories.
3.4. Discussions
In the light of recent optical radiation and electric field studies, the time rate of change of the velocity during the initial stage (typeβstepped leader in negative CG) is much faster than the later stage as evidenced from Fig. 2 inCampos and Saba (2013). In the initial stage, the velocity has dropped drastically from 1.2 × 10⁶m s−1 to 6 × 10⁵m s−1 along
the 800 m leader channel in just 1 ms while in the later
stage the velocity kept fluctuated between 2 × 10⁵m s−1and
6 × 10⁵m s−1along the 4000 m leader channel in 14.5 ms.
Further evidence from Table 3 in Stolzenburg et al. (2013)
shows that the velocity of the first leader channel (corresponds to the first electric field pulse) is much higher than the subsequent leader channel extension. The average velocity of the first leader channel is estimated at 1.09 × 10⁶m s−1, much
higher than the average velocity of the second leader channel extension at 7.8 × 10⁵m s−1.
These observations suggest that acceleration of the elec-trons in the initial stage is much faster than the later stage, most likely due to very rapid and extensive ionization process in the vicinity of the leader tip during the initial stage.
Schonland (1938) suggested that the rapid and extensive ionization produced by electrons in the tip of the leader alone is sufficient to reach such acceleration andClarence and Malan (1957) proposed that the presence of large magnitude ofp
region near the cloud base facilitates further the rapid ionization process in the leader tip. However as argued by
Gurevich and Karashtin (2013)based on data of in-situ electric field measurements in thunderclouds, the ionization process produced by electrons in the tip of the leader alone and facilitated by high background field (due to presence of large magnitude ofpregion) could not reach such acceleration level. Further, they argued that the resultant electric field from the ionization produced by electrons in tip leader alone is not high enough to surpass the required critical field value for breakdown to occur. The suggestion byGurevich and Karashtin (2013)that such very rapid and extensive ionization, which implied the presence of free ions region in the vicinity of the leader tip (due to the charge reset from hydrometeors) does appear to be valid. Although they inferred that this localized free ions region facilitated runaway breakdown avalanche to occur, we argue that the localized free ions region alone with strongpregion would provide very high field in front of the leader's tip as evidence fromClarence and Malan (1957)observations.
Therefore, as faster acceleration implies more rapid and extensive ionization process during initial leader develop-ment, we infer that the radiation pulses of the initial stage emit more high frequency component than the radiation pulses of the later stage due to the faster leader propagation, in the presence of sufficient free ions region to facilitate the rapid and extensive ionization process of the leader devel-opment. Further, we infer also that the first electric field pulse radiates more high frequency component than the subsequent initial breakdown.
Ahmad et al. (2010)found that the average PD of multiple peaks pulses for IC flash was much shorter than negative CG flash, 1.37μs compared to 16.3μs, respectively, which also
reflects very well with our observation in wavelet domain. However, the average PD of SS category for IC and negative CG flashes is differed from our temporal and wavelet analyses. They found that the durations between IC and negative CG were almost similar (in Florida thunderstorms), 2.08 ± 1.6μs compared to 2.33 ± 3.48μs, respectively.
Based on this finding, Ahmad et al. (2010) hypothesized that the breakdown process of IC and negative CG flashes for the SS category could be initiated by the same rapid ioniza-tion process which takes place during the initiaioniza-tion process of both flashes in Florida thunderstorms. On the other hand, we observe that the average PD of IC flash is much shorter than negative CG flash during thunderstorms in Sweden, 2.99 ± 4.35 compared to 6.72 ± 6.14 respectively as shown inFig. 10. In order to discuss this observation, let us introduce three important assumptions:
(i) The first electric field pulse of negative CG flash was due to the current surge in the first negative leader propagat-ing downward caused by an impulsive breakdown event (discharge originated in between p and N regions). This assumption is made based on the fact that all negative CG breakdown pulses have the same polarity as the initial stage of the following first return stroke and based on the hypothesis made byStolzenburg et al. (2013).
(ii) The first electric field pulse of IC flash was due to the current surge in the first positive leader propagating down-ward (discharge originated in betweenPandNregions where
P region is the main positive charge center) or propagating upward (discharge originated in betweenpandNregions). This assumption is made due to the fact that all IC breakdown pulses have the opposite polarity to the negative CG breakdown pulses. (iii) The magnitude of the pregion is larger at higher latitudes as revealed byNag and Rakov (2009)andBaharudin et al. (2012). The reason for this phenomenon is most probably due to more intense positive corona at ground at higher latitudes, which lifted up by updraft during thunder-storm. Therefore, we assume that the magnitude ofpregion in Sweden is much larger than in Florida.
In the case when positive leader propagating upward (IC discharge originated in betweenpandNregions), the
Table 2
Bandwidth of spectral and spread regions using approach (i) and approach (ii).
Category Discharge type Spectral region Spread region
Initial Stage Overshoot stage Initial stage Overshoot stage
a b Ratio (a/b) a b Ratio (a/b) a b Ratio (a/b) a b Ratio (a/b)
SS −CG 1499 1499 1.00 634 634 1.00 351 351 1.00 164 164 1.00
IC 3109 3109 1.00 1403 1404 1.00 737 737 1.00 520 520 1.00
+CG 537 537 1.00 222 221 1.00 96 95 1.01 58 59 0.99
IC 4432 4432 1.00 891 890 1.00 963 963 1.00 386 386 1.00
+CG 1124 1124 1.00 1219 1219 1.00 322 322 1.00 134 134 1.00
MM −CG 3283 3282 1.00 670 669 1.00 641 641 1.00 182 182 1.00
IC 1112 1111 1.00 314 313 1.00 168 168 1.00 92 92 1.00
a—Approach (i): Bandwidth (BW) = Mean Max frequency−Mean Min frequency
velocity of the positive leader propagation is comparable to the negative leader propagation as both leaders under the in-fluence of the same background electric field strength and experience similar ionization process. As the magnitude ofp
region in Sweden is much larger than Florida, we infer that the velocities of both leaders in Sweden thunderstorms are supposed to be much larger than Florida thunderstorms. Therefore, depending on the strength of the background electric field between pand N regions (depending on the magnitude ofpregion), we infer that the first electric field pulse of IC flash radiates as much as high frequency com-ponent as the first electric field pulse of −CG flash and
consequently both first pulses should have similar PD and ZCT. This inference basically validates the hypothesis made by
Ahmad et al. (2010)and explains why they found the average
PD of SS category for IC and negative CG flashes were almost similar in Florida thunderstorm.
A closer look at the PD values of both IC and negative CG in Florida shows that their values are much smaller than the PD values of both IC and negative CG in Sweden. This observation suggests that the first pulses in Florida radiated more high frequency component than the first pulses in Sweden even though the background electric field between
pandNregions in Florida is much lower than Sweden. The local electric field in front of the leader tip must be enhanced significantly by the rapid and extensive ionization caused by the presence of localized free ions region due to the charge reset from hydrometeors. Therefore, we infer that under the influence of the same background electric field strength, the ionization processes during both negative and positive leader
development are more rapid and extensive with the presence of localized free ions region in the vicinity of leader tip, which leads to faster propagation of the leaders. Further, the results would suggest that the presence of large magnitude of p
region is not the main factor for the rapid and extensive ionization process to occur which leads to very fast leader propagation.
If we consider the fact that the total electric field between thepandNregions is not uniform and very localized (most probably due to the non-uniform distribution of the available free ions region), the velocity of the positive leader can be faster or slower from the negative leader and vice versa depending on the availability and strength of the free ions region. As evidenced from our wavelet analysis inFigs. 7 and 8, the first electric field pulses of IC flash radiated more high frequency component than the negative CG flash for SS and MS
categories suggesting that more rapid and extensive ionization processes have occurred during the positive leader develop-ment of the IC flash. On the other hand, the first electric field pulses of negative CG flash radiated more high frequency component than the IC flash for SM and MM categories suggesting that more rapid and extensive ionization process have occurred during the negative leader development of the negative CG flash. This finding may explainSchonland's (1938)
observation of much slower and less bright typeα leader
compared to more faster and very bright typeβleader.
In the case when positive leader is propagating down-ward (IC discharge originated betweenPandNregions), the background electric field betweenPandNregions is much higher than the background electric field betweenpandN
regions due to the fact that the magnitude ofpregion must be smaller thanPregion. We suggest that the positive leader
inPandNregions propagates downward much faster than the negative leader inpandNregions, suggesting that the ionization of the positive leader is much more rapid and extensive than the negative leader. Consequently, the first electric field pulses of IC flash radiate more high frequency component than the negative CG flash, as evidenced from our wavelet analysis inFigs. 7 and 8for SS and MS categories. On the other hand, if the total electric field in the vicinity of the negative leader tips is significantly enhanced by the presence of localized free ions region, extensive ionization will take place during the leader development and it is possible that the localized electric field exceeds the background electric field betweenPandNregions. In this case, the negative leader inpandNregions propagates downward much faster than the positive leader inPandNregions. Consequently, the first electric field pulses of negative CG flash radiate more high frequency component than the IC flash, as evidenced from our wavelet analysis inFigs. 7 and 8for SM and MM categories.
Based on the inferences that have been made so far, evidence from wavelet analysis inFigs. 7 and 8suggests that the ionization processes of both IB and positive CG flashes are much less extensive when compared to the more rapid and extensive ionization process in IC and negative CG flashes. This finding suggests that the presence of very large magnitude ofp
region (prerequisite for IB flash to occur) does not facilitate more rapid and extensive ionization during IB flash breakdown process. As evidenced previously, the ionization processes of both IC and negative CG flashes in Florida are more rapid and extensive (as we inferred due to the presence of very strong free ions region in the vicinity of leader tip), when compared to the IC and negative CG flashes in Sweden, even though the magnitude ofpregion in Sweden is much larger than in Florida.
In the case when the first electric field pulses of IB flash radiated more high frequency component than positive CG as
evidenced from category MS inFigs. 7 and 8, we suggest that high localized electric field was present in the vicinity of the negative leader tip (due to the availability of free ions region) but not so much high as can be seen in the case of negative CG and IC flashes. This high localized electric field superposition with high background electric field due to very large magni-tude ofpregion was much more larger than the total electric field in the vicinity of the positive leader in positive CG. Under such condition, the ionization process during the negative leader development was more rapid and extensive than the ionization process during the positive leader development.
On the other hand, in the case when the first electric field pulses of IB flash radiated less high frequency component than positive CG as evidenced from category SS inFigs. 7 and 8, the localized electric field is probably too low (due to the absence or very few of free ions region) and thus the total electric field needed to initiate breakdown was depending on the back-ground electric field alone (the strength ofpregion). Under such condition, the ionization process during the negative leader development was much less extensive than the ioniza-tion process during the positive leader development.
4. Conclusions
The analysis of spectral and spread regions reveals a high degree of distinction between the group of positive CG and IB flashes and the group of IC and negative CG flashes as we have observed from temporal-wavelet categorization study. In general, IC and negative CG flashes were observed to radiate energy predominantly at higher frequencies and having larger bandwidth compared to the positive CG and IB flashes in all temporal-wavelet categories. Moreover, IC and negative CG flashes were observed to have higher band-width ratios compared to the positive CG and IB flashes in all categories. Also, we found that the single peak pulses of all
flashes were observed to radiate energy at higher frequencies when compared to the multiple peaks pulses.
Evidence from our wavelet analysis and recent optical radiation and electric field data allow us to hypothesize that the ionization process during the initial leader development (coincide with the detection of the first electric field pulse) of at least three flashes (−CG, IC, and IB) in Sweden was
dictated directly by the existence and magnitude of localized free ions region and p region. We suggest that the initial leader development of both IC and negative CG flashes underwent more rapid and extensive ionization process when compared to the positive CG and IB flashes.
In specific comparison between negative CG and IC flashes, both temporal and wavelet analyses suggest that the first electric field pulses of IC flash radiated energy at higher frequency in both single spread categories (SS and MS) and radiated energy at lower frequency in both multiple spreads categories (SM and MM) when compared to the negative CG flash. This finding may explain the observation of much slower and less bright type α leader (ionization process not so
extensive) compared to more faster and very bright type β
leader (ionization process more rapid and extensive). In the case IC flash was originated somewhere betweenp
andNregions, the initiation mechanism of both negative CG and IC is believed to be the same and influenced largely by the presence and magnitude of localized free ions region. In the case IC flash was originated somewhere betweenPandN
regions, the initiation mechanism of negative CG and IC is believed to be distinct. The ionization process of the IC initial leader was dictated directly by much stronger background electric field. Furthermore, in both cases, the presence of large magnitude ofpregion is not the main factor for the rapid and extensive ionization process to occur as evidence from Florida thunderstorm.
As for positive CG and IB flashes, both temporal and wavelet observations suggest that initiation mechanism of the breakdown process in IB flash is believed to be distinctive from positive CG. In positive CG flash, the single peak pulses radiated energy at much higher frequency while the multiple peaks pulses radiated energy at much lower frequency when compared to IB flash. We discovered that the presence of very large magnitude of p region (prerequisite for IB flash to occur) does not facilitate more rapid and extensive ionization during IB flash breakdown process. Instead, the presence of small magnitude of localized free ions region facilitated the rapidity of the ionization process. We speculate that the magnitude of free ions region is believed to be very small when the magnitude ofpregion becomes abnormally large.
On the other hand, the initiation mechanism of positive CG was dictated directly by the background electric field betweenPregion and the ground, which is distinct from the initiation mechanism of the IB flash.
Acknowledgment
Research work of the first and second authors was funded and supported by the Ministry of Higher Education Malaysia. Participation of V. Cooray was funded by the fund from the B. John F. and Svea Andersson donation at Uppsala University.
References
Ahmad, N.A., Fernando, M., Baharudin, Z.A., Rahman, M., Cooray, V., Saleh, Z., Dwyer, J.R., Rassoul, H.K., 2010.The first electric field pulse of cloud and cloud-to-ground lightning discharges. J. Atmos. Sol. Terr. Phys. 72, 143–150.
Baharudin, Z.A., Ahmad, N.A., Fernando, M., Cooray, V., Makela, J.S., 2012. Comparative study on preliminary breakdown pulse trains observed in Johor, Malaysia and Florida USA. Atmos. Res. 117, 111–121.
Campos, L.Z.S., Saba, M.M.F., 2013. Visible channel development during the initial breakdown of a natural negative cloud-to-ground flash. Geophys. Res. Lett. 40, 1–6.http://dx.doi.org/10.1002/grl.50904.
Clarence, N.D., Malan, D.J., 1957. Preliminary discharge processes in lightning flashes to ground. Q. J. R. Meteorol. Soc. 83, 161–171. Gomes, C., Cooray, V., 2004. Radiation field pulses associated with the
initiation of positive cloud to ground lightning flashes. J. Atmos. Sol. Terr. Phys. 66, 1047–1055.
Gurevich, A.V., Karashtin, A.N., 2013. Runaway breakdown and hydrometeors in lightning initiation. Phys. Rev. Lett. 110, 185005.http://dx.doi.org/ 10.1103/PhysRevLett.110.185005.
Li, Q., Li, K., Chen, X., 2013.Research on lightning electromagnetic fields associated with first and subsequent return strokes based on Laplace wavelet. J. Atmos. Sol. Terr. Phys. 93, 1–10.
Miranda, F.J., 2008.Wavelet analysis of lightning return stroke. J. Atmos. Sol. Terr. Phys. 70, 140–1407.
Nag, A., Rakov, V.A., 2009.Electric field pulse trains occurring prior to the first stroke in negative cloud-to-ground lightning. IEEE Trans. Electromagn. Compat. 51 (1), 147–150.
Nag, A., DeCarlo, B.A., Rakov, V.A., 2009. Analysis of microsecond and submicrosecond scale electric field pulses produced by cloud and ground lightning discharges. Atmos. Res. 91, 316–325.
Schonland, B.F.J., 1938.Progressive lightning. IV. The discharge mechanism. Proc. R. Soc. Lond. A164, 132–150.
Schonland, B.F.J., 1956.The lightning discharge. In: Flügge, Marburg, S. (Eds.), Handbuch der Physik., 22. Springer-Verlag, New York, pp. 576–625.
Sharma, S.R., Cooray, V., Fernando, M., 2008.Isolated breakdown activity in Swedish lightning. J. Atmos. Sol. Terr. Phys. 70, 1213–1221.
Sharma, S.R., Cooray, V., Fernando, M., Miranda, F.J., 2011.Temporal features of different lightning events revealed from wavelet transform. J. Atmos. Sol. Terr. Phys. 73, 507–515.