A Network Model for Spare Parts Distribution
Based on Customer Segmentation and
Demand Characteristics
Sendy Gunawan
*, Catharina Badra Nawangpalupi
#, Carles Sitompul
+*
Graduate Program in Industrial Engineering Universitas Katolik Parahyangan, Bandung, Indonesia
Department of Industrial Engineering Universitas Katolik Parahyangan, Bandung, Indonesia
Department of Industrial Engineering Universitas Katolik Parahyangan, Bandung, Indonesia
Abstract
—
The development in science and technology, especially in the era of industrial globalization has triggered many companies to develop their potential capability in order to excel in the increasingly competitive competition. Basically, customers expect to acquire the exact products or services at the right time and at an acceptable price. This leads to the challenge that a company has to improve not only their product quality, but also their product supply chains. In many products, there are some needs for part replacement to maintain the product durability. Thus, managing parts (or in the automotive industry is called spare parts) is crucial for maintaining company sustainability. However, managing parts or supply chain management for spare parts is quite difficult because the demand pattern is fluctuating and difficult to predict. Company X is a main dealer for particular motorcycle spare parts which has a warehouse in Karawang, West Java, Indonesia. Company X does not manufacture spare parts, it only orders spare parts from manufacturer and delivers the customers’ order. Company X has approximately 300 regular customers whose locations spread over from one to another. There are problems faced by Company X in regard to its distribution process, especially in maintaining minimum delivery time. There is a relatively high delivery time (currently over 24 hours), resulting in delays in fulfillment of customers’ demand and decreasing customer satisfaction level. This paper focused on developing a network model for spare parts distribution based on customer segmentation and demand characteristics. According to the model, it is expected that the model will reduce delivery time and delivery cost in spare parts distribution of Company X.Key words – Supply Chain, Spare Parts, Distribution, Customer Segmentation, Demand Characteristics
I. INTRODUCTION
The development in science and technology, especially in the era of industrial globalization has triggered many companies to develop their potential capability in order to excel in the increasingly competitive competition. Basically,
customers expect to acquire the exact products or services at the right time and at an acceptable price. This leads to the challenge that a company has to improve not only their product quality, but also their product supply chains.
According to Simchi-Levi et al. [1], supply chain management is a set of approaches utilized to efficiently integrate suppliers, manufacturers, warehouses, and stores, so that merchandise is produced and distributed at the right quantities, to the right locations, and at the right time, in order to minimize system wide cost while satisfying service level requirements. Therefore, a good application of supply chain management in a company can have a large impact in the
company’s competitive advantage in the perception of
customers.
According to the Central Bureau of Statistics Indonesia [2], the number of vehicles in Indonesia has increased very significantly from year to year. In 2007, the number of vehicles in Indonesia was only about 54 million vehicles consisting of cars, buses, trucks, and motorcycles. However, in 2012 the number of vehicles in Indonesia had increased almost 180% to nearly 94 million vehicles.
The increasing number of vehicle has lead in increasing spare parts demand for the vehicle. Due to the highly prospective business opportunities, there are a lot of new competitors in spare parts industry which increase the competition in market. Therefore, companies in spare parts industry should be able to have competitive advantages beyond the others and maintain its existence in order to win the competition in market. According to Wagner et al. [3], firms with a well-aligned spare parts logistics strategy can add value for their customers beyond primary product benefits, hence this would build long-term customer loyalty and lead to high profit margin achievement.
usually fluctuating and difficult to predict. According to Wagner et al. [3], the fluctuations in customer demand for spare parts are influenced by several factors, such as intensity of product use, wear behaviour, failure rates, or type of maintenance.
Furthermore, as spare parts are important to the product performance, customers cannot perform their activities if there are vital damages in spare parts. If customers cannot obtained their desired spare parts quickly, they can switch to
competitor’s product which available in market. Wagner et al.
[3] argued that the fast delivery of spare parts to customers should be a priority because it can increased customer loyalty to the company. Therefore, the implementation of supply chain, especially the delivery to fulfil customer demand for spare parts should be done promptly and accurately so that the negative impacts and losses for customers can be minimized.
II. PROBLEM IDENTIFICATION
Company X is a main dealer for particular motorcycle spare parts which has a warehouse in Karawang, West Java, Indonesia. Company X does not manufacture spare parts, it only distributes spare parts from manufacturer and delivers to the customers based on their order. Company X has approximately 300 regular customers which locations spread over from one to another.
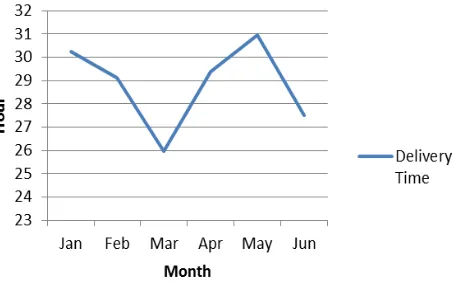
There are problems faced by Company X in regard to its distribution process, especially in maintaining minimum delivery time. There is a relatively high delivery time (currently over 24 hours), resulting in delays in the fulfillment
of customers’ demand and it reduces customer satisfaction level. Delivery time (in hours) is the required time from spare part order to the delivery. The historical data of delivery time Company X from January 2014 to June 2014 can be seen in Figure 1.
Fig. 1 Historical Data of Delivery Time Company X (January 2014-June 2014)
The delay in the fulfillment of customers’ demand occurs due to the lack of efficient and unbalanced separation of distribution channel, for example, there is imbalance level of utilization between vehicles: there are some over utilized vehicles and some underutilized vehicles. On the one hand, if
a vehicle carries too many orders to be delivered on the same day and fails to finish the delivery, it will increase the delivery time. On the other hand, the vehicles that have to deliver small number of orders will cause high unit delivery cost.
Besides that, another obstacles experienced by Company X was the high number of customers who has different characteristics related to the amount of spare parts they order, the variability of order frequencies, and the type of spare parts ordered. According to Freytag and Clarke [4], Kuo et al. [5], Kim et al. [6], Chu [7], the general approach can be used to categorise and manage the highly diverse customers is by applying the customer segmentation technique. By segmenting the customers, the company can easily classify and find out the similarities among customers based on their business goal and perspective.
According to Shahroudi et al. [8], in order to determine market segmentation, it is important to define the appropriate variables, so the result can suit the needs. Variables that are selected as the determining factors for the market segmentation can vary among companies depending on the purpose of the segmentation in each company. According to Godsell [9], the identification and the analysis of customer demand characteristics are required in segmenting the market. Customer demand characteristics can be used as a reference in determining the customer segmentation depending on the scope and characteristic of the company’s business.
This paper focuses on the development of a network model for spare parts distribution based on customer segmentation and demand characteristics to reduce delivery time and delivery cost.
III.RESEARCH SYNTHESIS
Research synthesis contained the information on similar studies which had been done before. The purpose of this research synthesis is to determine the position of this paper based on the previous researches. The research synthesis in this paper was created based on literature studies on demand classification, customer segmentation, distribution network/vehicle routing. The following sections will explain 17 research journals in demand classification (Table 1), 13 research journals in customer segmentation (Table 2), and 7 research journals on distribution network/vehicle routing (Table 3) which are used as references in the construction of research synthesis in this paper.
A. Demand Classification
There are many previous studies which discuss the demand classification. There are variety of variables selected to classify the demand. Gardner [10] had classified the demand based on demand volume. The study was conducted to evaluate the forecast performance in inventory system. Godsell [9], Kalchschmidt et al. [11], Christoper and Towill [12], Khairy et al. [13] added demand variability as a variable to classify the demand. Demand variability is used as a benchmark in order to determine the fluctuation of demand volume from one period to another.
price of an item that can be used in ABC classification. Boylan et al. [15], Bartezzaghi et al. [16] combined demand volume, demand variability, and demand order frequency to classify the demand. The addition of demand order frequency as a variable in classification process is done in order to determine the frequency of ordering goods in a given period. Moreover, Syntetos et al. [17], Fuller et al. [18] classified the demand based on demand volume, demand frequency, and value.
Wagner et al. [3], Portovi and Hopton [19] classified the demand based on demand volume, value, and criticality. The classification of demand, namely volume, variability, frequency, and value. Dudeja [21], Roda et al. [22] also classified demand by using four variables simlar to van Kampen et al. [20], but the frequency was replaced with the criticality.
In their research on spare parts demand classification, Rego and Mesquita [23] added current life cycle of parts as an additional variable. The addition of current life cycle was done in order to optimize spare parts inventory control process performed by a company. Driessen et al. [24] used demand volume, demand variability, demand order frequency, value, and criticality as variables for improvement of the planning and control of the spare parts.
Based on the literature studies on demand classification, especially for spare parts, it can be concluded that there are five main variables that can be used in the classification process, including demand volume, demand variability, demand order frequency, value, and criticality. However, the variable value is not used in this study as the main focus of this study is the customer service level in fulfilling customer demand for motorcycle spare parts. On the other hand, the demand packing size is used as an additional variable in classification process of spare parts demand in this study. The demand packing size indicates the size of a box or a packing size that is used to put spare parts into for the delivery process to customer.
TABLE I
RESEARCH SYNTHESIS ON DEMAND CLASSIFICATION
Characteristics
Variable Author(s) Year Title
Volume
(Quantity) Gardner, E.S. 1990
Evaluating Forecast
Marrying lean and agile paradigms
Volume - Value Stanford, R.E.,
& Martin, W. 2007
Towards a normative model for inventory cost management in control: a case study
Bartezzaghi, E., in a European spare parts logistics network Process As Applied to Two Types Inventory for control and agenda for future research
B. Customer Segmentation
in their research about fashion industry, conducted the customer segmentation based on the customer behavior or lifestyle.
Customer segmentation based on economic factors had been in the focus of Palsson and Kovacs [29], Li et al. [30], Boone and Roehm [31], and Chaturvedi et al. [32]. The amount of customer purchases (in money value) is an example of those characteristics. Hammond et al. [33] combine demographics factor and behavioral/lifestyle factor in order to do customer segmentation among product with brands that were categorized as competitive. Shahroudi et al [8] selected demographics, behavioral/lifestyle, and economic variable to create customer segmentation. Goyat [34], Kim and Lee [35], and Voorhees [36] used demographics, geographic, and behavioral/lifestyle factor in the process of customer segmentation.
Based on the study literatures on customer segmentation, it can be concluded that there are four segmentation variables which usually used in customer segmentation, such as geographic, demographics, behavioral/lifestyle, and economic. However, this study uses three variables for customer segmentation, such as geographic, behavioral/lifestyle, and economic instead. Demographics variable is not used in this study because it is irrelevant to the segmentation on spare parts customers.
TABLE II
RESEARCH SYNTHESIS ON CUSTOMER SEGMENTATION
Segmentation
Variable Author(s) Year Title
Demographic of retail chains: model development and the case of electrical and mechanical
Economic Palsson, H., &
Kovacs, G. 2013
Reducing transportation emissions: A reaction to stakeholder pressure or a strategy to increase and its application in customer
1996 Market segmentation
for competitive brands
The basis of market segmentation: a methods: A study of buyers of prestige
C. Distribution Network/Vehicle Routing
Constraints can be used as a reference or limitation factor in the design of distribution networks or vehicle routing problems. In general, most of companies only used distance as a constraint for planning a distribution or vehicle routing, as whats was done by Hearnshaw and Wilson [37]. However, Du and Yi [38] combined some constraints, such as distance or geographic location, number of vehicles, and delivery demand in their research. Giagis et al. [39] had also done some combination constraints consist of number of vehicles, vehicle capacity, and delivery demand to create a vehicle routing.
This study will use a combination of several constraints, including distance or geographic location, number of vehicles, vehicle capacity, delivery demand, and the level of emergency in distributing spare parts to customer. The selection of five constraints in this study is based on suitability in creating distribution network for motorcycle spare parts.
TABLE III
RESEARCH SYNTHESIS ON DISTRIBUTION NETWORK / VEHICLE ROUTING
Constraints Author(s) Year Title
Distance/Geographic
Hearnshaw, E.J.S, & Wilson, M.M.J.
2011
A complex network approach to supply chain network theory
Distance/Geographic - Number of Vehicle
- Delivery Demand
Du, M., & Yi,
H. 2013
Research on Multi-objective Emergency Logistics Vehicle Routing Problem under Constraint Conditions
Number of Vehicle - Vehicle Capacity -
Delivery Demand
Giaglis, G.M., Minis, I., Tatarakis, A., & Zeimpekis,
V.
2004
Minimizing logistics risk through real-time vehicle routing and mobile technologies
Distance/Geographic - Number of Vehicle - Vehicle Capacity - Delivery Demand
Jarrah, A.I., & Bard, J.F. 2011
Pickup and delivery network segmentation using contiguous geographic clustering
Fan, W., Xu,
H., & Xu, X. 2009
Simulation on vehicle routing problems in logistics distribution
Mitra, S. 2008
A parallel clustering technique for the vehicle routing problem with split deliveries and pickups
Vehicle Capacity - Delivery Demand - Level of Emergency
Hsueh, C.F., Chen, H.K., Chou, H.W.
2008
Dynamic Vehicle Routing for Relief Logistics in Natural Disasters
IV.RESEARCH MODEL
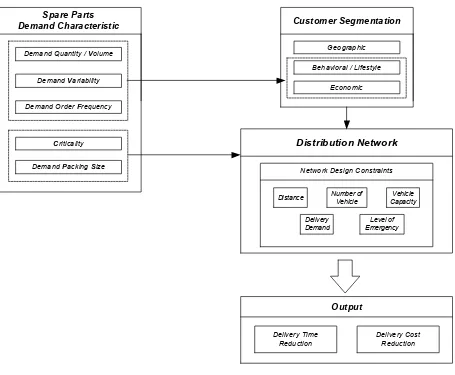
Based on the research synthesis which has been made, this paper focuses on the development of distribution network model for spare parts based on customer segmentation in order to reduce delivery lead time and delivery cost. The model developed in this paper is an integration of three concepts related to spare parts demand characteristics, customer segmentation, and distribution network design which the distribution centre location is known.
The initial stage of this research model starts from the classification of spare parts demand based on five characteristics: (1) demand quantity/volume, (2) demand variability, (3) demand order frequency, (4) criticality, and (5) demand packing size. Demand quantity/volume shows the amount of spare parts demand per unit in one month period. Demand variability shows the variability of spare parts demand per month. Demand order frequency indicates the frequency of customer order in one month period (not considering the demand quantity). Criticality indicates the
severity of spare parts performance in the case of product malfunction. Demand packing size shows the size of spare parts packing size which are ready to deliver to customers.
Customer segmentation model in this research considers three characteristics, such as geographic, behavioral/lifestyle, and economic factors. Geography means the location of customer. Behavior/lifestyle shows the characteristics properties or behavioral of orders made by customers. The economic variable in this customer segmentation shows the economic characteristics of customer, such as the amount of customer orders in dollars. For the distribution network design, there are five constraints used: (1) geographical factor/distance, (2) the number of vehicle used, (3) vehicle capacity, (4) the amount of spare parts to be delivered, and (5) the level of emergency (state how important order delivered as soon as possible or prioritized compared to the others).
The model formulation begins with identifying economic and behavioral/lifestyle factors in the customer segmentation based on spare parts demand characteristics (demand quantity/volume, demand variability, demand order frequency). Then, based on the geographical factors, customer segments are created. After the segments are formed, the remaining demand characteristics (i.e. criticality and demand packing size) are used as parameters for developing distribution network under five constraints that has been explained before.
The expected output from this research model is the reduction of delivery time and cost. Delivery time is the period of time required from spare parts orders which are ready to send until the customers receive the orders. The delivery cost is the cost the company spent to deliver spare parts orders to the customers. Delivery cost is considering several cost components, such as fixed costs (drivers’ salaries and vehicle maintenance costs) and variable cost (fuel cost).
The model developed will be implemented using an experimental design. The experimental design will have several scenarios which include three factors, for instance mode of transportation, number of customer segments, and packaging type.
Mode of transportation identifies the type of vehicle used to deliver the customer demands. Three alternatives of vehicle are truck, motorcycle, or the combination of truck and motorcycle. For the customer segmentation, this research will adopt a two-stage clustering method, combining hierarchical clustering (Ward Method) with non-hierarchical clustering (K-mean Algorithm). Ward method is used to determine the number of clusters based on the change of agglomeration which can be chosen subjectively by the researcher. Therefore, the number of customer segments will be included as one of the selection factor in this research in order to find out the best possible outcome for Company X.
transportation factor, for instance, there are some types of packaging that may not be suitable for motorcycle. The type of packaging is taken into consideration to create the appropriate and possible scenarios for spare parts delivery in Company X.
However, not all combination of levels in those three factors will be used to create scenarios in this research. As explained earlier, some scenarios may not be selected due to the suitability for spare parts distribution for Company X. An example scenario is a network model for the delivery that uses a combination of truck and motorcycle as the mode of transportation, based on three customer segments, and 50 types of packaging. Then the scenario will be solved using a heuristics method. The results of the model will then be tested statistically.
V.SUMMARY
This paper focused on developing a network model for spare parts distribution based on customer segmentation and demand characteristics. According to the model, it is expected that the model will reduce delivery lead time and delivery cost in spare parts distribution of Company X. Furthermore, the implementation of the model will use experimental design based on scenarios. As this paper is a preliminary study of a distribution problem, it is expected that the model will then be used for distribution problem in Company X and shows the improvement in their lead time and cost.
Spare Parts Demand Characteristic
Demand Quantity / Volume
Demand Variability
Demand Order Frequency
Criticality
Demand Packing Size
Customer Segmentation
Geographic
Behavioral / Lifestyle
Economic
Distribution Network
Network Design Constraints
Distance Number of Vehicle
Vehicle Capacity
Delivery Demand
Level of Emergency
Output
Delivery Time Reduction
Delivery Cost Reduction
Fig. 2 Research Model
(Network Model for Spare Parts Distribution Based on Customer Segmentation and Demand Characteristics)
REFERENCES
[1] Simchi-Levi, D., P. Kaminsky, and E. Simchi-Levi, Designing and Managing the Supply Chaini 3rd ed., McGraw-Hill: Boston, 2008. [2] http://www.bps.go.id/tab_sub/view.php?kat=1&tabel=1&daftar=1&id_su
byek=17¬ab=12
[3] Wagner, S.M., Jonke, R., and Eisingerich, A.B., ―A strategic framework
for spare parts logistics‖, California Management Review, vol. 54, no. 4, pp. 69-92, 2012.
[4] Freytag, P.V. and Clarke, A.H., ―Business to business market
[5] Kuo, R.J., Ho, L.M. and Hu, C.M., ―Integration of self-organizing feature map and K-means algorithm for market segmentation‖, Computers & Operations Research, Vol. 29 No. 11, pp. 1475-93, 2002.
[6] Kim, S.Y., Jung, T.S., Suh, E.H. and Hwang, H.S., ―Customer segmentation and strategy development based on customer lifetime value:
a case study‖, Expert Systems with Applications, Vol. 31 No. 1, pp. 101-7, 2006.
[7] Chu, C.C.H., ―Intelligent value-based customer segmentation method for
campaign management: a case study of automobile retailer‖, Expert Systems with Applications, Vol. 34 No. 4, pp. 2754-62, 2008.
[8] Shahroudi, K., Biabani, S., Zebardast, S., and Yazdani, A, ―Variable selection in clustering for market segmentation using genetic
algorithms‖, Interdisciplinary Journal of Contemporary Research in Business, Vol. 3 No. 6, pp.333-341, 2011.
[9] Godsell, J., Diefenbach, T., Clemmow, C., Towill, D., and Martin, C.,
―Enabling supply chain segmentation through demand
profiling‖, International Journal of Physical Distribution & Logistics Management, Vol. 41 No. 3, pp.296-314, 2011.
[10] Gardner, Everette S., Jr., ―Evaluating forecast performance in an
inventory control system‖, Management Science, Vol. 36 No. 4, pp.490, 1990.
[11] Kalchschmidt, M., Verganti, R., and Zotteri, G., ―Forecasting demand
from heterogeneous customers‖, International Journal of Operations & Production Management, Vol. 26 No. 6, pp.619-638, 2006.
[12] Christopher, M. and Towill, D.R., ―Marrying lean and agile paradigms‖,
Proceedings of EUROMA Conference 2000, Ghent, Belgium, pp. 114-21, 2000.
[13] Khairy A.H. Kobbacy, and Liang, Y., ―Towards the development of an
intelligent inventory management system‖, Integrated Manufacturing Systems, Vol. 10 No. 6, pp.354-366, 1999.
[14] Stanford, R. E., and Martin, W., ―Towards a normative model for inventory cost management in a generalized ABC classification
system‖, The Journal of the Operational Research Society, Vol. 58 No. 7, pp.922-928, 2007.
[15] Boylan, J. E., Syntetos, A. A., and Karakostas, G. C., ―Classification for
forecasting and stock control: A case study‖, The Journal of the Operational Research Society, Vol. 59 No. 4, pp.473-481, 2008. [16] Bartezzaghi, E., Verganti, R. and Zotteri, G., ―A simulation framework
for forecasting uncertain lumpy demand‖, International Journal of Production Economics, Vol. 59 Nos 1-3, pp. 499-510, 1999.
[17] Syntetos, A. A., Keyes, M., and Babai, M. Z., ―Demand categorisation in a european spare parts logistics network‖, International Journal of Operations & Production Management, Vol. 29 No. 3, pp.292-316, 2009.
[18] Fuller, J.B., Oconor, J. and Rawlinson, R., ―Tailored logistics – the next
advantage‖, Harvard Business Review, Vol. 71 No. 3, pp. 87-98, 1993. [19] Partovi, F. Y., and Hopton, W. E., ―The analytic hierarchy process as
applied to two types of inventory problems‖, Production and Inventory Management Journal, Vol. 35 No. 1, pp.13, 1994.
[20] van Kampen, T.,J., Akkerman, R., and van Donk, D. P., ―SKU classification: A literature review and conceptual
framework‖, International Journal of Operations & Production Management, Vol. 32 No. 7, pp.850-876, 2012.
[21] Dudeja, V. K., ―Forecasting and supply planning for spare parts‖, The
Journal of Business Forecasting, Vol. 33 No. 1,pp 23-24 & pp.26-28, 2014.
[22] Roda, I., Macchi, M., Fumagalli, L., and Viveros, P., "A review of multi-criteria classification of spare parts : From literature analysis to industrial evidences", Journal of Manufacturing Technology Management, Vol. 25 Iss: 4, pp.528 – 549, 2014.
[23] Rego, J.R.D., and Mesquita, M.A.D., ―Spare parts inventory control: a
literature review‖, Producao, Vol. 21 No. 4, pp.656-666, 2011. [24] Driessen, M.A., Arrts, J.J., Houtum, G.J.V., Rustenburg, W.D., and
Huisman, B., ―Maintenance spare parts planning and control: A
framework for control and agenda for future research‖, Beta Working Paper, pp.325, 2010.
[25] Trappey, C.V., Trappey, A.J.C., Chang, A.C, and Huang, A.Y.L., "Clustering analysis prioritization of automobile logistics services", Industrial Management & Data Systems, Vol. 110 Iss: 5, pp.731 – 743, 2010.
[26] Tsai, M., Chun-Hua Liao, and Chia-shing Han., ―Risk perception on logistics outsourcing of retail chains: Model development and empirical
verification in taiwan‖, Supply Chain Management, Vol. 13 No. 6, pp.415-424, 2008.
[27] Merrilees, B., Bentley, R., and Cameron, R., ―Business service market segmentation: The case of electrical and mechanical building
maintenance services‖, The Journal of Business & Industrial Marketing, Vol. 14 No. 2, pp.151-164, 1999.
[28] Ko, E., Kim, E., Taylor, C. R., Kim, K. H., and Ie, J. K., ―Cross-national
market segmentation in the fashion industry‖, International Marketing Review, Vol. 24 No. 5, pp.629-651, 2007.
[29] Palsson, H., and Kovacs, G., "Reducing transportation emissions : A reaction to stakeholder pressure or a strategy to increase competitive advantage", International Journal of Physical Distribution & Logistics Management, Vol. 44 Iss: 4, pp.283 – 304, 2014.
[30] Li, J., Wang, K., and Xu, L., ―Chameleon based on clustering feature
tree and its application in customer segmentation‖, Annals of Operations Research, Vol. 168 No. 1,pp. 225-245, 2009.
[31] Boone, D. S., and Roehm, M., ―Evaluating the appropriateness of market segmentation solutions using artificial neural networks and the
membership clustering criterion‖, Marketing Letters, Vol. 13 No. 4, pp.317, 2002.
[32] Chaturvedi, A., Carroll, J. D., Green, P. E., and Rotondo, J. A., ―A feature-based approach to market segmentation via overlapping
K-centroids clustering‖, JMR, Journal of Marketing Research, Vol. 34 No. 3, pp.370-377, 1997.
[33] Hammond, K., Ehrenberg, A. S. C., and Goodhardt, G. J., ―Market
segmentation for competitive brands‖, European Journal of Marketing, Vol. 30 No. 12, pp.39-49, 1996.
[34] Goyat, S., ―The basis of market segmentation: a critical review of
literature‖, European Journal of Business and Management, Vol. 3 No. 9, pp.45-54, 2011.
[35] Kim, T., and Lee, H.Y., ―External validity of market segmentation
methods‖, European Journal of Marketing, c, pp.153-169, 2011. [36] Voorhees, C. M., A customer equity-based segmentation of service
consumers: An application of multicriterion clusterwise regression for joint segmentation settings. (Order No. 3232457, The Florida State University). ProQuest Dissertations and Theses, 220-220 p, 2006. [37] Hearnshaw, E.J.S, and Wilson, M.M.J., "A complex network approach
to supply chain network theory", International Journal of Operations & Production Management, Vol. 33 Iss: 4, pp.442 – 469, 2013.
[38] Du, M., and Yi, H., ―Research on multi-objective emergency logistics
vehicle routing problem under constraint conditions‖, Journal of Industrial Engineering and Management, Vol. 6 No. 1, pp.258-n/a, 2013. [39] Giaglis, G. M., Minis, I., Tatarakis, A., and Zeimpekis, V., ―Minimizing logistics risk through real-time vehicle routing and mobile technologies:
Research to date and future trends‖, International Journal of Physical Distribution & Logistics Management, Vol. 34 No. 9, pp.749-764, 2004. [40] Jarrah, A. I., and Bard, J. F., ―Pickup and delivery network segmentation
using contiguous geographic clustering‖, The Journal of the Operational Research Society, Vol. 62 No. 10, pp.1827-1843, 2011.
[41] Fan, W., Xu, H., and Xu, X., ―Simulation on vehicle routing problems in
logistics distribution‖, Compel, Vol.28 No. 6, pp.1516-1531, 2009. [42] Mitra, S., ―A parallel clustering technique for the vehicle routing
problem with split deliveries and pickups‖, The Journal of the Operational Research Society, Vol. 59 No. 11, pp.1532-1546, 2008. [43] Hsueh, C.F., Chen, H.K., and Chou, H.W., ―Dynamic Vehicle Routing
for Relief Logistics in Natural Disasters‖, Vehicle Routing Problem,