DOI: 10.12928/TELKOMNIKA.v12i2.1603 465
Early Model of Student's Graduation Prediction
Based on Neural Network
Budi Rahmani*1, Hugo Aprilianto2 Program Studi Teknik Informatika, STMIK Banjarbaru Jl. Jend. Ahmad Yani Km. 33,5 Loktabat Banjarbaru, 05113251836
*Corresponding author, e-mail: [email protected], [email protected]
Abstract
Predicting timing of student graduation would be a valuable input for the management of a Department at a University. However, this is a difficult task if it is done manually. With the help of learning on the existing Artificial Neural Networks, it is possible to provide training with a certain configuration, in which based on experience of previous graduate data, it would be possible to predict the time grouping of a student’s graduation. The input of the system is the performance index of the first, second, and third semester. Based on testing performed on 166 data, the Artificial Neural Networks that have been built were able to predict with up to 99.9% accuracy.
Keywords: prediction, time of graduation, Artificial Neural Network, Back-propagation
1. Introduction
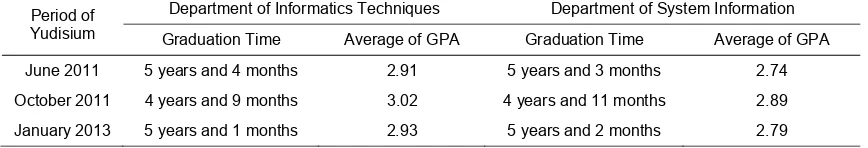
STMIK Banjarbaru is one of many universities endeavouring to raise its accreditation status, in which one of its components is the period of study for students [1]. Table 1 shows the Student Graduation Level Data at the Fourth Graduation in 2012.
Table 1. STMIK Banjarbaru Student Graduation Level Data at the Fourth Graduation in 2012
Period of Yudisium
Department of Informatics Techniques Department of System Information
Graduation Time Average of GPA Graduation Time Average of GPA
June 2011 5 years and 4 months 2.91 5 years and 3 months 2.74
October 2011 4 years and 9 months 3.02 4 years and 11 months 2.89
January 2013 5 years and 1 months 2.93 5 years and 2 months 2.79
In another research the GPA (Grade Point Average), the number of courses taken, the number of repeated courses and the number of certain courses taken can affect the duration period of study [2]. This was similarly stated in another research using regression trees, in which it was ascertained that the variables that can be used to differentiate the length of a student study period are the GPA, the duration of completing a mini-thesis and the faculty [3].
Based on the facts above, especially for STMIK Banjarbaru, in order to predict the period of study of a student, one can use the GPA data obtained from a person during the initial period of study (semester 1-3). This of course depends on the expectation that the academics at STMIK Banjarbaru have implemented preventive measures to avoid surpassing the ideal nine semester study period or the maximum of 3.5 years, in order for the graduation status to improve, besides increasing the point/grade, which is also one of the criteria for evaluating accreditation.
information. The basic element of the aforementioned paradigm is a new structure of the information processing system. The Artificial Neural Network, like a human, learns from an example. The Artificial Neural Network was formed to solve certain problems such as recognition of patterns or classification due to the learning process. The Artificial Neural Network has developed rapidly in the past few years [4]. The enormous interest in Artificial Neural Networks that recently occurred was due to several factors. First, the pattern of training which was developed to become a smarter network model that could solve problems. Second, digital computers with high speeds have made network process simulation easier to do. Third, today's technology provides specific hardware for neural networks. At the same time the development of traditional computing has made Artificial Neural Networks learning easier, the limitations faced by traditional computers have motivated several directions of research on Artificial Neural Networks [5].
The network used to predict the duration of study period is the backpropagation Artificial Neural Network. This network has several layers, namely the input layer, output layer and several hidden layers. These hidden layers assist the network to recognize more input patterns compared to networks that do not have hidden layers [6],[7].
The backpropagation training process requires three stages, namely the feedforward data input for training, backpropagation for error values, and adjustment for the weight value of each node of individual layers. Beginning with the feedforward input value, each first input unit (xi) receives an input signal which will be subsequently transmitted to the hidden layer Z1,....,Zp. The j hidden unit will then calculate the signal (Zj) value, which will be transmitted to the output layer, using the f activation function.
∑
And
where = hidden bias of the j unit. The bias value and initial weight can be taken randomly. Each unit of output
∑ and
where = hidden bias of the k unit. Throughout the duration of the training process, each output unit compares the target value (Tm) for an input pattern to calculate the parameter value which will correct (update) the weight value of each unit in the individual layers.
The process of training the backpropagation algorithm has an activation function that must have the following characteristics, namely continuously, differentiable, and monotonically decreasing. One of the most used functions is the sigmoid function that has a range of 0 to 1 [6] [7] [8].
2. Research Method
2.1. Use case diagram dan Sequence Diagram
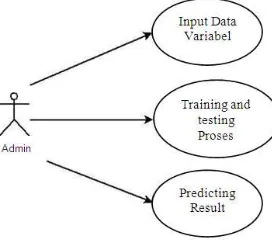
If figured in the form of a usecase diagram, the tools to be built are as follows:
Figure 1. Usecase diagram
From the Figure above one can see that there are three cases that can be done by the system, namely receive the input from the grade point variable, training and testing process by the JST backpropagation, and lastly, is the prediction result that is given [4]. To be more detailed, what is done by the system can be figured in the diagram sequence as follows:
Figure 2. Sequence diagram
2.2. Determination of data for training and testing
Table 2. Judisium Data of June 2011 of the Department of Informatics Techniques. (Judisium is date of decision to graduate a student)
No. Name Student number GPA Graduation time
1 Nur Imansyah 310104020134 2.65 6 Years 11 Months
2 Gusti Indra Muliawan 310105020310 2.58 5 Years 11 Months
3 Roby Roosady 310105020320 2.44 5 Years 8 Months
4 Nina Herlina 310106020415 3.14 4 Years 11 Months
5 Ridha Faisal 310106020435 3.03 4 Years 11 Months
6 Himalini Alpiyana 310106020447 3.14 4 Years 11 Months
7 M. Freddy Pratama Putra 310106020464 3.07 4 Years 9 Months
8 Lagairi 310106020500 2.83 4 Years 10 Months
9 Asbihannor 310106020512 3.05 4 Years 11 Months
10 Mawardi 310106020524 3.18 4 Years 10 Months
Average 2.91 5 Years 4 Months
2.3. Recapitulation of data that will be processed using the Matlab 2011b.
The data to be processed is grouped into six durations of study period groups, namely:
a. ≥ 3,5 years (group 1) b. ≥ 4 years (group 2) c. ≥ 4,5 years (group 3) d. ≥ 5 years (group 4) e. ≥ 6 years (group 5) and f. > 7 years (group 6)
The recapitulation of data grouping shown in the following separate table of this paper.
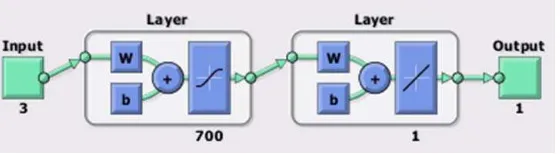
2.4. Designing the Artificial Neural Network (Neural Network)
The following Figure shows how the NN structure will be built with 3 inputs with 700 layers, and a hidden layer, as well as an output. The JST was built using the NN Toolbox Matlab 2011b.
Figure 3. NN Design (NN Toolbox)
In order to conduct training on the data, adjustments to parameters are required, namely as follows: the number of epoch is 10,000, with a target error to the sum of 1e-5.Thus on the Matlab, several of the aforementioned settings are as according to the following pseudo-codes.
The following command can be used to conduct training:
[net,tr]=train(net,input,target);
Afterwards the post training workspace can be saved with the following name:
konfig_gabung_all.mat
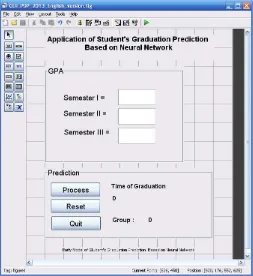
2.5. GUI Design
The following is a GUI to assist in testing and also used as a tool to make predictions of student graduation timing based on GPA on first, second and third semesters.
Figure 4. GUI Design
There are two tabs created for this design. The first tab is named Grade Point Average, where there are three parts that would later have to be filled in with semester grade point values of a student whose graduation is to be predicted. Such filling in must be in numeric form of between 0 through 4, cannot be filled in with letters and if in decimal form, the numbers have to be separated with a dot sign not a comma. If these matters are violated, an error message on the design will appear with the followingscript:
if isnan(IPSem_3) set(hObject, 'String', 0);
errordlg('Input Input Must Be Numeric 0 through 4 or use the dot sign as a replacement for commas','Error'); end
if (IPSem_3 > 4) set(hObject, 'String', 0);
The second tab is named prediction and on it there are, among others, the following buttons: Process, Reset and Exit, including prediction result writing, and also prediction grouping from six groups that were designed. An error message is designed with the following script if the system cannot make a prediction during the prediction process (the ‘Process’ button is pressed):
if (hasil < 0.7)
set(handles.text13, 'STRING', '0');
set(handles.text14, 'STRING', System cannot make a prediction'); end
The ‘Reset’ button in this section is used to reset the filled in information and prediction result that was done earlier in order to conduct the prediction process on new data. If this reset button is pressed, all grade point semester data will be set as 0 as well as all prediction results and prediction groups. Whereas the ‘Exit’ button isused to exit from the application (GUI) and close the opened GUI window.
2.6. System testing
There are two ways to do this testing. The first is to automatically conduct testing against all data via a program with the following command:sim(net_gabung,input);
Result data can later be seen in the ‘ans’ variable on the work space, if this variable is clicked later on, it will display the numeric result of the prediction in its entirety from data that was tested.The second way is to take advantage of the GUI that has already been made and test the existing available data one by one. The result of both ways will be filled in to the table already made available (recapitulation table of data to be tested).
3. Results and Analysis
3.1. Neural Network Training Result
The following is the result of training conducted against 166 input data on the Neural Network that was created using NNTool on Matlab. The following is the input and target data:
target_all=[1 1 1 1 1 1 1 1 1 1 1 2 2 2 2 2 2 2 2 3 3 3 3 3 3 3 3 3 3 3 3 3 3 3 3 3 3 3 3 3 3 3 3 3 3 3 3 3 3 3 3 3 3 3 3 3 3 3 3 3 3 3 3 3 3 3 3 3 3 3 3 3 3 3 3 3 3 3 3 3 3 3 3 3 4 4 4 4 4 4 4 4 4 4 4 4 4 4 4 4 4 4 4 4 4 4 4 4 4 4 4 4 4 4 4 4 4 4 4 4 4 4 4 4 4 4 4 4 4 4 4 4 4 4 4 4 4 4 4 4 4 4 4 4 4 4 4 4 5 5 5 5 5 5 5 5 5 5 5 6 6 6 6 6 6 6];
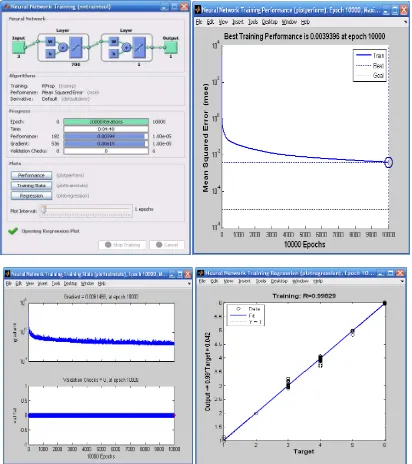
The training result display is:
Figure 5. Neural Network Training State
In the figure above, the training Neural Network result is shown with 10000 epoch with the best performance grade to the sum of 0.0039396. Whereas the prediction output value
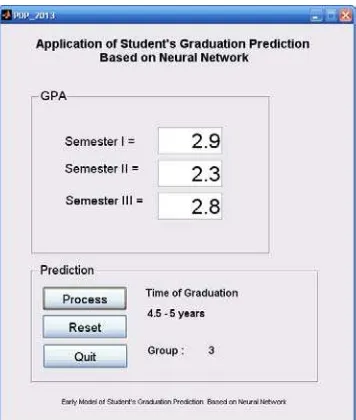
3.2. GUI Design Result
The following figure shows the running result of the GUI that was created, with input example in the form of the first data in the table of the previous testing (Grade Point in first semester = 3.14; Grade Point in second semester = 3.85; Grade Point in third semester = 3.68).
Figure 6. GUI Display with testing data
3.3. Data Testing Result
Testing will be conducted using script from NN toolbox (first way) and after being given the command: sim(net_gabung,input);
Thus the result will be:
ans =
Columns 1 through 6
1.0007 1.0001 1.0015 0.9843 1.0395 0.9988 Columns 7 through 12
1.0008 0.9999 1.1106 0.9973 1.0006 2.0023 Columns 13 through 18
1.9981 2.0065 1.9967 1.9999 2.0013 2.0025 Columns 19 through 24
1.9987 3.1285 3.0122 2.9988 2.9992 3.1647 Columns 25 through 30
2.9166 2.9956 2.9955 3.0012 3.0020 3.0057 Columns 31 through 36
3.0017 3.0053 3.0060 3.0152 2.9947 3.0018 Columns 37 through 42
3.0135 3.0182 2.8903 3.0070 3.0080 2.9585 Columns 43 through 48
3.0011 2.9758 3.0027 3.0074 3.0084 3.0010 Columns 49 through 54
3.0081 2.9770 3.0003 3.0021 3.0207 3.0005 Columns 55 through 60
3.0039 2.9997 3.2305 2.9883 3.0005 3.0005 Columns 61 through 66
3.0484 3.0253 3.1139 2.9948 3.0087 3.0937 Columns 67 through 72
3.0432 3.0007 3.0027 3.0804 3.0014 2.9989 Columns 73 through 78
2.9859 2.9788 3.0181 3.1091 2.9990 3.0073 Columns 79 through 84
3.0614 2.9886 3.0206 2.9993 2.9976 3.0148 Columns 85 through 90
4.0331 3.9185 3.9960 3.9989 4.0394 3.9956 Columns 91 through 96
Columns 97 through 102
The writer tries to compare between pre-test and post-test results (shown in separate table of this paper, Table 3, Table 4 and Table 5).
From the testing and comparison result between data before and after testing (pre-test and post-(pre-test) shows 99.99% of the system already indicates a maximum result in order to execute time grouping prediction of student graduation based on as many as 166 data.
4. Conclusion
The writer concludes that based on testing and observation against Neural Network design results in order to predict time grouping of student graduation based on as many as 166 data, the NN configuration to be made consists of three (3) input nodes with 700 input layers and one hidden layer as well as an output. Performance shows the best performance figure to the sum of 0.0039396. Whereas the prediction output value in the regression graph is R=0.99829, which means it almost reached the most ideal value, namely one (1), which indicates that between the target and output result is the same. The result of testing done against existing data shows correct results in makinga prediction reached 99.9%, or almost all of its predictions are correct.
References
[1] Azi M. Prediksi Lama Masa Studi Mahasiswa dengan Metode Fuzzy Sugeno. Thesis. STMIK Banjarbaru Kalimantan Selatan Indonesia. 2012:1-4.
[2] Meinanda A, Muhandri S. Prediksi Masa Studi Sarjana dengan Artificial Neural Network. Thesis. ITB. Bandung. 2009.
[3] Rahmani B. Early Model of Traffic Sign Reminder Based on Neural Network. TELKOMNIKA Telecommunication, Computing, Electronics and Control. 2012; 10(4): 479-758.
[4] Gupta M, R Kumar, RA. Gupta Neural Network Based Indexing and Recognition of Power Quality
Disturbances. TELKOMNIKA Telecommunication, Computing, Electronics and Control. 2011; 9(2):
227-236.
[5] Bayu AT, Rodiyatul FS, Hermansyah. An Early Detection Method of Type-2 Diabetes Mellitus in Public Hospital. TELKOMNIKA Telecommunication, Computing, Electronics and Control. 2011; 9(2): 287-294.
[6] Hany F, Felix P, Henry K. Enhanced Neuro-Fuzzy Architecture Fod Electrical Load Forecasting. Telkomnika. 2010; 8(2): 87-96.
[8] Wahyudi A. Prediksi Hasil Ujian Nasional Berbasis Jaringan Syaraf Tiruan. Laporan Skripsi. STMIK Banjarbaru. Banjarmasin. 2012: 1-2.
[9] Hermawan A. Jaringan Syaraf Tiruan Teori dan Aplikasi. Yogyakarta. Penerbit Andi. 2006.
[10] Kusumadewi S. Artifical Intellegence (Teknik dan Aplikasinya). Yogyakarta. Graha Ilmu. 2003.
[11] Kusumadewi S. Membangun Jaringan Syaraf Tiruan. Yogyakarta. Graha Ilmu. 2004.