JURNAL BISNIS DAN EKONOMI
Analysis of Relationship Between Energy' lntensity and Income Per Capita: A Comparative Study on Ten Asia Pacific Countries
Indra, Noer Azam Achsani dan Djoni Harlono
Can Economic Growth Effectively Reduce Poverty?: An Empirical Evidence D.S. Priyarsono dan Ajid Hajiji
Financial Crisis Versus Debate on Urban Space, Challenge, and Research Agenda Ridwan Sutriadi
The Choice ofTax Bases Under Fiscal Federalism and The Unitary System: -What Can Be Learned?
- Wempi Saputra
Application of Land Transformation Model To Forecast Urban Land Use Change in Jaliodetabek Metropolitan Area
Didit Ok/a Pribadi dan Andi Syah Putra ,
Population, Economic Development, and Environment: An Empirical Study of The Interrelationships Using Crosscountries Data
Deni Kusumawardani
Largesmall Industry Coniracting
。セ、@
Regional Development: Case Mitra Produksl Sigaret (MPS) PT. HM SampoernaCatur Sugiyanto
Java Isl.and: Regional Disparity and Sustainability Perspectives Eman Rustiadi, Dyah R. Panuju, dan Andrea E. Pravitasari
The Measuring Efficiency Model of Regional Factor Existence on Political Party in Indonesian General Election
Bhimo Rizky Samudro
KINERJA Volume 14, Edisi Khusus, Tahun 2010, Hal. 94-114
JAVA ISLAND: REGIONAL DISPARITY AND SUSTAINABILlTY PERSPECTIVES
Ernan Rustiadi Email:[email protected]
Dyah R. Panuju Email:[email protected]
Andrea E. Pravitasari Email:[email protected]
Center for Regional Systems Analysis, Planning and Development Bogor Agricultural University (IPB).
Abslraksi
Indonesia sedang menghadapi disparitas regional yang sang at kompleks . Kondisi ini diperburuk dengan kebijakan terpusa/ yang terkonsen/rasi hanya pada per/umbuhan ekonomi. Disparitas seharusnya dikelola dengan bijak un/uk mengurangi dampak negatifyang ditimbulkan. Pemahaman level disparilas regional merupakan suatu kondisi yang diperlukan agar dapat mengevaluasi kebijakan dan implemen/asi pengembangan. Oleh karena lingginya populasi dan konsumsi sumber daya alam secara relative, Pulau Jawa telah menghadapi berbagai problem lingkungan , banjir dan longs or. Hal ini merupakan tantangan sus/ainabel penduduk urban dan pinggiran termasuk system produksi. Penelitian ini ber/ujuan un/uk menganalisa dispari/as Pulau Jawa dengan menggunakan pengukuran dispari/as regional yang dikenal dengan Williamson index dan Theil-Entropy index. Theil indices tercjiri dari 3 jenis disparitas regional yakni (a) between and within regencies/ municipalities, (IJ.) between rural-urban areas, dan (c) between and with in metropolitan/megapolitan urban system and the rest of Java areas. Berbagai parameter socio-economic dan environmental mengindikasikan bahwa Pulau Jaya sekarang sedang menghadapi krisis spasial dan lingkungan. Ini menyebabkan eksploitasi berlebih pendukung Iingkungan dalam beberapa dimensi seper/i per/umbuhan populasi dan aktifitas ekon omi di Pulau Jawa yang berhubungan dengan pengembangan yang tidak seimbang antara Pulau Jawa dengan luar Pulau Jawa.
Kala kunci: disparitas regional, pengembangan regional, land use co ver changes, bencana
1. INTRODUCTION
Regional disparity ha s been a universal issue for almost all countries, developing and developed ones . Problem of in equalities had risen since development process started. It could be diminished or even increased depends on th e process itself and also strategies to eradicate th e spread . In a vast size archipelagic country like Ind onesia, disparities seem to be an unavoidable fact of nature, but interregional disparities In economic development have always been atlracted considerable political and scholarly attention . Imbalanced regional deve lopment emerged in form of uneven distribution and resource allocation. The con sequences were then appearing conflicts especially originated from mistreated communities. It was also loosened networking and social ca pital. Hi nterland was weakened due to backwash impact which transferrin g massively resource s from rural (hinterlan d) to core (urban) areas . The circumstances were unfortuna te and threa tened regional capacity to
Java Island: Regional Disparity and Sustainability Perspectives (Ernan Rustiadi, Dyah R. Panuju dan Andrea E. Pravitasarij
grow synergycally with other regions. Many believe this disparity was the impact of distortionary centratistic policy interventions. The regional development problem is perceived closely related to the political val.wes of national integration. Consequently, analyses of regional disparities become an important ingredient of general assessments of Indonesian "state capacity" and the state of the nation. There has been a direct link between the perceived increase of regional disparities and the urge increasing share of the central government in state revenue. It has been requested since decentralization policy implemented.
Indonesia has seen experiencing moderates economic growth and a rise in standard of living over the 1998 economic crisis and decentralization era. However, even many fiscal and non fiscal regulations have been implemented to ameliorate the excess of centralistic development approaches, the benefits of decentralization have spread highly unevenly, especially at the regional level. Usually, disparities within district levels are much larger than between provinces or main islands. Therefore, inter and intraregional disparities as well as centre-region relations are important issues in Indonesia.
National regional development should be a multidimensional process - involving fundamental changes in social structure, social attitudes, and national institutions, while at the same time maintaining the accelerated economic growth, solving income inequality, and alleviating poverty. Incremental and paradigm changes according to Anwar (2001) in regional development should lead to an equity that supports economic growth and efficiency, and sustainability. The concept of development which considers three aspects evolve in time is affected by the changes in the value systems of the society such as social and economic conditions as well as political reality.There is congruence between population distribution pattern, wealth distribution (regional disparity) and environmental degradation (Madu, 2007)
At the national scale, the implementation of development has created major and complex developmental problems. The heavy emphasis on the macro economic growth tends to overlook the emergence of big gaps in regional development. Investment and resources are generally absorbed and concentrated more in urban areas and growth centers, while hinterland or rural areas experience excessive exploitation of resources.
At the macro level, the disparity in the regional development in Indonesia is characterized by the tendency in several spatial biased developments, namely 1) Java,biased (Tabor et aI., 1999); 2) Jakarta-biased (Jabodetabek) (Maulida, 2007); 3) urban-biased (Dick, QYセQ[@ D'ouglas, 1998; Martina, 2005; Rustiadi and Pranoto, 2007); and 4) terrestrial-biased (Rustiadi, 2008). The development disparity between regions is on the one hand in the form of poor distribution and allocation in the utilization of resources - creating inefficiency and less optimal economic system. On the other hand, conflicts are becoming so potential because the regions which previously obtained little attention in development now begin to demand their rights. The unequal development has resulted in the structure of relationship or interaction between regions which weaken each other. Hinterland weakens because of excessive backwash of resources, resulting in a net flow and accumulated value-added more concentrated on development centers massively and excessively. Such condition is indeed disadvantageous because the disparity in regional development, besides making less optimal capacity of regional development, prevents the potentiat aggregate (macro) growth of devetopment from synergic (mutually supporting) interaction of development between regions) . To reduce differences, emphasis must be given to the less prosperous regions and treating unequal regions equally is not a recipe for reducing disparities (ODPM, 2003)
Disparity on development is usually described based on the result of development process , for instance human development index. According to Amos (1988), Williamson (1966) was the first who examining relationship between regional disparity and economic development, while Kuznets (1966) was the first applying hypothesis to personal inequalities. Rooted in inverted-U hypothesis, Williamson found that per capita income inequality declined in the period of 1950-1960 for several separate data sets.
Neckerman and Torche (2007) intensively reviewed causes of inequality in United States of earning, wealth and opportunity and its consequences on social and political aspects particularty on health, education, crime, social capitat and political power. Both then concluded that causes of inequality depended on time of observa tion, rate of distributional change s and possibly skill-biased technologi ca l changes
KINERJA Volume 14, Edisl Khusus, Tahun 2010, Hal. 94·114
Process of development in Indonesia was believed to be "urban bias' and some also called "Java bias' since almost all strategies was started and initialed from urban and concentrated in
Java.
Therefore Ihere is in commonto
present Indonesia's context inlo two partsas Java
VB. outer Java or West part of Indonesia (KBI) vs. East part of Indonesia (KTI). It is quite rare to present Java as a single entity when describing disparity without comparing to other areas of Indonesia. However, from regional indicators, disparities among regions of Java were emerging. The government, for instance National Land Agency in the latest five years concentrated to study disparities among North and South regions of Java. Then, it was also concerned on disparities between metropolitan and non metropolitan area.This study was designed to describe the direction of Java Island development growth, Java economic role in national context and to analyze disparity on development in Java using some indicators including economy, human development and environment It was designed to illustrate how geographical eccnomics can assist regional development policymakers in fighting unsustainable regional disparities in the future. It was supposed to describe the recent eccnomic role of Java Island in national context and to describe disparity within Ihe island"
2.
METHODOLOGY2.1 Data and Analysis
The regional disparity was analyzed descriptively by comparing the trends in the indicator of population and economic growth between Java and outside Java as well as within Java. The regional disparity analysis inside Java was focused particularly on the polarization of population and economic growth among provinces, among regencies and municipalities/towns, between northern and southern coast regions, and between Jabodelabek and Non Jabodetabek region for the period of 2000-2006.
To describe inter· and intra·regional disparity. there are some techniques. including ccefficient of variation, Williamson indeX, Theil index, Atkinson index, Hoover coefficient. Coulter coefficient, and Ginl index (Portnov and Felsensteln, 2005). In this paper, we employed Williamson and Theil technique to produce Williamson and Theil index. Williamson index is general index 10 describe and compare inter-region disparities. Williamson formulated the index as follows (Williamson, 1966):
where:
V w = Williamson Index
Vi
"
Gross regional domestic product (GRDP) of sector-iY
セOー@ =
Average GRDP of the region
セ@ is population of region·1 while p"
'Lt,.
total population.Williamson index has a value greater than or equal to O. If Vi =1, then index will be = O. It means no disparity among regions. tndex greater than 0 shows IO,ere is economic-inequality among regions. The greater ihe index means the larger gaps or disparity among regions. We utilize gross domestic regional product (GORP) and popuiation of regencies/municipalities in Java on 2000-2007 It is arranged to figure out trend of Williamson index to understand regional disparities among regions of Java in time series basis.
Theil entropy index was employed to portray within and between regional disparities. According to Kuncoro (2002) and Wibisono (2003), Theil index has some advantages, for instance: (1) it is not insensitive to regional scale and (2) Theil index is independent to the number of regions, (3) it can be decomposed simultaneously into within and between region disparities. The formulation of Theil Index (Ylng, 2000) is as follows:
Java Island: Regional Disparity and Sustainabilily Perspectives. (Eman Rustiadi, Dyah R. Panuju dan Andrea E. Prav/lasarl)
Irc" hBセi@ =l:(ylY).Iog J [(y 1Y)/(xJXJ]i f
Where:
ITheil
"
Total disparity (Theil Entropy index)Y,
"
GRDP of regency-j.y
" GRDP of Java.xj
=
Total population of regency-j.X
=
Total population of Java.In this paper we employ Theil index to describe: (1) Inter provinces and regencies of Java (2) Regency· Municipality disparities; (3.) South vs North areas of Java; and (4) Jabodetabek vs non Jabodetabek areas.
Theil's (1967) first presentation of the measure of inequality was based on statistical information theory. Theii's original presentation of his inequality indicator is not intuitively appealing, as the quotes above suggest. In other cases, no intuitive motivation is given, and it is simply menlioned that the Theil measure is based on information theory (as in Alison, 1978: 867).
3. DISCUSSION
3.1 Population Growth Dynamics
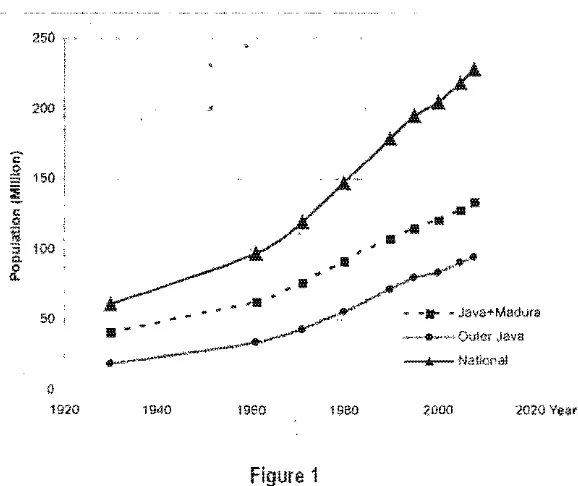
Population or human resource is main aClor on development. The growth of populalion should be considered to be main driving forces on process of development. In the other hand, Its quality can be considered as result of development processes. Java as a main island of Indonesia is Inhabited by almost 60% of Indonesians, while only consist of 7% areas. The proportion of population on Java Island to the national population from 1930 to 19905 continued to drop from almost 70% to below 60% (after 1990s). However, since late 19905 the figure has tended to increase again (Figure 1).
250 セ@
200 セ@
'2 .
s::o 150, .
セ@ .
.9
セ@ 100;
0. .
f
50 •
o
[image:5.612.164.453.440.683.2]1920 1940 1960 1980 ::1000 2020 Year
Figure 1
National, Java and Outer Java Population since 1930 to 2008
Sources', Population census (Sensus Penduduk)
KINERJA Volume 14, Edisi Khu5US, rahun 20111, Hal. 94·114
Until 1970s, the growth slowed down, although il was stili at high rate. Since then the growth rale both
90
Java Island and outside Java continued to
fall.
However, at the end19905
both group areas faced increasing rate,where the rate of Java was greater than outside Java. Without asignificant intervention, Java
will
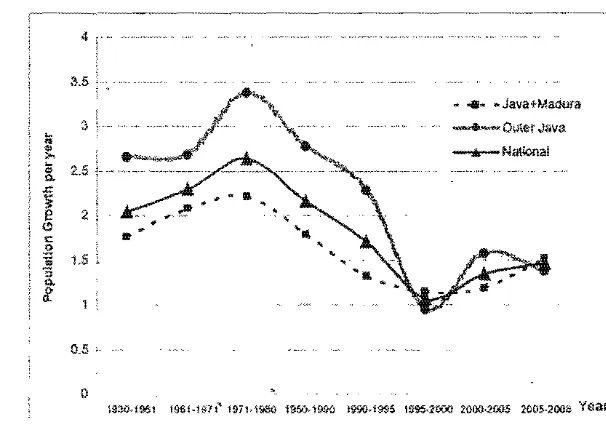
be eXperiencinghigh growth rale with less magnitude compare to the rate of 1960·1980s (Figure 2).
The relatively better welfare of Java Island has been followed
by
high population growth rate. The revived high growth rate of national population particularly in Java seems to be resulted from the less tight of family planning policy since the reform era, In addition, the policies in regional autonomy seems nol brought out positive effect on the improvement in the spatial distribution of population and narrowing the development p.olarization between Javaand outside Java. '
4
.. .... .. Java +MarJurlt - - * -Ol.lier J .. Y<l
セn。エゥoョ。ャ@
..
(,5 '
o
$ Figure 2
Dynamics of population growth rates of Indonesia, Java and Outer Java (1930·2008). Sources: Population census (Sensus Penduduk)
3.2 Dynamic Rate of Economic Growth and Income per Capita
Java Island holds a very Significant role because of its contribution in supplying 55% of food production (rice) and around 59% of national Gross Domestic Regional Products (GDRP). According to Central Bureau of Statistics (BPS), the GDRP of Java continues to rise anually, and ils share always higher than the share of outside Java. During the period of 2000 to 2007 the economic growth rate in Java is consistently higher !han that of outside Java (Figure 3) and there was no significant change in polarization of Java vs. outside Java deveiop· ment.
[image:6.612.160.463.273.489.2]LMセ@
Java Island: Regional Disparity and Sustainability Perspectives (Eman Rustiadi, Dyah R. Panuju dan Andrea E. Pravitasari)
LNNNMMM L NM NセM M L MM NM MN MMM M MMMMMMMMMM MMM N M..
,.-i
! 2.000.000.000 "t._-.•- .. .._ .. .. ._._ ..•.•_'.•._.••
..-1.800.000.000
t
i,..
_·H,,-,
1.600,000.000 ;, "...
1..200.000,000 J _, ., '_.
セ@
.
セ@
.
',000,000.000 , _H' _ ___ _ . ' ' ' _ _ ; ;. . . . NLセ@! セ@ -a ...
800,000,000 ᄋセ B@ iゥ M M ᄋᄋM MBG ・NM] M ᄋᄋZM M セL ZZM ,.:.... ,,
. .. -_,
__*.__
セGエMMMMMM600,000,000 , .. .... .. .... • ."' • ._.::::::.! .
Lセ ⦅ Z
__ _ , ___セL
__ _ _ _ _ __ _ _ ,, _ .. _N" _0_ _ ___ _ _ヲZ セ MMZ[ セ G]j[[。
G@
M MG@
_
400,000,000 ) \__._ Outer Java;
) i '
200,000,000 ェN M M M M MMM MB MM M NMセ MN BM MMM MM M MMM ..." i r National
L...
セNM MM
'''
[image:7.612.98.485.120.376.2]-2005 2006 2007
Figure 3
National, Java and Outer Java GORP since 2000 to 2007
Sources: GDRP (20002007)
The income per capita of Java inhabitants is consistently greater than that of outside Java. The economic growth rate acccmpanied by a greater population growth rate in Java has lessened increasing rate of GORP per capita of Java than that of outside Java (Figure 4).
9,000,000
セ@
5,000,000
!!'.
•
a
4,000,000セ@
!
3,000,000a. - . Java
fS
2.000,000 •• . ,. Outer JavaCJ
1,000,000 .... Nalion aJ
2000 2001 2002 .2003 2004 2005 2006 2007
Year
Figure 4
National, Java and Outer Java's GORP per capita (20002007)
Sources: GORP per capila (20002007)
1
S- 8,000,000 NセM
o.
•
'! 2
••
セ@7,000,000
[image:7.612.169.459.474.704.2]KINf.RJA vッOケュセ@ 14, Edisi Khusus, Tahun 2010, Hal. 94·114
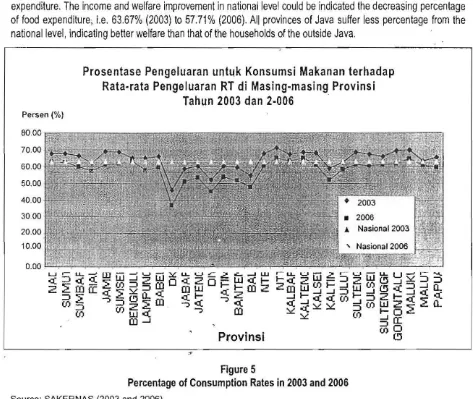
The welfare status can be observed from percentage of expenditure on food compared to total households . expenditure as presented in Figure 5. The increase of income is commonly followed by arelative reduction in food expenditure. The income and welfare improvement in national level could be indicated the decreasing percentage of food expenditure; i.e. 63.67% (2003) to 57.71 % (2006). All provinces of Java suffer less percentage from the national level, indicating better welfare than that of the households of the outside Java.
Prosentase Pengeluaran untuk Konsumsi Makanan terhadap
Rata-rata Pengeluaran RT di Masing-masing Provinsi
Tahun 2003 dan 2-006
.
Persen (%)
80.00
70.00
60.00
50.00
40.00
3000
20.00
10.00
[image:8.612.79.552.141.540.2]Provinsi
Figure 5
Percentage of Consumption Rates in 2003 and 2006 Source: SAKERNAS (2003 and 2006)
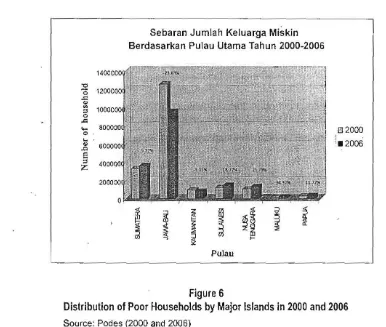
Despite of having huge number of poor households ("pre·welfare' and 'welfare·I' types of BPS category), the Java Island experienced a decline in the number of poor families from more than 12 millions in 2000 to around 9 millions households in 2006, (drop of 23,83%). However, almost all other islands outside Java (except for Kalimantan) increased in the number of poor households.
Java Island: Regional Disparity and Sustainability Perspectives (Ernan Rustiadi, Dyah R. Panuju dan Andrea E. Pravitasari)
Sebaran Jumlah Keluarga Miskin
Berdasarkan Pulau Utama Tahun 2000-2006
[image:9.612.97.483.97.424.2]Pulau
Figure 6
Distribution of Poor Households by Major Islands in 2000 and 2006
Source: Podes (2000 and 2006)
Due to relatively fertile soils and betler infrastructure to support rice production, Java island historically came across a high support to the civilization development..Moreover, there are some views such as those expressed by Anwar (2004) and World Bank (1996) that the national development has tended to be Java bias and urban bias. A similar opinion was also put forward by Garcia and Garcia (2000). who acknowledged the Java-bias in the national
development in Indonesia. •
3.3 Environmental Changes and Sustainability Issues
The high pressure of population in Java and economic activities has eventually produced some drawbacks in terns of environmental capacity and irreversible damage. The Island also continues to experience the land use conversion of its most fertile land as well as forest areas and have the impact on its environmental carrying capacity.
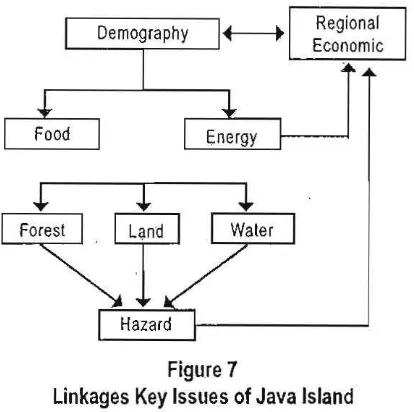
According to the Study Team of Environmental System in Java of IPB (2007). the environmental key issues are among others: (1) population; (2) economic changes/dynamics (disparity); (3) food; (4) energy; (5) land; (6) water; (7) forest; and (8) disaster. The simple relationship of these issues can be illustrated as in Figure 7.
KINERJA \Iolume 14, Edisi Khusus, Tahun 2010, Hal. 94·114
Regional Economic
,J;
セ@
[image:10.612.218.425.112.318.2]セャ@
セhセ。セコセ。イセ、ZjMMMMMMMMMMMM
j@
Figure 7
Linkages Key Issues of Java Island
Source: Study Team of Environmental System in Java of IPB, 2007 .
Besides its fertile soil, Java is an island which is geographically, geologically, hydro-meteorologically, and biologically or naturally prone to disaster. The empirical data and facts indicate that since the reform and regional autonomy policy era come into affect in 2000 the island has experienced various antropogenic-disasters. The disasters tend to increase in tenm of (1) types, (2) frequency, (3) location distribution, (4), and (5) impact, as well as (6) distribution of potential location.
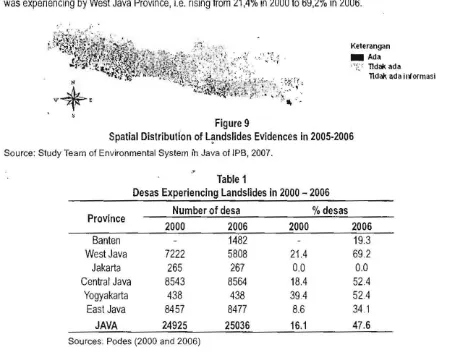
The percentage of disaster occurrence in Java tends to increase. Figure 8 describes percentage of villages hit by floods and landslides. Meanwhile, Ihe spatial distribution of villages hit by floods and landslides from 2005-2006 is presented respectively in Figures 9 and 10.
セ
:;
セ@
0;
%
w
'"
セ セ@ セ@'"
w
'"
",'"
,,, セ@'"
セ@
"
.;
00
'"
% セ@セ@ 0
セ@
''''
セB@ セ@'"
in セ@ セ@ セ@ % % セ@'"
'"
'"
セ@ セ@ w W %
W
セ@
セ@'"
'"
Figure 8. (a) Percentage of floods in main islands of Indonesia (2000 dan 2006), and (b) Percentage of landslides in main islands of Indonesia (2000 dan 2006),
[image:10.612.89.546.465.647.2]Java Island: RegionalDisparity and Sustainability Perspectives (Eman Rusliadi, Dyah R. Panuju dan Andrea E. Pravitasari)
,
_ Occur
セ Not Occur
No Data
. Figure 8
Spatial Distribution of Flood Evidences in 20052006
Source: Study Team of Environmental System in Java of IPS, 2007.
More than 50% of villages in Java were hit by floods in 20052006, increasing from the previous year (2003)
of around 30%. Meanwhile, landslides, a strategic issue in degrading the environmental capacity of Java, also slep up, from 16% in 2000 to around.48% in 2006, as shown in Table 1. The highest percentage of villages landslides was experiencing by West Java Province, i.e. rising from 21,4% in 2000 to 69,2% in 2006.
Keterangan
_ Ad.
[image:11.612.124.486.123.253.2]j'T:': TIdal< ada ndal( ada ゥャセッイュ。 ウ ゥ@
Figure 9
Spatial Distribution of Landslides Evidences in 20052006
Source: Study Team of Environmental System ih Java of IPS, 2007.
,
Table 1
Desas Experiencing Landslides in 2000 2006
Number of desa %desas
Province
2000 2006 2000 2006
Banten 1482 19.3
West Java 7222 5808 21.4 69 .2
Jakarta 265 267 0.0 0.0
Central Java 8543 8564 18.4 524
Yogyakarta 438 438 394 52.4
East Java 8457 8477 8.6 34 .1
JAVA 24925 25036 16.1 47.6
Sources: Podes (2000 and 2006)
3.4 Regional Disparity within Java Island
In addition to the environmental problem, the Java Island is facing internal regiona l population density and income disparity. The description of regional disparily in Java can be classified inlo its source of disparity: i.e among provinces, among regencies/lowns. betwee n north and south parts of Java . and belween Jabodelabek and Non Jabodetabek regions.
[image:11.612.76.536.325.679.2]KINERJA Volume 14, Edisi Khusus, Tahun 2010, Hal. 94·114
3.4.1 Disparity among Provinces
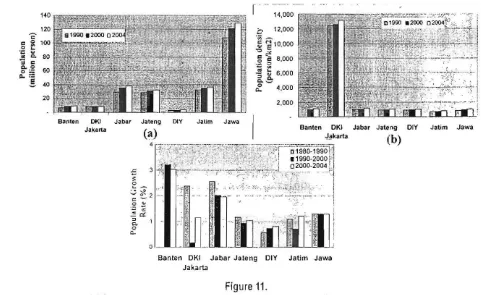
Table 2 presents number of population and its growth'rate in each province of Java. Meanwhile, the population number (people), population density (people/km2), and population growth rate (%) for each province of Java is portrayed in Figures 11 (a), (b), and (c).
Table 2
Population, Share of Population and Population Growth Rate of Each Province in Java (%)
Parameters Jakarta West Java Central Java DIY East Java Banten
Population 2000 8,494,418 35,723,473 31,448,251 3,121,701 35,340,005 8,054,040
2007 8,723,416 40,329,050 32,380,284 3,434,533 36,895,561 9,423,370
Population share (%)
2000 6.95 29.24 25.74 2.55 28.92 6.59
2007 6.65 30.74 24.68 2.62 28.12 7.18
Average Population
Growth Rate 0 39 175 0.42 1.38 062 2.30
2000·2007 (%/year)
Source: Podes (2000 and 2007).
In 2000·2007, almost all provinces of Java experienced an increase in population growth rate except OKI Jakarta (Jakarta City Province).
r
" ;'.000
1<0
120 .f' 12,000
§ 'C
e
100 セ@ セ 10,000." u '0""
• 0. 80
;; c § 'C 8,000
',= £
ァMセ@ 60 .; セ@ 6,000
A.=
c..!O
!
<40:. 4,000
20
2,000
Banlen OK1 Jabar
DIY Jatim Jawa Jakarta
(b)
Santen OKI Jabar Jateng DIY Jatim Jawa Jakarta
Figure 11.
(a) Population (million person); (b) Population Density (person/km2); and (c) Population Growth Rate (%) of Provinces of Java (Year 1990, 2000, 2004)
[image:12.612.87.568.431.726.2]Java Island: Regional Disparity and Susta/nability Perspectives (Eman RustiadJ, Dyah R. Panuju dan Andrea E.Pravi/asari)
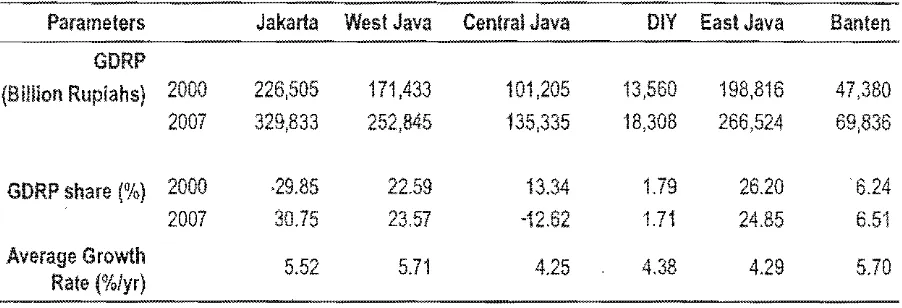
The disparity in development among regions of Java can also be examined from their economic growth rales, The DKI Jakarta (with the smallest size of region) is the region with the biggest contribution of GORP (30%) (Table 3), Since 2000, the provinces of the west region (Banten, DKI Jakarta and West Java) developed with a fast
economic growth rates, The average rate of DKI Jakarta, West Java and Banten were above 5,50%, whereas the other three provinces (Cenlral Java, DIY East Java) were lesser (around 4,30%),
Tabsl3
GORP, GORP Share and Growth Rate of Each Provinces
in Java,
Parameters Jakarta West Java Central Java DIY East Java Banten
GORP
(Billion Rupiahs) 2000 226,505 171,433 101,205 13,560 198,816 47,380
2007 329,833 252,845 135,335 18,308 266,524 69,836
GORP share (%) 2000 ,29,85 22.59 13,34 1.79 26,20 6.24
2007 30.75 23.57 12,62 1.71 24.85 6.51
Average Growth
Rate (%/yr) 5,52 5.71 4.25 4,38 4,29 5.70
Source: GORP (analyzed),
The disparity of regional income (GOP) capita between regencies/towns studied using Williamson index tended to decline from 0,77 (in 2000) 10 O}1 (in 2007). EaslJava came across the highest disparity among regionsl towns compared to other provinces of Java, with two-fold disparity higher than that of other provinces (Figure 15),
lAOO
""
w,,.,
""
0000
[image:13.612.73.524.223.377.2]1985 199iJ 1993 1997 2000 2003 2007 Year
Figure 12
Williamson's Disparity Index between RegenciesfTowns in Each Province in Java
Theil indices shows that the total disparity of Java tended to increase from 1986 to 2007 (Figure 12). The Theil indices of among provinces and among regenciesimunicipalilies within province in 1986 1997 were significantly different. !1owever, between 1997 and 2007 convergence was eVident (Figure 13). It means thai
••
1.000
]' O.BOO _ c
o
11 JS 0.600
セ@
GAOO
o200 PRセQ@
O.:3SS
I.H YOCyal::>/t?
_ _ Ea>!Javli
_BMlen
oセ@ ill 。ヲGGGGDGGiヲIpョZNキョセ・@
KINERJA Volume 14, Ed/51 Khusus, Tallun 2010; Hal. 94·114
inequality among regenciesimunicipalities within provinces tended to increase. In the period of 1986·2007, the disparity among regencies/towns was dominantly (55% to 65%) contributed by differences among provinces, whereas the rest (33% to 43%) was contributed by inequality among regencies/towns within the province. It seems there was an increasing disparity resulting from the differences among regencies/towns within province.
.. ... -., ...LLセセMNM 1200 :
L""
"".
toOO
..
."aM' i K OllOO ;
•
"
EtHin
ore Nセ@ _?m
• 0.600 !
セ@
セ@
I
0400,-
ャAセョ@,,.,
cセIB@KゥゥNGセエ\エ@
rセB@
0200 MMセ MIIr.id...セ@
0,01)1
'S6<! 1m
"'"
1997 [image:14.612.110.475.179.375.2]""'"
2003 2.007 YearFigure 13
[image:14.612.111.501.436.646.2]Total Inequalities among Regencies and Municipalities of Java Based on Theil Indexes
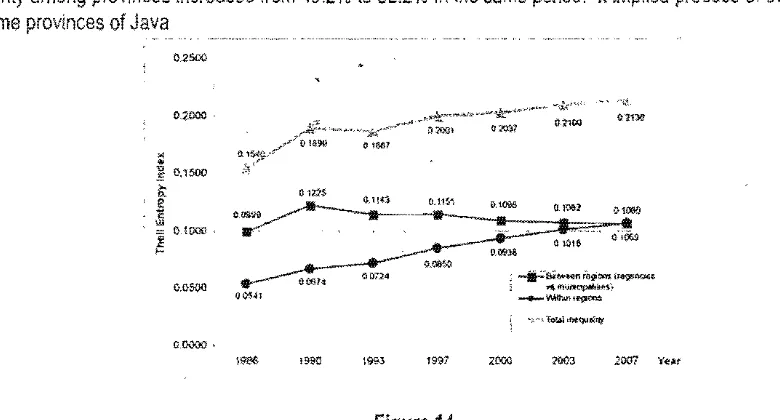
Figure
14
shows series oITheil index decomposition into two components, i.e. disparity within and between provinces. Apparently, disparity within provinces tended to decrease from 50.8% to 47.8% in 2000·2006. In contrast, disparity among provinces increased from49.2%
to52.2%
in the same penod. It implied process of development in some provinces of Java00014 . セウゥセイoiャャ⦅ゥG _ _
- セBGカエoエ^ーoィNmG@
_ _wャャキLセ@
セ@
""
Figure 14
Theil Indexes Decomposition Based Of! Gross Domestic Regional Products (GORP) of Java's Provinces
Java Island: Regional Disparity and Suslainability'Perspectives (Eman Rustiadi, Dyah R. Panuju dan Andrea E. Pravitasari)
It Is showed that disparity among Javas's provinces was emerging. Apparently, Jakarta province stH! dominates in all aspects.
Table
4
Human Development Index by Province in Java (1999, 2002, 2005)
Province Human Development Index
1999
2002
2005
Jakarta 72.5 75.6 76.1
West Java 64.6 65.8 69.9
Central Java 64.6 66.3 69.8
Yogyakarta 68.7 70.8 73.5
East Java 61.8 64.1 68.4
Bante0 Na 66.6 68,8
Source: BPS-BAPENAS-UNDP, Indonesia Human Development Report, 2{)O4
3.4.2 Disparity Among Regencies and MUnicipalities
Administratively, in 2007, Java Island consisted of 84 regencies and 32 municipalities. Aregency is generally characterized by a relatively large region and dominant in agriculture-based activities and down-stream ウ・」エッイウセ@
On the other hand, a municipality has a relatively small area with dominantly non-agricultural activities (industry, trade, s8lVices, etc),
[image:15.612.179.423.186.322.2]Disparities in development among regions of Java can be obsolVed from the inequality between regencies and municipalities. Table 5 presents number and percentage of population and its average growth rate among the regions of Java between 2000 and 2007.
Table 5
Population of Regencies,and Municipalities in Java in 2000-2007
Parameters Municipalities Regencies
Population 2000 3,651,726 98,530,156
2001 27.492,299 103,693,915
Population share (%) 2000 19.36 80.64
2007 20.96 79.04
Average Population Growth Rate (2000·2007) 2.20
073
it appears that population number of 84 regenCies of Java was around 79% 01 Java's population, whereas proportion of 32 municipalities was 21%. The gro\vth rate of regenCies was 0.73%, while of the towns was greater than it, reaching 2.20%.
Table 7 indicates that there was disparity in economic growth between regencies and municipalities of Java. The regencies, with its population percentage 80% of Java's, contributed less than 50% of the (Gross Domestic Regional Product) GORP of Java. On the other hand. municipality, inhabiled by only 20% of Java population. turned out to contribute more than 50% of Java's GORP.
In terms of economic growth rate, in general both lowns and regencies experienced qUite significant rate. However, il seems Ihat the urban rate was bigger than Ihe 'egenCies ゥセ。ャ@ was 554% and 457% respectively.
[image:15.612.93.475.487.597.2]KINERJA Volume 14, Edisi Khusus, Tahun 2010, Hal. 94·114
Table 6
Number, percentage and growth rate of GORP of municipalities and Regencies in Java
Parameters
GDP (Million Rupiahs)
2000
388,933,189 369,965,6092007 567,145,080 505,535,110
Percentage of Java's GDP 2000 51.25 48.75
2007 52.87 47.13
Growth Rate of GOP 5.54 4.57
1200·
'000
; OJ:OO
セ@
g
cusoo j!
3!OAe<}' Q #;4
0.200 i
LNNNNNNNNLuセャw、セ@
ャ\ᆪャiセmBGDN@
_ _ eftl""",,,
M uBGAヲpセG|Gセ@
[image:16.612.101.520.138.458.2]0000
Figure 15
Williamson's Index among Regencies and Towns (Municipalities) of Java ,
Theil indices of Java suggests an iQcreasing trend of the disparities among regencies and municipalities. The disparity among towns was always greater than among regencies. However, since 2000 dan 2003 there was convergence trend among and within regions. The figure indicates that since 1990s the disparity among towns and regencies have consistently dropped, and
in
2007 it was convergence..
o.oc''O]
セ@ oFセNェI@
セ@
セ@ (}400
_ _ _AIBGmセB@
BLセBBセNBLLLLLMN
:;200
CGOO
Figure 16
Theil Entropy's Index of Regencies and Municipalities
[image:16.612.208.439.553.733.2]Java Island: Regional Disparity and Sustainability Perspectives (Email Rustiadi, Dyah R Panuju dan Andrea E Pravitasarl)
3.4.3 Disparity Between Nortnen and Southen Java
[image:17.612.100.514.243.380.2]The disparity in Java can be observed from the difference of indicators between northern and southern coastal areas of Java. The northern region of Java includes
42
regencies/towns and Ihe southern area consists of 22 regencies/municipalities. Table 7 presents number, percentage, and growth rate of the northern and southern coast ofJava
from 2000to
2007.Table 7
Number, Proportion and Growth Rale of Population in the Northern and Southern Coast of Java from 2000 to 2007
Parameters Northern Java Southern Java
Population 2000 48,005,046 28,115,983
2001
51,845,317 29,137.133Percentage of Java's Population 2000 39.29 23.50
2007 39.52 22.21
Average Pop Growth Rate 2000·2007 1.11 0.22
(%/year)
it seems that in 200Q.200 1, Ihe average growth rate of population in tile northern region of Java was five fold of the population in the southern area.
Based on GDRP (constant price of 2000), both northern regions of Java in 2000-2007. as presented in Table 9, ccntributed much higher GDRP than the southern area. The percentage was 60% and 11% respectively. With the bigger GDRP, the economy in the northern part of Java grew more rapidly (5.2%) than the northern region (3.8%)
y Table 8
GORP, GDRP share and growth of Northern Java and Southern Java
in 2000. 2007
Parameters Northern Java Southern Java
GDP (Million Rupiahs) 2000
2007
457,489,896
650.353,600
92,941,533
120,648,450
Percentage of Java's GDP 2000
2007
60.28
60.63
1225
11.25
Average Growth Rate of GDP (%/yr) 5.16 3.81
[image:17.612.83.513.473.652.2]KINERJA Volume 14,Edfsf Khusus, Tahun 2010, Hal. 94·114
U'OO \
\%<1 10$11
"::lOO .
.11)01
"0'
C.eoo ;
セ@
セ@ 0.H3
£ t>.'n2
il6!4
C.£OO
C
'M'
セ@
JI---セ@ III
'Mile !>.HI
""
-tt-8 _ ...
11:"911>:1.0
セ@
セ@ 0400 セ@
_ S t l ...."" MUI.kl!!oIillt!;
0200
OJXlO '
,,,,,
yセXイ
1007 2003 2001
[image:18.612.199.458.117.317.2]'''''
"""
"""
Figure 17
Theil Entropy's Index between Northern Java and Southern Java
3.5 Metropolitan JABODETABEK vs Other Regions
The previous result described that disparity between municipalities (toWns) was the highest among other modes of disparity. it Iセ。ウ@ caused by the increasing polarity in the development between metropolitan and non-metropolitan areas. Figure
18
was designed to examine the disparity. The most extreme polarity results from the accelerated growth 01 Jabodetabek megapolitah., 000
y
-llt-I!1l1_
アセ[セB_^LLL@
""",S'thW¥l
N!,....ᆱセセLエウ
0.200
''''
1991 2()()7 Figure 18Resulted Theil Entropy's Index of Disparity between Metropolitan and Non-Metropolitan in Java
Jabodetabek Megapolitan. covering some towns (Jakarta, Bogor, Depok, Tangerang and Bekasi), has become the largest metropolitan In Indonesia. This region serves as the capital city of the country (Jakarta) and at the same time the capital of national economy activities. It becomes the center of growth wilh a very high population density Table 9 presents Ihe number and growth rate of population of Jabodetabek and other regions (Non Jabodetabek) Irom 2000 10 2007.
[image:18.612.161.467.448.635.2]Java Iillarid: RllgionalDlsparity and $uiltainabllity PerspecliviJll (Ernan Rustiadl, Dyall R. Parlllju dan Andrea E. Prav/lasarl)
Table 9
Number and Growth Rale of Population of Jabodetabek and Other
Regions
(NOll Jabodetabek) from2000
10 2007Parameters .Jabodetabek NOh
Population 2000 21,316,943 100,864,939
2007
24,398,393
106,187,822Percentage of Java's Population 2000 17.45 82.55
2007 18.60 81.40
Population Growth Rate (2000-2007) 1.95 0.82
Table 9 shows the population growth rate of Jabodetabek was relatively high. The rate of Jabodetabek (1.95%) was more than double of non-Jabodelabek regions (0.82%).
The disparity in economic growth between Jabodetabek and noh-Jabodetilbek regions was also studied. Jabode!aook includes only a small part of Java island (the Province of Capital City of Jakarta, Bogor Regency and Municipality, Oepok Municipality, Tangerang
Regency
and MuniCipality, and Bekasi Regency and MUnicipality) occupied by 18% of Java population. However, it contributed more than 40% to the total GROP of Java and grew more rapidly (5. 7%lyear). Conversely, the other regions (n6n Jabodetabek) covering larger area contributed around 60% to the GROP of Java (Table 10).Table
11)
GDRP, GDRP share and growths of Jabodetabek and Non Jabodelabek in 2000-2007
Parameters Jabodetabek Non Jabodelabek
GOP (Million Rupiahs) 2000 319,198,056 439,700,742
2007 469,870,330 602,809,860
Percentage of Java's GOP f 2000 42.06 57.94
2007 43.80 56.20
Average Growth Rate of GOP (%/yr) 5.68 4.61
1200
"'"
0.95,1.000
セ@ 0 aoo
u .;;
セ
"
0600.. E
'"
セ@ 0400
0875
{') 200
o aOe)
Year
[image:19.612.66.543.133.818.2]19aG \990 1993 1997 2000 200:) 2007
Figure 19
Williamson's Index between Jabodelabek and Non-Jabodetabek
[image:19.612.130.480.412.749.2]KINERJA Volume 14, Edl51 Khusus, Tahun 2010, Hal. 94-114
4. CONCLUSION
Inter- and intra- regional disparities as well as centre-region relations in Indonesia and within Java Island are likely to change in Ihe future, and the nalure of government policies will greatly determine whelher Ihe gap between the economic centers and lagging regions in the periphery can be solved successfully. The central government is responsible to distribute the benefits of eoonomic growth and development - primarily brought about by the economic centers (Java, Jakarta, cities and metropolis) more evenly \0 poorer regions. Highly unequal and inequitable regional outcomes would only create social unrest and impede further economic development
Various socio-economic and environmental parameters: indicate that Java Island is now facing spatial and environmental crisis. It is due to overexploitation of supporting environment in some dimensions such as population growth and economic activities in Java Island which are all related to the imbalance development between Java and outside Java. Population and economic changes in Java implied to the high demand for food and energy and thus excessive utilization of land and waler resources, which in turn results in the oonversion of forest region as the essential buffer zone for Java Island. The overexploited supporting capacity of Java Island has created a series of disasters which have increased in intensity, da!11aged regions, and number of population affected by such disasters.
To maintain th.e development sustainatiility, Java requires expansion of its forest coverage, particularly the regions functioning as the protective area surrounding them. In contrast, because 11 is still necessary to keep Java Island as the national rice basket, effective indicators are required to oontrolthe oonverted use of the best rice field in Java. Therefore, the eoonomic development in Java should be more oriented to tertiary sectors (commercial serltices) or non-extractive labor-intensive industries. Other industries are recommended for the development outside Java.
From a number of indications, it can be identified that Java Island is currently experiencing spatial and environmental crisis. This can be seen from the increasing occurrences of natural disasters with high frequency, intensity, types and coverage (particularly protective space/zones that are degraded), increasing conflicts over land uses. and imbalanced structure in the control of land use.
Besides the problem of reduced environmental supporting capacity, Java Island also has the issue of
development disparity. The imbalance between regions is not only an important issue between Java and outside Java, but also within Java regions. The imbjllance development among regions of Java can be categorized inlo the disparity among provinces, among regencies/municipaiities, between the northern and southern parts of Java, and between Jabodetabek and Non Jabodetabek. The disparities among regions of Java were indicated by the disparities in population and eoonomic growth rate.
The development trends in Java still indicate an increased polarity of development as examined in various perspectives with the exception of the disparity In the administrative regions of regencies and towns/municipalities The source olthe biggest and most outstanding disparity is the imbalance between metropolitan and non-metropolitan regions, Which is particularly caused by the accelerated development of economy (economic agglomeration) and population in Jabodetabek.
REFERENCES
Alison, P D. (1978), "Measures of Inequality," American Sociological Review, VoL 43 (December), pp.865-880.
Amity, M and l Cameron" (2004), "Eoonomic Geography and Wages:The Case of Indonesia", IMF Working Paper. WPI04179.
Amos, O.M., (1988), "Unbalanced Regional Growth and Regional Income Inequality in the Leier Stages of Development". Regional Science and U"ban Economics. Vo118. pp 549-566.
Java Island: Regional Disparity and Sqstainability Perspectjyes (Ernan Rustiadj, Dyah R. Pimuju dan Andrea E. Pravitasari)
Dick, H., (19.81), "Urban Bias: A (3ood Idea but ... the Indonesian Case", Asian Studies Review, VoL5, No. 2, pp 4 -10.
Douglas, M., (1999), "A Regional Network Strategy for Reciprocal Rural-Urban Linkages. An Agenda for Policy Research with Reference to Indonesia", TWPR, VoL20, No.1.
Madu, LA., (2007), "The Environmental Impacts of Regional Disparity in Population and Wealth Ddistribution in Nigeria. Environ Dev Sustain", Springer Science+ Business Media B.v. DOl 10.1007;510668-007-9109-0.
Maulida, R., 'Analisis keterkaitan ekonomi sektoral dan spasial di DKI Jakarta dan Bodetabek: Pendekatan
Modell-o
Inter-regional". Theses. Regional and Rural Development Planning Study Program (PS PWD). GraduateSchool. Bogor Agricultural University (IPB). .
Martina, K.K., (2005), 'Kajian Keterkaitan Perkotaan-Perdesaan Menuju Pembangunan Regional Berkelanjutan di Jawa Barat", Disertation. Regional and Rural Development Planning Study Program (PS PWD). Graduate School. Bogor Agricultural University (IPB).
Neckerman, K.M. and Torche, F., (2007), "Inequality: Causes and Consequences", Annu. Rev. Sociol. Vo1:33. pp.335-357.
ODPM: Housing, Planning, Local Government and the Regions Committee, (2003), "Reducing Regional Disparities in Prosperity", Ninth Report of Session 2002-03.
Portnov, B. and Felsenstein, D., (2005), "Measures of Regional Inequalities for Small Countries", In Snickars, F.' Anselin, L. Fischer, M.M., Hewings, G.J.O., Nijkamp, P. Advances in Spatial Sciences. Pp: 47-62.
Rustiadi, E., (2002), "Urbanization, Suburbanization, Land Use/Cover Change and Environment Problem in Jabotabek Region", Paper presented on Intemational Human Dimension Program for Global Environmental Change (IHDP) Workshop on uイ「。ョゥコセエゥッョGL@ 1- 16 June, Bonn, Germany.
- - (2008). "Perspektif Transmigrasi dalam Pengembangan Wilayah Kepulauan: Isu, Konsep dan Implikasi Kebijakan", Jurnal Penelitian dan Pengembangan Ketransmigrasian. . ISSN 0216-3578. Vol. 25, NO. 1. pp. 11-24.
- - dan D.R. Panuju, (2000), "A Study of Spatial Pattern of Suburbanization Process: ACase Study in Jakarta Suburbs", LUCC-IGU Pre-Congress Meeting in Tokyo-Tsukuba and Asahikawa-Sapporo 7-11 August.
----, Panuju D.R., dan Trisasongko B.H., (2007), "Environmental Impacts of Urbanization In Jabodetabek Area".
---, SA Wulandana, T. Agrisantika and A.E. Pravitasari, (2008), ''The Suburbanization And Urban Sprawl Dynamic of Jabodetabek Megapolitan", Paper presented on 31st International Geographical (IGU) Congress. Tunis 12-15 August.
---, E. and S. Kobayashi, (2002), "Spatial Pattern Comparative Study of Two Asian Metropolitan: Jabotabek Region and Tokyo Metropolitan", LUCC Symposium. 13 - 15 Decernber, Tokyo Keynote Speaker
---. and S. Pranoto.• (2007), Agropolitan, Membangun Ekonomi Perdesaan. Crestpent Press.
Tabor, Steve R. , H.S. Dillon and M. Husein Sawi!., (1999), ' Understanding the 1998 Food Crisis: Supply, Demand or Policy Failure?", ACIAR Working Paper. Vol. 99. Vol.13.
KINERJA lIb/ume 14, Edisi Khusus, Tahun 2Q10, Hal. 94·114
Williamson, J., (1966), "Regional Inequality and The Process of National Development: a Descriplion of the Patterns", Economic Development and Cultural Change, Vol.13, pp.3-45.
Wibisono, Y., (2003), "Konvergensi di Indonesia: Beberapa Temuan Awal dan Implikasinya". Jurnal Ekcnomi dan Pembangunan Indonesia. VoL51., pP.53-82.
Ying, l. G., (2000). 'China's Changing Regional Disparities during tlie Reform Period". Economic Geography, XXIV (7), 59·70.
Kuncoro" (2002). Analisis Spasial dan Regional: Aglomerasi dan Kluster Industri Indonesia. Unit Penerbit dan Percetakan AMP YKPN. Yogyakarta,
Anwar, A, (2005), "Ketimpangan Pembangunan Wilayah dan Perdesaan: Tinjauan Kritis" Crestpsn! Press, Bogoe
Theil, H., (1967), Economics and Information Theory. Chicago: Rand McNally and Company.