Australian Journal of Basic and Applied Sciences
Journal home page: www.ajbasweb.com
Corresponding Author: Muhammad Zuhaili Bin Razali, Faculty of Electrical Engineering, Universiti Teknikal Malaysia
Melaka (UTeM), Malaysia. E-mail: [email protected]
Effect of Hydrogen Inlet Pressure Analysis on open Voltage of Proton Exchange
Membrane (PEM) Fuel cell by using Periodogram
1Muhammad Zuhaili Bin Razali, 2Abdul Rahim Bin Abdullah, 3Wan Ahmad Najmi Wan Mohamed, 4Mohd Shahril Ahmad Khiar
1 2 4Universiti Teknikal Malaysia Melaka (UTeM), Faculty of Electrical Engineering, Malacca, Malaysia 3Universiti Teknologi Mara (UiTM), Faculty of Mechanical Engineering, Shah Alam, Malaysia
A R T I C L E I N F O A B S T R A C T
Article history:
Received 22 February 2015 Accepted 20 March 2015 Available online 25 April 2015
Keywords:
Proton Exchange Membrane Fuel cell (PEMFC), Pressure, Periodogram, Hydrogen, Frequency
Proton Exchange Membrane Fuel cell (PEMFC) is one of the renewable energy system that was recently highlighted by researchers. PEM fuel cell generates electricity through the electrochemical reaction of hydrogen and oxygen. Finite changes in the reactant inlet properties leads to unique operating changes within the fuel cell stack. The effect of hydrogen inlet pressure to the operating voltage has been detailed before using a variation of monitoring techniques. Identification analysis is required to monitor every factor that influences the performance characteristic of PEMFC. Periodogram monitoring technique applies a frequency domain waveform signal capable of tracing small changes in the phase behaviour of electrical operations as external parameters are varied. The use of this technique is provided in this paper within the scope of monitoring the signal changes in the open voltage of a 30Watt (W) PEM fuel cell stack as the hydrogen inlet pressure is varied from 0.1 bar to 0.5 bar. The open voltage increases with rise in hydrogen inlet pressure and the Periodogram amplitude signal increases accordingly. Then, the magnitudes of total tolerance voltage, the signal characteristic of direct current voltage (VDC), root means square voltage (VRMS), and alternating current voltage (VAC) were calculated from the voltage waveform where losses could be identified. Therefore, the Periodogram technique has been proven useful and practical in monitoring operation changes of a PEM fuel cell stack.
© 2015 AENSI Publisher All rights reserved. To Cite This Article: Muhammad Zuhaili Bin Razali, Abdul Rahim Bin Abdullah, Wan Ahmad Najmi Wan Mohamed, Mohd Shahril Ahmad Khiar, Effect of Hydrogen Inlet Pressure Analysis on open Voltage of Proton Exchange Membrane (PEM) Fuel cell by using Periodogram. Aust. J. Basic & Appl. Sci., 9(12): 86-92, 2015
INTRODUCTION
Currently, the rate of operation, installation and maintenance for fossil fuel sources of energy such as coal, diesel, and gas are on the rise to be more costly. Furthermore, fossil fuel sources of energy will turn into waste products which cause an obvious greenhouse effect along with other global problems. Sooner or later, the fossil fuel sources of electric are going to be exhausted as the rate of electrical demand increases per annual (Joao Neiva de Figueiredo, 2014).
Therefore, renewable energy sources are needed to be made known and explored to overcome the problems mentioned above. The newly introduced renewable energy that is Proton Exchange Membrane Fuel cell (PEMFC) provides higher energy density and a longer lasting system compared to a battery system (Ryan, Cha, Whitney, & Fritz, 2006). PEM fuel cell generates electricity through the electrochemical reaction of hydrogen from anode inlet and oxygen from cathode inlet. Finite changes
in the reactant inlet properties leads to unique operating changes within the fuel cell stack.
Unfortunately, the improvement of PEMFC is disturbed as there are various parameters and characteristic from the Fuel Cell which has not yet to be discovered intensely especially on the power spectrum analysis. To overcome this problem, researchers should pay more attention to understand the PEMFC behaviour in order to gain the best performance characteristic (Dhirde et al., 2010). Therefore, this research monitors the effect of various hydrogen pressures on PEMFC by using Periodogram method.
monitoring the effects of varying hydrogen properties are the first-level analysis towards improvements to PEMFC power outputs. Identification analysis is required to monitor the factors that play a part in the changes of the performance characteristic. Nevertheless, according to F. Yang (Mishra, Yang, & Pitchumani, 2005), the effect of concentration lost and water vapour diffusivity (purge) would decrease as the pressure of hydrogen is increased.
Different techniques have been used to directly identify the effect of reactant pressure towards PEMFC performance. Lin Wang (Wang, Husar, Zhou, & Liu, 2003) on his paper has presented the effect of pressure at both anode and cathode side between a variation of 1 to 3.72 atm by polarization curve. Apart from that, (Andreasen, Jespersen, Schaltz, & Kær, 2009) have experimentally studied the effect of pressure towards the PEMFC by using the Electrochemical impedance spectroscopy (EIS) technique. Identification analysis is required to monitor the factors that play a part in the changes of the performance characteristic.
Periodogram technique represents the distribution of the waveform signal power over the frequency (Ahmad, Abdullah, Bahari, & Hassan, 2014). This technique transforms the time domain waveform signal into the frequency domain waveform signal. Time domain signal would only demonstrate the time for disturbance or any changes in phenomena that are likely to occur at the signal (Abidin, Abdullah, Norddin, Aman, & Ibrahim, 2012). The Periodogram will gain and explain the magnitude or phase behaviour of the signal by referring to number individual or band of frequency (Abidin, Abdullah, Norddin, Aman, et al., 2012)( a R. Abdullah, Abidin, & Aman, 2012).Then, the frequency of the signal would be estimated directly from frequency sample values that correspond with the peak value. It can be calculated based on the frequency representation of the discrete-time waveform.
Most researchers applied the Periodogram technique on leakage current, fault detection, and bio-medical measurement (Kia, Henao, & Capolino, 2007)(Abidin, Abdullah, Norddin, & Aman, 2012)(Tu, Zeng, Ren, Wu, & Yang, 2004)(Kordkheili, Abravesh, Tabasi, Dakhem, & Abravesh, 2010). Ricardo et al. (Lima, Almeida, Mendes, & Cardoso, 2007) has analyze spectrogram of 1A and 10A load condition with inverter and DC/AC converter. W. Shireen and H.R. Nene
(Shireen & Nene, 2012) experimentally study the Periodogram of fuel cell with and without the active filter circuit condition.
Performance monitoring of PEMFC stacks using periodogram is a new approach for identification analysis. Here, the wave signals generated by varying the supply of inlet hydrogen pressures on a 30W PEMFC stack using the periodogram method are studied. The analytical domain is limited to the effects on open voltage (no load) condition as a platform for future in-depth reporting.
Periodogram analytical model:
Periodogram can be define as (A. R. Abdullah, Saad, & Zuri, 2007):
2 2 2 2
1
( )
( )
T T j ft vS f
v t e
dt
T
(1)From equation (1), SV ( ) can be defined as Periodogram in the frequency domain and V (t) is the voltage waveform. Thus, the root means square voltage (VRMS) can be calculated as:
max max 2 2
( )
f v f rmsV (t)
S f df
(2)Where �max/2 is the maximum frequency of interest and SV ( ) is Periodogram. Direct current voltage (VDC) can be defined as:
2 2
( )
f f DC vV (t)
S f df
(3) Where ∆�/2 is define as power system frequency. Meanwhile, equation (4) shows the alternating current voltage (VAC).2 2
( )
( )
AC RMS DC
V (t)
V t
V t (4)Experimental setup:
Presently, this report presents the online monitoring of various hydrogen pressures on Fuel cell by using Periodogram method. In this experiment, a 14-cells open cathode H-30 Horizon PEMFC stack with 30 watt (W) maximum power rating was used. Dry hydrogen gas (H2) with 99.99% purity and non- humidified has been applied as fuel agent at the anode side. Meanwhile, cathode side utilised air at ambient conditions since this PEMFC is an open cathode type. Table 1 shows the technical specification of the H-30 PEMFC.
Table 1: H-30 PEMFC operation specifications.
Parameter Values
Reactants Hydrogen and Air
Ambient temperature 30oC
Max H2 pressure 0.55 bar
H2 supply pressures (gage) 0.1, 0.2, 0.3, 0.4 & 0.5 bars
H2 purity 99.995% dry H2
H2 flow rate at max output 0.42 L/min
Start-up time 30s at ambient temperature
Efficiency of stack 40% @ at full power
Performance 8.4V @ 3.6A
This experiment varied the hydrogen (H2) pressures between 0.1 bars up to 0.5 bars while maintaining a constant air flow at the cathode side. The hydrogen pressure variation was obtained using a pressure regulator. Every data at various hydrogen pressures are taken at an open voltage condition. For the development of this project, GW-Instek
GDS-3254 oscilloscope was used to capture the waveform signal where the probe is connected to the current collector plates. Figure 1 shows the experimental setup of H-30 PEMFC with oscilloscope and the pressure regulator to vary the pressure of the hydrogen (H2) gas into the anode side.
Fig. 1: Schematic diagram of experimental setup with oscilloscope and pressure regulator.
RESULT AND DISCUSSIONS
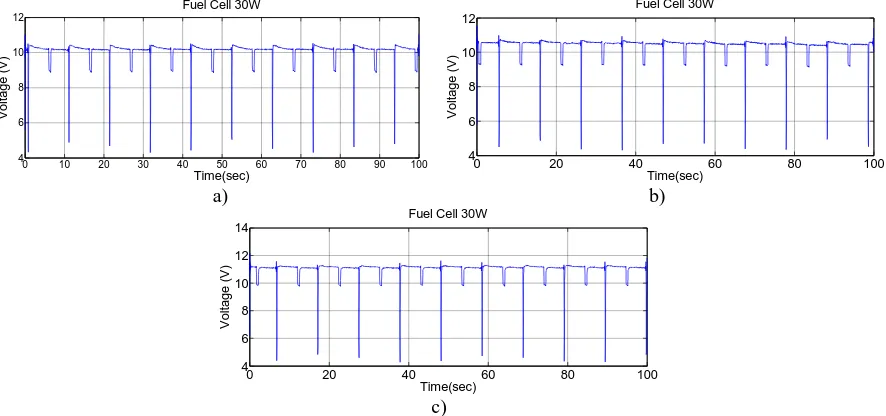
Figure 2 shows the result of an experimental voltage signal over time for 30 W PEMFC at various hydrogen pressure conditions. These figures show a slight decrease in the voltage in a very short period of time this is because of the purging factor that present from the 30W PEMFC. The time taken for the purging factor for these PEMFC is constant for about every 10 second. At 0.1 bar pressure the voltage for 30W PEMFC is 10.44V. After some time, the voltage signal has increased by 0.6% to 10.5V as
the hydrogen pressure shows an increase to 0.2 bar. The voltage for 0.3 bar pressure is then increased for about 2% making it 10.71V. During the condition of 0.4 bar, the voltage shows an increment for 2.14% to 10.94V. A further increase by 2.9% to 11.26V was registered at 0.5 bar H2 pressure. Figure 3 shows the graph effect of hydrogen pressures towards PEMFC voltage at open voltage condition. From this experimental result, it shows that when the H2 inlet pressure increased the voltage signal is also increased.
0 10 20 30 40 50 60 70 80 90 100
4 6 8 10 12
V
o
lta
g
e
(
V
)
Time(sec) Fuel Cell 30W
0 20 40 60 80 100
4 6 8 10 12
V
o
lta
g
e
(
V
)
Time(sec) Fuel Cell 30W
a) b)
0 20 40 60 80 100
4 6 8 10 12 14
V
o
lta
g
e
(
V
)
Time(sec) Fuel Cell 30W
c)
Fig. 3: Effect of pressure towards the PEMFC voltage at open voltage condition.
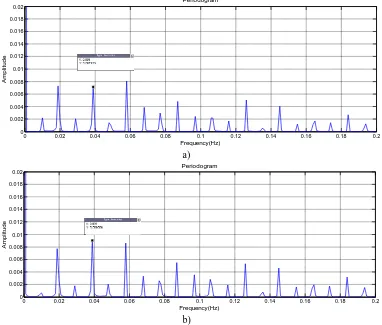
On the other hand, figure 4 shows the Periodogram result for various hydrogen pressure conditions. This figure represents the micro monitoring of the voltage signal that is gained from the oscilloscope. The signal of Periodogram shows the distribution of the waveform signal power for the Y-axis over the frequency (Hz) for the X-axis. Each
signal from the Periodogram figure shows that these signals exist at the same frequency trend. However, the value of amplitude for every different pressure is changed. The result shows that the value of amplitude changes as the hydrogen pressure is changed. It shows that amplitude changes as the existence of VAC which is distortion in the signal.
0 0.02 0.04 0.06 0.08 0.1 0.12 0.14 0.16 0.18 0.2
0 0.002 0.004 0.006 0.008 0.01 0.012 0.014 0.016 0.018 0.02
A
m
p
lit
u
d
e
Frequency(Hz) Periodogram
a)
0 0.02 0.04 0.06 0.08 0.1 0.12 0.14 0.16 0.18 0.2
0 0.002 0.004 0.006 0.008 0.01 0.012 0.014 0.016 0.018 0.02
A
m
p
lit
u
d
e
Frequency(Hz) Periodogram
0 0.02 0.04 0.06 0.08 0.1 0.12 0.14 0.16 0.18 0.2 0
0.002 0.004 0.006 0.008 0.01 0.012 0.014 0.016 0.018 0.02
A
mp
li
tu
d
e
Frequency(Hz) Periodogram
c)
Fig. 4: Periodogram of 30W PEMFC with different of hydrogen (H2) pressure at anode side: a) 0.1 bar H2pressure b) 0.3 bar H2 pressure c) 0.5 bar H2pressure
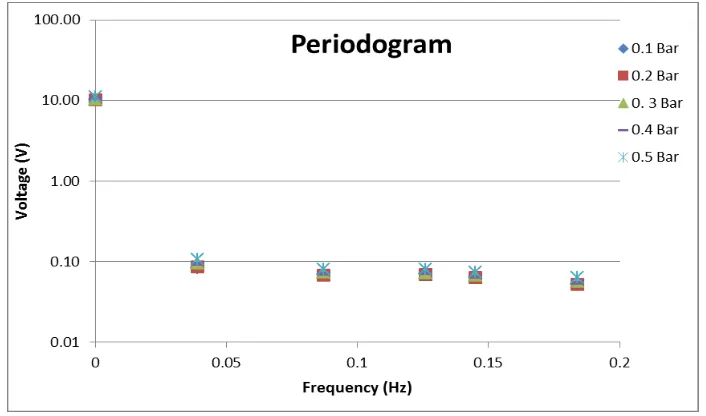
As a consequence, the comparison of the Periodogram data of PEMFC at various hydrogen pressures between 0.1 bar until 0.5 bar is shows in figure 5 by converting the value of amplitude into voltage value. By the side of 0 Hz frequency, it shows the value of DC component of PEMFC. The
value of 0.1 bar hydrogen pressure is 10.11V. Nonetheless, the value is 10.12V for the 0.2 bar pressure. The value is increased to 10.42V when the pressure is increased to 0.3 bar. The pressure of 0.4 bar and 0.5 bar respectively shows the value of 10.66V and 11.03V.
Fig. 5: Comparison Periodogram data of 30W PEMFC with various hydrogen pressures.
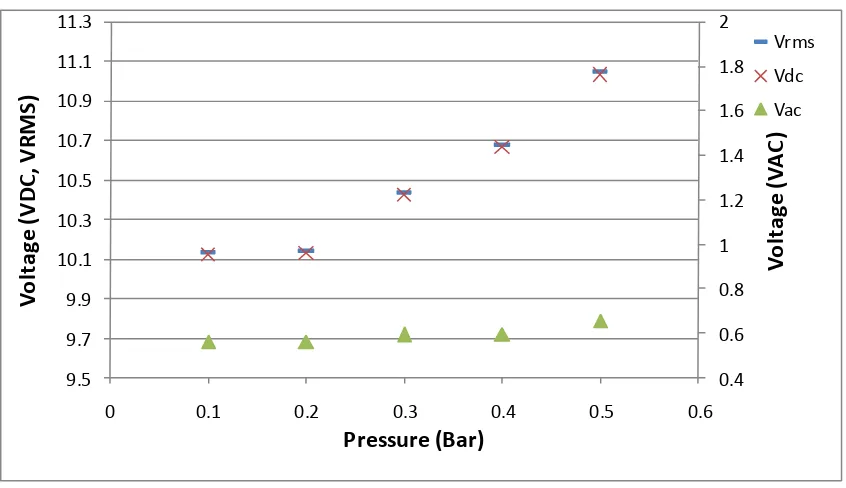
The Periodogram data of VDC, VRMS, and VAC with various hydrogen pressures is presented in figure 6. The value of VDC, VRMS, and VAC shows an increment as the hydrogen pressure is increased from 0.1 bar to 0.5 bar. From the figure, VRMS shows the highest voltage level compare to VDC and VAC. This is because VRMS is the total tolerance voltage while VDC is expected voltage value. Voltage level of VDC is lower than VRMS with a slight different but it is still higher than VAC. Thus, VAC shows the lowest voltage
Fig. 6: Periodogram data of VDC, VRMS, and VAC at various pressures.
Table 2: Periodogram data of the various hydrogen pressure conditions.
Pressure (bar) 0.1 bar 0.2 bar 0.3 bar 0.4 bar 0.5 bar
VRMS 10.1322 10.1419 10.4353 10.6804 11.0493
VDC 10.1167 10.1265 10.4187 10.664 11.0299
VAC 0.5594 0.5582 0.5904 0.5924 0.6539
Conclusion:
An experimental study has been performed to monitor the variety of hydrogen pressures as a fuel on anode side of PEM Fuel cell by using Periodogram. It shows that the voltage performance of the PEMFC is increased as the pressure of hydrogen at the anode side is increased. Therefore, this experiment shows the relationship between the hydrogen pressures at the anode side toward the performance of PEMFC. Apart from that, it indicates that amplitude from the Periodogram data is changed as the pressure of hydrogen is changed. Besides that, the signal characteristic of VDC, VRMS, and VAC also increased as the hydrogen pressure is raised. Thus, it shows that the value of distortion that present in the PEMFC is increased as the hydrogen pressure is increased. Consequently, the signal characteristic of various hydrogen pressures could be well presented by using Periodogram method.
ACKNOWLEDGEMENT
The author would like to acknowledge everyone that gives valuable suggestions, collaboration, and contribute in this research. This research was
supported by grant
[RAGS/2013/FKE/TK02/02/B00025] as awarded by
Universiti Teknikal Malaysia Melaka (UTeM).
REFERENCES
Abdullah, AR., N.Q.Z. Abidin, A. Aman, 2012. Leakage Current Analysis of Polymeric and Non- Polymeric Insulation Using Time Frequency Distribution, (December), pp: 131–136.
Abdullah, A.R., N.M. Saad, A. Zuri, 2007. Power Quality Monitoring System Utilizing Periodogram And Spectrogram Analysis Techniques, pp: 770–774.
Abidin, N.Q.Z., AR. Abdullah, N. Norddin, A. Aman, 2012. Online Leakage Current Monitoring System Using Time- Frequency Distribution on High Voltage Insulator. Power and Energy Conversion Symposium (PECS, (Pecs), pp: 142–147.
Abidin, N.Q.Z., AR. Abdullah, N. Norddin, A. Aman, K.A. Ibrahim, 2012. Leakage Current Analysis on Polymeric Surface Condition using Time-Frequency Distribution. 2012 IEEE International Power Engineering and Optimization Conference (PEOCO2012), (June), pp: 171–175. doi:10.1109/PEOCO.2012.6230855
Ahmad, N.S., A.R. Abdullah, N. Bahari, M.A.A. Hassan, 2014. Switches Faults Analysis of Voltage Source Inverter (VSI) using Short Time Fourier Transform (STFT). International Review on Modelling and Simulations (IREMOS), Vol 7, No.
Andreasen, S.J., J.L. Jespersen, E. Schaltz, S.K. Kær, 2009. Characterisation and modelling of a high temperature PEM fuel cell stack using
0.4 0.6 0.8 1 1.2 1.4 1.6 1.8 2
9.5 9.7 9.9 10.1 10.3 10.5 10.7 10.9 11.1 11.3
0 0.1 0.2 0.3 0.4 0.5 0.6
V
o
lt
a
g
e
(
V
A
C
)
V
o
lt
a
g
e
(
V
D
C
,
V
RMS
)
Pressure (Bar)
Vrms
Vdc
electrochemical impedance spectroscopy. Fuel Cells, 9(4): 463–473. doi:10.1002/fuce.200800137
Atan, R., W.A.N.b.W. Mohamed, 2014. Experimental Cooling Mode Variation Of An Air-Cooled Pem Fuel Cell Using Second-Order Thermal Analysis. Journal of Mechanical Engineering, Vol. 10, Issue 2, 2014., 10(2).
Dhirde, A.M., S. Member, N.V. Dale, H. Salehfar, S. Member, M.D. Mann, T. Han, 2010. Equivalent Electric Circuit Modeling and Performance Analysis of a PEM Fuel Cell Stack Using Impedance Spectroscopy, 25(3): 778–786.
Gao, F., B. Blunier, A. Miraoui, 2012. Proton Exchange Membrane Fuel Cell Modeling. John willey & sons, Ltd (Willey) and ISTE Ltd publication.
Joao Neiva de Figueiredo, M.F.G., 2014. Green Power: Perspectives on Sustainable Electricity Generation. (M. F. G. Joao Neiva de Figueiredo, Ed.). CRC Press Taylor and francis Group.
Khiar, M.S.B.A., M.Z. Razali, S.A. Ghani, Chairul Imran Sutan, 2015. Automated Calculation of Thermodynamic Potential Applied for Proton Exchange Membrane ( PEM ) Fuel Cell, 755: 649– 653. doi:10.4028/www.scientific.net/AMM.754-755.649
Kia, S.H., H. Henao, G.a. Capolino, 2007. A High-Resolution Frequency Estimation Method for Three-Phase Induction Machine Fault Detection. IEEE Transactions on Industrial Electronics, 54(4): 2305–2314. doi:10.1109/TIE.2007.899826
Kordkheili, H.H., H. Abravesh, M. Tabasi, M. Dakhem, M.M. Abravesh, 2010. Determining the
probability of flashover occurrence in composite insulators by using leakage current harmonic components. IEEE Transactions on Dielectrics and Electrical Insulation, 17: 502–512. doi:10.1109/TDEI.2010.5448106
Lima, R.J.S., A.T.de Almeida, A.M.S. Mendes, A.J.M. Cardoso, 2007. High power quality System with Fuel Cell Distributed Generation Simulation and Tests, pp: 2697–2702.
Mishra, V., F. Yang, R. Pitchumani, 2005Analysis and design of PEM fuel cells. Journal of Power Sources, 141(August 2004), 47–64. doi:10.1016/j.jpowsour.2004.08.051
Ryan, O., Cha, suk won, C. Whitney, B.P. Fritz, 2006. Fuel Cell Fundamental. john wiley & sons, INC.
Shireen, W., H.R. Nene, 2012. Input ripple current compensation using DSP control in reliable fuel cell power systems. International Journal of Hydrogen Energy, 37(9): 7807–7813. doi:10.1016/j.ijhydene.2012.01.140
Tu, C.Y., Y.J. Zeng, X.Y. Ren, S.C. Wu, X.C. Yang, 2004. Hybrid processing and time-frequency analysis of ECG signal. Conference Proceedings : ... Annual International Conference of the IEEE Engineering in Medicine and Biology Society. IEEE Engineering in Medicine and Biology Society.
Conference, 1: 361–364.
doi:10.1109/IEMBS.2004.1403167