KINETIC CHANGES OF ANTIOXIDANT CAPACITY AND
PHYSICAL QUALITY OF TEMPE DURING HEATING
ANNA AMANIA KHUSNAYAINI
GRADUATE SCHOOL
BOGOR AGRICULTURAL UNIVERSITY BOGOR
DECLARATION OF THESIS, SOURCE OF INFORMATION,
AND COPYRIGHT
With this I declare that this thesis Kinetic Changes of Antioxidant Capacity and Physical Quality of Tempe During Heating is my own work under the direction of an advisory committee. It has not yet been presented in any form to any education institution. The sources of information published or not yet published by other researchers have been mentioned and listed in the references.
With this I give the copyright of my thesis to Bogor Agricultural University.
RINGKASAN
ANNA AMANIA KHUSNAYAINI. Kinetika Perubahan Kapasitas Antioksidan dan Mutu Fisik Tempe Selama Pemanasan. Dibimbing oleh PURWIYATNO HARIYADI dan ELVIRA SYAMSIR.
Tempe merupakan produk pangan tradisional khas Indonesia yang dihasilkan dari proses fermentasi kacang kedelai dengan kapang Rhizopus spp. dan beberapa jenis kapang lainnya, seperti Mucor spp. Jika dibandingkan dengan kacang kedelai, tempe memiliki kandungan gizi yang lebih baik tetapi masa simpannya lebih pendek. Proses termal dapat diaplikasikan sebagai metode alternatif untuk memperpanjang umur simpan tempe. Akan tetapi, proses ini dapat menyebabkan perubahan pada aspek fisik, gizi, dan sensori. Dalam hal ini, model kinetika dapat digunakan untuk memprediksi perubahan mutu pada beberapa kondisi proses untuk mendapatkan produk yang aman dan memaksimalkan mutu.
Tujuan utama penelitian ini adalah untuk mempelajari kinetika perubahan kapasitas antioksidan dan mutu fisik selama pemanasan tempe dalam kondisi isotermal pada suhu 75, 85 dan 95oC. Potongan tempe (d: 12 mm, t: 20 mm)
dimasukkan ke dalam tabung vial dengan larutan garam (NaCl) 2% sebagai medium pemanas. Perubahan kapasitas antioksidan (kapasitas penangkapan radikal DPPH, kandungan total fenol (TPC), dan total flavonoid (TFC)) serta mutu fisik (analisis profil tekstur (TPA), warna dengan kromameter) dianalisis dan dimodelkan sebagai reaksi ordo satu.
Perlakuan panas dapat mempengaruhi kapasitas antioksidan dan mutu fisik tempe secara signifikan. Selama proses pemanasan laju perubahan kedua parameter tersebut meningkat dengan semakin meningkatnya suhu dan lamanya waktu pemanasan. Kapasitas antioksidan berubah dengan kecenderungan yang sama dengan perubahan TPC. Hal ini mengindikasikan bahwa TPC berpengaruh signifikan terhadap kapasitas antioksidan tempe (p < 0.05). Namun demikian, TFC relatif konstan selama pemanasan.
Tidak semua atribut mutu dapat dimodelkan secara baik sebagai parameter kinetika termal. Hal ini disebabkan karena beberapa parameter tersebut tidak dipengaruhi secara signifikan oleh kondisi proses pemanasan, seperti TFC, hue, elastisitas, kelengketan, kepaduan, dan daya kunyah. Parameter mutu tempe yang sensitif terhadap panas, seperti kapasitas antioksidan, TPC, kekerasan, kecerahan, kekuningan, kehijauan, dan kroma, dapat dimodelkan secara baik sebagai reaksi ordo pertama dengan kecenderungan kurva yang berbeda-beda.
Energi aktivasi menunjukkan tingkat sensitivitas parameter mutu terhadap perubahan suhu. Kemiringan kurva untuk degradasi mutu fisik terlihat lebih tajam daripada kapasitas antioksidan. Hal ini berarti bahwa laju perubahan mutu fisik lebih sensitif terhadap panas daripada parameter lainnya. Berdasarkan perhitungan, energi aktivasi perubahan warna (Ea kehijauan=181.44 kJ/mol, Ea kekuningan=82.75
kJ/mol, Ea kroma=73.95 kJ/mol, dan Ea kecerahan=54.98 kJ/mol) lebih besar daripada
perubahan tekstur kekerasan (44.32 kJ/mol). Energi aktivasi untuk perubahan kapasitas antioksidan lebih kecil (14.68 kJ/mol) daripada TPC (30.16 kJ/mol). Kata kunci: kandungan fenol, kapasitas menangkap DPPH, kekerasan, produk
SUMMARY
ANNA AMANIA KHUSNAYAINI. Kinetic Changes of Antioxidant Capacity and Physical Quality of Tempe During Heating. Supervised by PURWIYATNO HARIYADI and ELVIRA SYAMSIR.
Tempe is an Indonesia traditional food made by fermentation of soybean with Rhizopus spp. and some other moulds, such as Mucor spp. As compared to raw soybean, tempe has improved nutritional value, but has shorter shelf-life. Thermal process might be applied as an alternative method to extend the self-life. However, this process induces some changes to the physical, nutritional, and sensory properties. Kinetic models are required to predict quality changes at different processes to provide a safe product and maximize the quality retention.
The main objective of this research was to study the kinetics of antioxidant capacity and physical changes during isothermal heating of tempe at different temperature (75, 85 and 95oC). Tempe was cut (d: 12 mm, h: 20 mm) and placed in vial tubes with 2% of aqueous salt (NaCl) solution as heating medium. Changes of antioxidant capacity (DPPH scavenging capacity, total phenolic content (TPC), total flavonoid content (TFC)) and physical quality (texture profile analysis (TPA), color by chromamater) of tempe during heating were analyzed and modeled as the first order reaction.
Thermal treatments affected significantly on the antioxidant capacity and physical quality of tempe. During heating the rate of changes in antioxidant capacity and physical quality of tempe increased with increase of time and temperature process. The changes of antioxidant capacity had similar trend to TPC indicating that TPC strongly influenced the antioxidant power of tempe. In the other hand, TFC was relatively constant during heating.
Not all tested quality attributes could be modeled well as thermal kinetic parameters because some of them were not affected significantly by process conditions, such as the total flavonoid content, hue, springiness, stickiness, cohesiveness, and chewiness. The heat sensitive quality parameter of tempe, such as antioxidant capacity, TPC, hardness, lightness, yellowness, greenness, and chroma, could be modeled well as first-order reaction with different tendency.
The activation energy indicated the parameter sensitivity to temperature changes. The slope for degradation of physical properties was sharper than antioxidant capacity indicating that the rate of physical change was more heat sensitive than other parameter. Determination of activation energy from physical attributes showed that activation energies for color changes (Ea greenness=181.44
kJ/mol, Ea yellowness=82.75 kJ/mol, Ea chroma=73.95 kJ/mol, Ea lightness=54.98 kJ/mol)
were greater than textural changes (44.32 kJ/mol). The activation energy for antioxidant capacity (14.68 kJ/mol) was smaller than TPC (30.16 kJ/mol).
© Copyright, IPB 2016
All rights reserved
No part or all of this work may be excerpted without inclusion or mentioning the sources. Exception only for research and education use, writing for scientific papers, reporting, critical writing or reviewing of problems; and this exception does not inflict a financial loss in the proper interest of Bogor Agricultural University.
A Thesis
As a Part of The Requirements for Achieving The Master Degree of Science
in
Food Science Program
KINETIC CHANGES OF ANTIOXIDANT CAPACITY AND
PHYSICAL QUALITY OF TEMPE DURING HEATING
GRADUATE SCHOOL
BOGOR AGRICULTURAL UNIVERSITY BOGOR
2016
ACKNOWLEDGEMENTS
In the name of Allah, the Most Gracious and the Most Merciful
Firstly, my humble praise and gratitude to Allah Almighty; the Most Merciful, the Most Beneficent, for the strengths and His blessing for providing me this opportunity and granting me the capability to proceed successfully.
Thanks for everyone who helped me in completing this work. Special appreciation goes to my main supervisor, Prof Dr Purwiyatno Hariyadi, for his excellect supervision, guidance, advice, and financial supports. Not forgotten, my appreciation to my co-supervisor, Dr Elvira Syamsir, for her support and detailed review during the preparation of this thesis. I would like to express my appreciation to the coordinator of Food Science Program, Prof Ratih Dewanti, for her support and help towards my postgraduate affairs. My acknowledgement also goes to all the technicians and office staffs in Department of Food Science and Technology for their co-operations. Special thanks go to all my classmates of Food Science Program for the friendship and memories.
Last but not least, my deepest gratitude goes to my beloved parents; Mr. Mahmud S. and Mrs. Sri Martiyah and my sisters; Sofia Nabila, and Samara Rahma Dania. They were always supporting and encouranging me with their best wishes. Also not forgetting my husband, Eka Bobby Febrianto, and my sons, Adam Zindani Alfayyad and Azzam Zanki Alfaruq, for their love and care. To those who indirectly contributed in this research, your kindness means a lot to me.
CONTENTS
LIST OF TABLES vi
LIST OF FIGURES vi
LIST OF APPENDICES vi
1 INTRODUCTION 1
1.1 Background 1
1.2 Objectives 2
1.3 Hypothesis 2
1.4 Benefits 2
2 LITERATURE REVIEW 3
2.1 Soybean 3
2.2 Tempe 4
2.3 Antioxidant in Tempe 5
2.4 Antioxidant, Phenolics, and Flavonoids in Food 5
2.5 Effects of Heat on Quality Attributes 6
2.6 Kinetics of Quality Degradation 7
3 METHODS 10
3.1 Materials 10
3.2 Tempe Preparation 10
3.3 Sample Preparation 11
3.4 Temperature Measurement 11
3.5 Thermal Treatments 11
3.6 Extraction of Samples 11
3.7 Radical DPPH Scavenging Capacity 12
3.8 Total Phenolic Content (TPC) 12
3.9 Total Flavonoid Content (TFC) 12
3.10 Textural Analysis 13
3.11 Color Analysis 13
3.12 Kinetic Modeling 13
4 RESULTS AND DISCUSSION 15
4.1 Determination of Lag Time 15
4.2 Effects of Heating on Antioxidant Properties 15
4.3 Effects of Heating on Physical Quality 23
4.4 Kinetic Modeling of Quality Changes 25
4.5 Activation Energy of Quality Changes 29
4.6 Application of Kinetic Data 31
5 CONCLUSIONS AND SUGGESTION 35
5.1 Conclusions 35
REFERENCES 36
LIST OF TABLES
1 Chemical composition of soybean and tempe 3
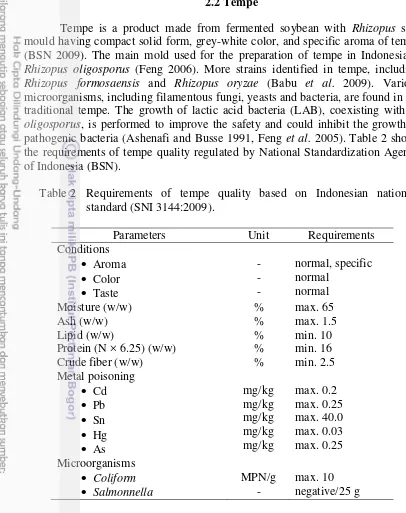
2 Requirements of tempe quality based on Indonesian national standard
(SNI 3144:2009) 4
3 Characteristics of fresh tempe 16
4 Correlations between antioxidant capacity and total
phenolic/flavonoid content 19
5 Activation energy for antioxidant properties and physical quality of
tempe during thermal treatments 31
LIST OF FIGURES
1 a) First order reaction and b) Arrhenius curve 8
2 Diagram of t-T relationship for microbial destruction (F) and cooking
(C) 9
3 The scheme of tempe research 10
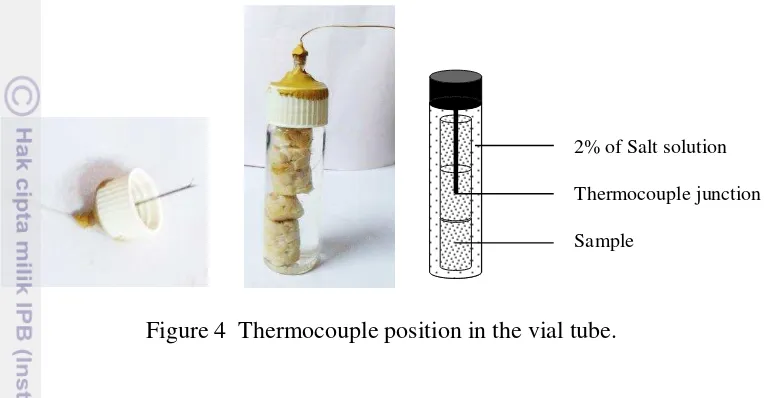
4 Thermocouple position in the vial tube 11
5 Position of sample during TPA 13
6 Heating profiles of tempe center at 75, 85, and 95oC 15
7 Effects of heating on DPPH scavenging capacity of tempe at 75, 85
and 95oC 17
8 Effects of heating on total phenolic content of tempe at 75, 85, and
95oC 18
9 Effects of heating on total flavonoid content of tempe at 75, 85 and
95oC 20
10 Force versus time curves of texture profile analysis during thermal
treatments of tempe 21
11 Effects of heating on hardness, springiness, stickiness, cohesiveness,
and chewiness of tempe at 75, 85, and 95oC 22
12 Effects of heating on lightness, greenness, yellowness, chroma, and
hue of tempe at 75, 85, and 95oC 24
13 Kinetic modeling of DPPH scavenging capacity of tempe during
heating at 75, 85, and 95oC 25 26
14 Kinetic modeling of total phenolic content of tempe during heating at
75, 85, and 95oC 27
15 Kinetic modeling of hardness of during heating at 75, 85, and 95oC 28
16 Kinetic modeling of lightness, greenness, yellowness, and chroma
during heating at 75, 85, and 95oC 29
17 Arrhenius plot for antioxidant properties and physical changes of
tempe at 75, 85, and 95oC 30
LIST OF APPENDICES
1 Standard curve to analysis: a) DPPH scavenging capacity, b) total phenolic content, and c) total flavonoid content 43 2 Correlation analysis between antioxidant capacity and total phenolic
content 44
3 Correlation analysis between antioxidant capacity and total flavonoid
content 48
1
INTRODUCTION
1.1Background
Tempe is an Indonesia traditional food made by fermentation of soybean with Rhizopus spp. and some other moulds, such as Mucor spp. Some enzymes produced during fermentation such as proteases, lipases, carbohydrases, and phytases degrade macromolecules into micromolecules (Nout and Rombouts 1990) contributing to the appearance, aroma, texture, flavor, and nutritional quality of tempe (Wiesel et al. 1997). Fungal biomass growth binds the bean cotyledons together tightly, thus tempe resulted has a firm texture and unique appearance.
After soybean fermentation, the hardness and lightness of tempe decreased, but the antioxidative capacity became higher than the raw soy beans (De Reu et al. 1997, Chang et al. 2009, Handoyo and Morita 2006). Some subtances contributed to improve antioxidant power of tempe, such as free amino acids, peptides, isoflavonoid aglycones, 3-hydroxyanthranilic acid (HAA), and gamma-aminobutyric acid (GABA) (Esaki et al. 1996, Watanabe et al. 2007). Sheih et al. (2000) reported that a thirds of antioxidant capacity in tempe were contributed by aglycone isoflavones and the other two-thirds were contributed by peptides liberated during fermentation.
Furthermore, as compared to soybeans tempe had improved bioactive compounds, such as glucosamine, GABA, folate, vitamin B12, vitamin B6, ergosterol, aglycone isoflavones, and some minerals (Wiesel et al. 1997, Eklund-Jonsson et al. 2006, Feng et al. 2007, Koh et al. 2012, Mo et al. 2013). However, the great healthy benefits of tempe were not balanced with the short shelf-life of tempe. For this reason, thermal process might be applied as an alternative methods to extend the shelf-life because it destroyed microorganisms effectively. On the other hand, thermal treatment induced some changes to the physical, nutritional, and sensory properties of food.
Some researchers stated that thermal treatments affected on quality attributes of soybean products. Boiling yellow soybean flours for 120 min could decrease the lightness and increase the chroma intensity (Xu and Chang 2008). Moreover, thermal processing significantly affected on the antioxidant capacity, total phenolic content (TPC), total flavonoid content (TFC), and total isoflavones in soymilk and yellow soybeans (Huang et al. 2006, Xu and Chang 2008b, Xu and Chang 2009).
2
1.2Objectives
The following objectives were formulated for this study:
1. to evaluate of the effects of process variables (time and temperature) on the antioxidant power (antioxidant capacity, total phenolic content, and total flavonoid content) and physical quality (texture and color) of tempe during heating.
2. to develop a kinetic model of antioxidant capacity and physical quality changes of tempe during heating.
1.3Hypothesis
1. Thermal treatments could change antioxidant capacity, total phenolic content, total flavonoid content, textural, and color quality of tempe. 2. The rate of change in antioxidant capacity, total phenolic content, total
flavonoid content, textural, and color quality of tempe could be modeled well by first order kinetic reaction.
1.4Benefits
1. Understanding how combination of time and temperature could affect on antioxidant power (antioxidant capacity, total phenolic content, total flavonoid content) and physical quality (texture, color) of tempe.
3
2
LITERATURE REVIEW
2.1Soybean
Soybean (Glycine max (L.) Merrill) is a species of legume native to China which is member of the family Leguminosae, subfamily Papilionoideae, and the genus Glycine, L. (Liu 1997). There are two kinds of soybean: yellow soybean coat usually used in Indonesia as raw material of tempe, tofu, bean sprout, and soymilk, and black soybean as main material of soy sauce production (Purwanti 2004). Besides, soy bean is processed into soy protein ingredients including soy flour, concentrates, isolates, and textured soy proteins applied in various types of bakery, dairy, and meat products, infant formulas, and the so-called new generation soyfoods (Liu 1997). Comparation of chemical composition between soybean and tempe is tabulated in Table 1.
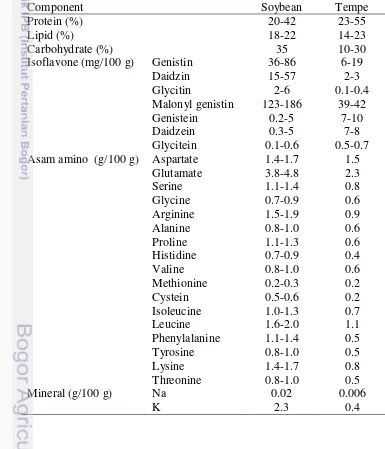
Table 1 Chemical composition of soybean and tempe (Kwon et al. 2010).
Component Soybean Tempe
Protein (%) 20-42 23-55
Lipid (%) 18-22 14-23
Carbohydrate (%) 35 10-30
Isoflavone (mg/100 g) Genistin 36-86 6-19
Daidzin 15-57 2-3
Glycitin 2-6 0.1-0.4
Malonyl genistin 123-186 39-42
4
2.2Tempe
Tempe is a product made from fermented soybean with Rhizopus spp. mould having compact solid form, grey-white color, and specific aroma of tempe (BSN 2009). The main mold used for the preparation of tempe in Indonesia is Rhizopus oligosporus (Feng 2006). More strains identified in tempe, including Rhizopus formosaensis and Rhizopus oryzae (Babu et al. 2009). Various microorganisms, including filamentous fungi, yeasts and bacteria, are found in the traditional tempe. The growth of lactic acid bacteria (LAB), coexisting with R. oligosporus, is performed to improve the safety and could inhibit the growth of pathogenic bacteria (Ashenafi and Busse 1991, Feng et al. 2005). Table 2 shows the requirements of tempe quality regulated by National Standardization Agency of Indonesia (BSN).
Table 2 Requirements of tempe quality based on Indonesian national standard (SNI 3144:2009). boiling the cotelydons, cooling, inoculating them with pure or traditional mixture of starters, and incubating as a solid bed at 25-30oC for 24-72 h (Nout and Kiers
5 In addition to being a source of proteins, tempe has several interesting functional properties from its bioactive compounds. Soy isoflavones are recognized for their benefits to human health, reducing menopause symptoms and lowering the risk of chronic diseases, such as cardiovascular ones, osteoporosis, and breast, prostate and colon cancer (Matsuo et al. 1997, Alekel et al. 2000, Badger et al. 2005, Lee et al. 2005, Ma et al. 2008, Dong and Qin 2011). Tempe also contains gamma amino butyric acid (GABA) which has antihipertensive effects (Aoki et al. 2003, Tsai et al. 2006).
2.3 Antioxidant in Tempe
An antioxidant is any substance that significantly delays or inhibits the oxidation of an oxidizable substrate (Halliwell and Gutteridge 1989, Sies 1993, Halliwell 1995). Antioxidant compounds can scavenge free radicals and increase shelf life by retarding the process of lipid peroxidation, which is one of the major reasons for deterioration of food products during processing and storage (Halliwell 1997). Antioxidants protect the human body from free radicals and ROS effects that can retard the progress of many chronic diseases as well as lipid peroxidation (Gülçin 2012).
Natural antioxidants are found in almost all plants, microorganisms, fungi, and animal tissues (Pokorny 1999). Phenolic compounds are secondary plant metabolites that are thought to be an integral part of both human and animal diets (Gülçin 2006). The predominant of natural antioxidants are phenolic compounds such as tocopherols, flavonoids, phenolic acids, and lignans, as well as carotenoids and ascorbic acid (Ames et al. 1993, Chen et al. 1996, Gülçin 2012). Nitrogeneous compounds such as oligopeptides, proteins, and melanoidins also have antioxidative activity (Chen et al. 1996).
According to Hoppe et al. (1997), tempe is reported to be antioxygenic. Fermentation of tempe causes increased antioxidative capacity (Chang et al. 2009). The antioxidant components of soybean flour have been shown to be isoflavones, phospholipids, tocopherols, amino acids, and peptides (Gyӧrgy et al. 1964, Naim et al. 1974, Naim et al. 1976, Hayes et al. 1977, Murakami et al. 1984). The predominant isoflavones in tempe were genistein (5,7,4’-trihydroxyisoflavone) and daidzein (7,4’-dihydroxyisoflavone), produced by digesting genistin and daidzin with β-glucosidase during fermentation (Murakami et al. 1984). Isoflavones contributed only one-thirds of the antioxidative capacity in tempe and the other two-thirds were contributed by the peptides derived from proteolyzing soy proteins (Sheih et al. 2000). Esaki et al. (1996) found 3-hydroxyanthranilic acid (HAA) as another antioxidative substance formed in tempe.
2.4 Antioxidant, Phenolics, and Flavonoids in Food
6
2006). Quantification of antioxidant capacity in the foods can be determined by DPPH (2,2-diphenyl-1-picrylhydrazyl) scavenging capacity assay. This method is based on the reduction of DPPH in alcoholic solution in the presence of a hydrogen-donating antioxidant due to the formation of the non-radical form DPPH-H in the reaction. The antioxidants were able to reduce the stable free radical DPPH to the yellow coloured diphenyl-picrylhydrazine showing a maximum absorbance at 517 nm (Gülçin 2012). When DPPH radicals encounter a proton-donor substrate such as an antioxidant, the radicals would be scavenged and the absorbance is reduced (Blois 1958, Gülçin et al. 2009).
Plant phenolics have been one of the major groups of primary antioxidant compounds acting as reducing agents, hydrogen atom donators, singlet oxygen scavengers, and transition metal ion chelators (Rice-Evans et al. 1996, Karaman et al. 2009, Gülçin 2012). The FCR (Folin-Ciocalteu Reducing) assay has been used to measure a total phenolics in the products (Prior et al. 2005), relying on the transfer of electrons from phenolic compounds to the FCR in alkaline medium forming blue complexes that can be detected spectrophotometrically at 750–765 nm (Singleton and Rossi 1965, Singleton et al. 1999, Cai et al. 2004, Song et al.
2010). FCR or Folin’s phenol reagent is a mixture of phosphomolybdate and
phosphotungstate used for the colorimetric assay of phenolic and polyphenolic antioxidants (Singleton et al. 1999).
Flavonoids are naturally phenolic antioxidants occuring in living cells as glycosides and may break down to their respective aglycone and sugar by enzymes or acid-heat treatments (Shahidi et al.1992, Yao et al. 2004). Antioxidant mechanisms of flavonoids were divided into free radical chain breaking, metal chelating, and singlet oxygen quenching, with the inhibition of enzymatic activity (Clifford and Cuppett 2000). The total flavonoid contents (TFC) was estimated by colorimetric assay involving Al(III)-flavonoid complexes formed in solution (Deng and Van Berkel 1998).
2.5 Effects of Heat on Quality Attributes
Term quality is refered to the composite of the characteristics that differentiate individual units of a product and have significance in determining the consumer acceptability (Kramer and Twigg 1966), such as color, texture, nutritional
value, and sensory attributes. Quality loss involves both subjective factors like taste that cannot be readily quantified, and quantifiable factors such as nutrient degradation (Awuah et al. 2007). Despite destroying microorganisms effectively, thermal processing can induce permanent changes to the nutritional and sensory attributes of foods depending on the process severity.
7 soybean (Gandhi and Bourne 1991, Xu and Chang 2008b), tempe (Handoyo and
Morita 2006).
Thermal softening can be due to changes in cell wall matrix polysaccharides (celluloses, hemicelluloses, pectins etc.) which depend on many factors such as pH, types and amounts of various salts present in the plant cell wall. Water uptake by polysaccharides results in reduction of cohesiveness of cell wall matrix thereby resulting in lower adhesion. Other reason for softening is due to loss of turgor pressure which is pressure of cell components against the cell wall and it is due to the water content inside the cell (Lund 1982). The thermal treatments can result in plasmolysis which reduces the turgor pressure and it is responsible for softening of food (Rao and Lund 1986).
Thermal processing influences the nutritional value of some food products by changing the total of antioxidant capacity. Boiled and steamed eclipse black beans exhibited significantly lower antioxidant activities than raw beans in total phenolic content (TPC), DPPH free radical scavenging activity (DPPH), and oxygen radical absorbing capacity (ORAC) (Xu and Chang 2008a). As compared to the raw soybeans, all processing methods caused significant decreases in TPC, DPPH, ORAC, total flavonoid content (TFC), condensed tannin content (CTC), monomeric anthocyanin content (MAC), and ferric reducing antioxidant power (FRAP), and in black soybeans (Xu and Chang 2008b).
In the other hand, thermal processing elevated total antioxidant activity and bioaccessible lycopene content in tomatoes and produced no significant changes in TPC and TFC. The increase in total antioxidant activity of the heat-processed tomatoes was due to the increased amount of lycopene as a major phytochemical in tomatoes and other bound phytochemicals released from the cell matrix (Dewanto et al. 2002). However, high pressure processed tomato and carrot purées had significantly higher antioxidant capacities when compared to thermally treated samples (Patras et al. 2009).
2.6 Kinetics of Quality Degradation
8
where Ct is the concentration at time (t), C0 is the initial concentration, t is time,
and k is rate constant.
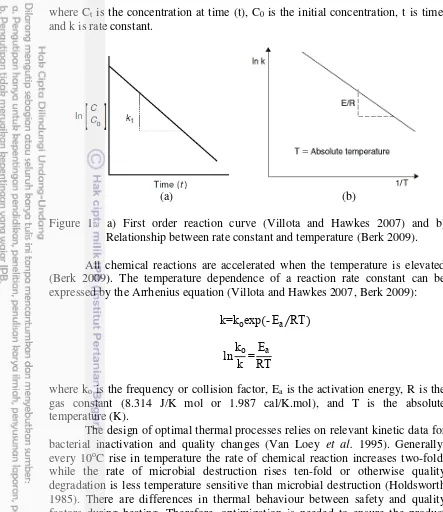
(a) (b)
Figure 1 a) First order reaction curve (Villota and Hawkes 2007) and b) Relationship between rate constant and temperature (Berk 2009). All chemical reactions are accelerated when the temperature is elevated (Berk 2009). The temperature dependence of a reaction rate constant can be expressed by the Arrhenius equation (Villota and Hawkes 2007, Berk 2009):
k=koexp - Ea⁄RT
lnkko=RTEa
where ko is the frequency or collision factor, Ea is the activation energy, R is the
gas constant (8.314 J/K mol or 1.987 cal/K.mol), and T is the absolute temperature (K).
The design of optimal thermal processes relies on relevant kinetic data for bacterial inactivation and quality changes (Van Loey et al. 1995). Generally, every 10oC rise in temperature the rate of chemical reaction increases two-fold, while the rate of microbial destruction rises ten-fold or otherwise quality degradation is less temperature sensitive than microbial destruction (Holdsworth 1985). There are differences in thermal behaviour between safety and quality factors during heating. Therefore, optimization is needed to ensure the product safety and maximize retention of quality attributes.
9 Figure 2 represents the effect of different time–temperature combinations on quality retention and microbial inactivation for thermal process. It can be seen from the graph that the acceptable combinations of time and temperature for thermal process fall within the sterile area. Heating of a product in non-sterile area was unacceptable because the microbiological requirements was not achievable.
Figure 2 Diagram of t-T relationship for microbial destruction (F) and cooking
10
3
METHODS
3.1Materials
Yellow-seeded soybean (Glycine max L.) was obtained from Organization of Tempe and Tofu Producers (KOPTI) Bogor, Indonesia. A commercial powdered tempe starter (Raprima brand, Bandung, Indonesia) was used for tempe making. This was stored at 5oC, dry and in the dark. All chemicals used were
pro-analysis grade purchased from Sigma Chemical Co. (St. Louis, Mo., U. S. A) and Merck KgaA (Darmstadt, Germany). The scheme of research is given in Figure 3.
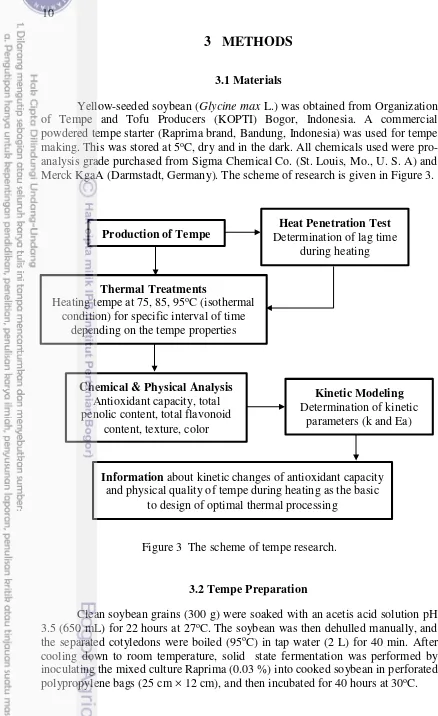
Figure 3 The scheme of tempe research.
3.2Tempe Preparation
Clean soybean grains (300 g) were soaked with an acetis acid solution pH 3.5 (650 mL) for 22 hours at 27oC. The soybean was then dehulled manually, and
the separated cotyledons were boiled (95oC) in tap water (2 L) for 40 min. After cooling down to room temperature, solid state fermentation was performed by inoculating the mixed culture Raprima (0.03 %) into cooked soybean in perforated polypropylene bags (25 cm × 12 cm), and then incubated for 40 hours at 30oC.
Production of Tempe Determination of lag time Heat Penetration Test during heating
Thermal Treatments
Heating tempe at 75, 85, 95oC (isothermal condition) for specific interval of time
depending on the tempe properties
Chemical & Physical Analysis Antioxidant capacity, total penolic content, total flavonoid
content, texture, color
Kinetic Modeling Determination of kinetic
parameters (k and Ea)
Information about kinetic changes of antioxidant capacity and physical quality of tempe during heating as the basic
11 3.3Sample Preparation
Fresh tempe was cut into cylindrical shape with diameter of 12 mm and height of 20 mm. Three tempe cuts (± 6 g) were placed in vial tubes (d: 20 mm, h: 75 mm) considering to minimize lag time. Before closing the tube, 2% of aqueous salt (NaCl) solution (± 20 mL) was added, which was usually used as heating medium in thermal process.
Figure 4 Thermocouple position in the vial tube.
3.4Temperature Measurement
Coper thermocouple wires were introduced into the center of the cylinders such that the thermocouple junction was placed at the geometrical center of the vial where it was a coldest point (Figure 4). Thermocouples were connected to a thermorecorder to record the temperature readings at regular intervals of 1 min for 1 h. A water bath (Gesellschaft für Labortechnik, Germany) set at three different temperatures (75, 85, and 95oC) was used. Heating profiles of instrument and samples were used to evaluate the process lag time.
3.5Thermal Treatments
Samples were heated in water bath (Gesellschaft für Labortechnik, Germany) set at three different temperature (75, 85, and 95oC) after lag time in isothermal condition. Process time for chemical, textural, and color analysis was 120, 30, and 12 min, respectively. Following the heat treatments, samples were immediately cooled in ice water to minimize quality deteration during cooling. For chemical analysis tempe and the salt solution were separated and freeze-dried, whereas for physical analysis only tempe were determined.
3.6Extraction of Samples
The freeze-dried samples were accurately weighed into centrifuge tubes and extracted with 50% acetone and 80% acetone (1:5, w/v). Solvents were selected according to a solvent comparison study by Xu and Chang (2007), which
Thermocouple junction 2% of Salt solution
12
found 50% acetone extracts exhibited the highest TPC values and 80% acetone the highest DPPH scavenging capacity and TFC values for yellow soybean. The sample flour-solvent mixtures were vortexed 16 times during 4 h of extraction according to Ferreira et al. (2011). The tubes were then centrifuged by 5810R Centrifuge (Hamburg, Germany) at 3000 rpm for 10 min, and the extracts were stored at 5oC in the dark for use.
3.7Radical DPPH Scavenging Capacity
The DPPH (2,2-diphenyl-1-picrylhydrazyl) power of samples were evaluated according to the method of Xu and Chang (2007). The sample extract (0.2 mL) was added to 3.8 mL ethanol solution of DPPH radical (0.1 mM). The mixture was vortexed vigorously for 1 min and then kept at room temperature in the dark for 30 min. The absorbance of samples was measured using a UV-Visible Spectrophotometer (U-2900, Hitachi, Tokyo, Japan) at 517 nm against ethanol as a blank. A negative control was mixture of DPPH solution and extraction solvent. The inhibitory percentage of DPPH was calculated according to the following equation:
Inhibition (%) = [1 – (Asample/Acontrol)] × 100
The DPPH free radical scavenging capacity was expressed as millimoles of ascorbic acid equivalent per gram of freeze-dried sample (mmol of AAE/g). The standard calibration curve range was 10 to 1000 μM (R2 = 0.996).
3.8Total Phenolic Content (TPC)
Total soluble phenolics in the extracts were determined using a Folin-Ciocalteu assay as described by Xu and Chang (2007). The sample extract (50 μL), distilled water (3 mL), Folin-Ciocalteu’s reagents (250 μL), and 7% NaCO3 (750μL) were vortexed and allowed to stand for 8 min at room temperature. Thereafter, distilled water (950 μL) was added to the mixture and the absorbance was read using the U-2900 Spectrophotometer at 765 nm after 2 h of incubation against distilled water blank. The TPC was expressed as milligrams of gallic acid equivalents per gram of freeze-dried sample (mg of GAE/g). The TPC was expressed as milligrams of gallic acid equivalents per gram of freeze-dried sample (mg of GAE/g). The standard calibration curve range was 10 to 1000 μM (R2 = 0.998).
3.9 Total Flavonoid Content (TFC)
The TFC was determined using a colorimetric method described by Xu and Chang (2007). The sample extract (0.25 mL), distilled water (1.25 mL), and 5% NaNO2 solution (75μL) were mixed in a test tube and kept for 6 min of
incubation. Then, 150 μL of 10% AlCl3·6H2O solution was added to the mixture.
13 vortexed well. The absorbance was measured at 510 nm using an UV-visible spectrophotometer (U-2900, Hitachi). The TFC was expressed as milligrams of catechin equivalents per gram of freeze-dried sample (mg of CAE/g). The standard calibration curve range was 5 to 500 μM (R2 = 0.999).
3.10 Textural Analysis
The texture measurement was accomplished by using TA-XT2i Texture Analyzer (Stable Micro Systems Ltd., Godalming, Surrey, UK) with cylindrical probe (d: 30 mm, h: 50 mm), by performing texture profile analysis (TPA). Tempe were compressed to 50% of their original height by two compressions. Texture profile was generated by keeping pre-test, test, and post-test speeds of 2, 1, and 2 mm/s respectively. The waiting time between the two-cycles of the TPA test was 5 s. Textural parameters such as hardness, springiness, stickiness, cohesiveness, and chewiness were evaluated by using Texture Expert 1.22 software.
Figure 5 Position of sample during TPA.
3.11 Color Analysis
Analysis of visual color was performed by using CR310 Chromameter (Konica, Minolta, Tokyo, Japan). Hunter’s color parameters (L, a, and b values) for the surface of treated tempe were recorded. The L value indicated lightness (0 to 100), a, the red (+) or green (−) coordinate, and b, the yellow (+) or blue (−) coordinate. (−). The limits for a and b are + or −80. The hue (h) and chroma (C) were calculated according to the following equations (Wrolstad and Smith 2010):
h = tan-1 b a⁄ C =1/2√(a2+b2)
3.12 Kinetic Modeling
In this study the changes of quality attributes during thermal process were described as first-order reaction characterized by logarithmic relationship between concentration of food quality and time that is expressed mathematically as follows (Van Boekel 2008):
Force
14
-ln(CCt
0)=kt
where Ct is the concentration at time (t), C0 is the initial concentration t is time,
and k is rate constant.
The temperature dependence of a reaction rate constant can be expressed by the Arrhenius equation (Van Boekel 2008):
k=koexp - Ea⁄RT
where ko is the frequency or collision factor, Ea is the activation energy, R is the
15
4
RESULTS AND DISCUSSION
4.1Determination of Lag Time
The heat transfer of tempe took place from water (waterbath heating medium) to salt solution through the vial glass surface. Convection heat transfer was at the outside and inside surface of the vial and conduction was through the vial wall. Then, the heat traveled through the 2% of salt solution to the tempe surface via convection and furthermore, the conductive heat transfer took place from the surface to the center of tempe.
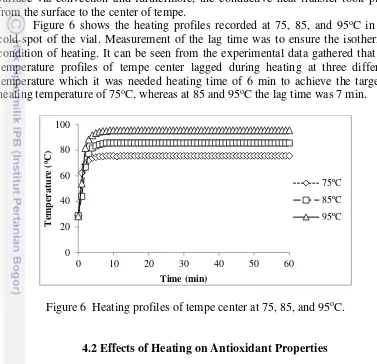
Figure 6 shows the heating profiles recorded at 75, 85, and 95oC in the
cold spot of the vial. Measurement of the lag time was to ensure the isothermal condition of heating. It can be seen from the experimental data gathered that the temperature profiles of tempe center lagged during heating at three different temperature which it was needed heating time of 6 min to achieve the targeted heating temperature of 75oC, whereas at 85 and 95oC the lag time was 7 min.
Figure 6 Heating profiles of tempe center at 75, 85, and 95oC.
4.2Effects of Heating on Antioxidant Properties
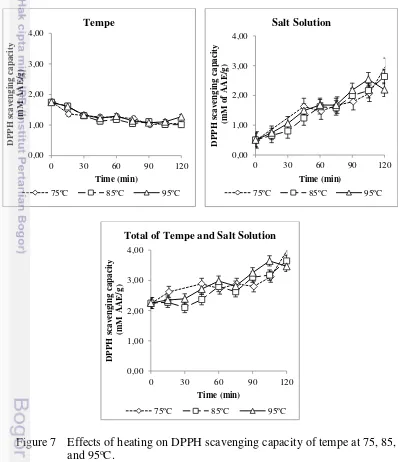
4.2.1 Antioxidant Capacity
The DPPH assay measures against the 2,2-diphenyl-1-picryhydrazyl radical which is reduced to the yellow coloured in alcoholic solution in the presence of a hydrogen-donating antioxidant due to the formation of the non-radical form DPPH-H (Gülçin 2012). The fresh tempe used in this study had antioxidant capacity of 2.00 mM of AAE/g (see Table 3). The effect of heating at three different temperatures (75, 85, and 95oC) on radical DPPH scavenging
capacity of fresh tempe is shown in Figure 7. Heating samples increased the total amount of antioxidant capacity in total of tempe-salt solution. The increase of antioxidant power also occured only in salt solution, whereas antioxidant capacity decreased in tempe during heating period of 120 min.
16
A similar pattern had been reported for ultra high temperature (UHT) process of soymilk (Xu and Chang 2009), pasteurization of tea extracts (Manzocco et al. 1998), and steaming of several vegetables such as carrots, spinach, mushrooms, asparagus, broccoli, cabbage, red cabbage, green and red peppers, potatoes and soybeans (Halvorsen et al. 2006), which showed an increase in the antioxidant capacity. The steaming process significantly increased about 75-140% DPPH values of antioxidant capacity in yellow soybeans as compared to the raw soybeans (Xu and Chang 2008).
Table 3 Characteristics of fresh tempea.
Parameters Unit Value
Antioxidant capacity mM of AAE/g 2.00 ± 0.03 Total phenolic content mg of GAE/g 1.45 ± 0.01
aData are expressed as average ± standard error of mean (SEM).
According to Sheih et al. (2000) that two-thirds of antioxidant capacity in tempe was contributed by peptides. Tempe containted 17 amino acids (Kwon et al. 2010), which tyrosine, phenylalanine, cysteine, lysine, arginine, aspartate, glutamate, histidine, glycine and proline were suggested playing important role in antioxidant power of soybean (Chen et al. 1996, Fang et al. 2002, Hu et al. 2003, Je et al. 2004, Rajapakse et al. 2005, Riison et al. 1980 Saiga et al. 2003). Soybean protein isolate conducted denaturation at 76.5oC with high water content (Kitabatake et al. 1990). However, antioxidant capacity of protein and amino acids was relatively constant during thermal treatments (Arcan and Yemeniciog˘lu 2007).
17 isoflavones, but significantly decreased the content of the malonylglucoside forms (malonyldaidzin, malonylglycitin, and malonylgenistin) (Xu and Chang 2008). Therefore, this research indicated that isoflavones from phenolic group obtained from 80% acetone extract were the responsible components affecting the changes of antioxidant capacity of tempe during heating.
On the other hand, the decline of antioxidant compounds in tempe was due to the increase of water soluble antioxidant subtances to 2% of salt solution. Thermal process might decrease firmness and adhesion of cell walls (Van Buren 1979), thus it induced releasing bound phenolic compounds, such as flavonoids, accumulated in the vacuoles (Brecht et al. 2008). Briefly, as longer heating time and higher temperature, the bound antioxidant components were more liberated from cell and leached into salt solution.
18
4.2.2 Total Phenolic Content
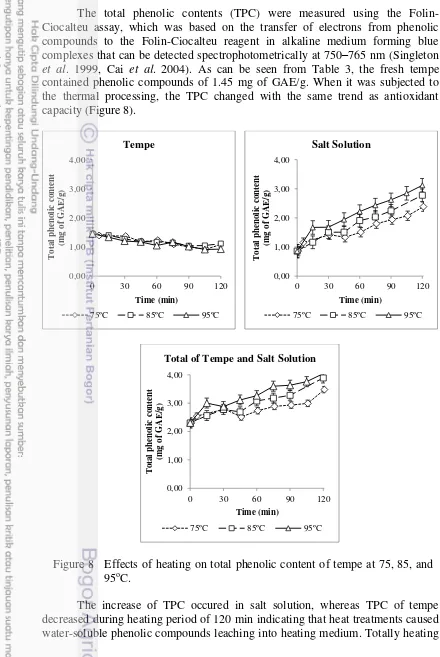
The total phenolic contents (TPC) were measured using the Folin-Ciocalteu assay, which was based on the transfer of electrons from phenolic compounds to the Folin-Ciocalteu reagent in alkaline medium forming blue complexes that can be detected spectrophotometrically at 750–765 nm (Singleton et al. 1999, Cai et al. 2004). As can be seen from Table 3, the fresh tempe contained phenolic compounds of 1.45 mg of GAE/g. When it was subjected to the thermal processing, the TPC changed with the same trend as antioxidant capacity (Figure 8).
Figure 8 Effects of heating on total phenolic content of tempe at 75, 85, and 95oC.
The increase of TPC occured in salt solution, whereas TPC of tempe decreased during heating period of 120 min indicating that heat treatments caused water-soluble phenolic compounds leaching into heating medium. Totally heating
19 of samples increased the total amount of TPC in tempe and salt solution. Heating of tempe might cause the degradation of polyphenols and release of bound phenolic compositions from the vacuoles (Brecht et al. 2008). According to correlation analysis (see Table 4), there were significant correlations between TPC and DPPH scavenging capacity (p < 0.05) at 75, 85, and 95oC in all components
of samples. It can be assumed that phenolic compounds strongly influenced the antioxidant capacity of tempe.
The changes of phenolic content in tempe was affected by composition of phenolic acids. Raw and boiled yellow soybean contained free phenolic acids both benzoic type, such as gallic acid, 2,3,4-trihydroxybenzoic acid, vanillic acid and protocatechualdehyde, and cinnamic type, such as chlorogenic, sinapic, and trans-cinnamic acid. Moreover, conjugated phenolic acids were also detected in both raw and boiled yellow soybean, such as benzoic type (gallic, protocatechuic, 2,3,4-rihydroxybenzoic, p-hydroxybenzoic, gentistic, syringic, vanillic acid, protocatechualdehyde and vanillin) and cinnamic type (caffeic, p-coumaric, m-coumaric, o-m-coumaric, sinapic and trans-cinnamic acid) (Xu and Chang 2008).
Thermal processing caused complex variations in phenolic acid profiles of soy products. For instance, boiling soymilk caused significant increases in free gallic, protocatechuic, 2,3,4-trihydroxybenzoic, sinapic acid, and subtotal benzoic acids (Xu and Chang 2009), whereas boiling treatment of yellow soybean significantly increased 2,3,4-trihydroxybenzoic acid (Xu and Chang 2008). In addition, pressure steaming of yellow soybeans caused the increase of benzoic acid about 23% and also the TPC value about 35%. The elevated total phenolic values were correlated to the release of phenolic substances with reactivity toward Folin-Ciocalteu reagent from polymerized structural substances in cell walls upon thermal processing (Xu and Chang 2008).
Table 4 Correlations between antioxidant capacity and total phenolic/ flavonoid content.
a *correlation is significant at the 0.05 level.
4.2.3 Total Flavonoid Content
20
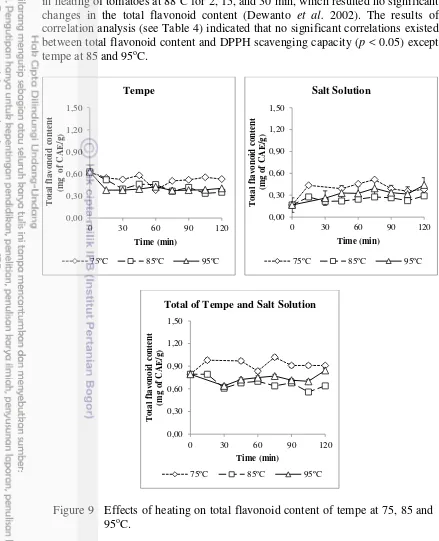
in heating of tomatoes at 88oC for 2, 15, and 30 min, which resulted no significant
changes in the total flavonoid content (Dewanto et al. 2002). The results of correlation analysis (see Table 4) indicated that no significant correlations existed between total flavonoid content and DPPH scavenging capacity (p < 0.05) except tempe at 85 and 95oC.
Figure 9 Effects of heating on total flavonoid content of tempe at 75, 85 and 95oC.
21 methods were required to study the trend of changes in total flavonoid components, such as (High Performance Liquid Chromatoraphy) HPLC.
The predominant flavonoid compounds in soybean are isoflavones which its retention and distribution were significantly affected by thermal processing (Xu and Chang 2008, Xu and Chang 2009). Although the TFC in this study was relatively constant, the antioxidant capacity from 80% acetone extract elevated during heating at 75, 85, and 95oC (see Figure 7). These findings indicated that thermal treatments transformed some compounds which had lower antioxidant status to higher antioxidant power (Xu and Chang 2009). The aglycone forms of isoflavones had stronger antioxidant capacity than the glucosides (Hayes et al. 1977, Pratt and Stafforini 1979).
75oC 85oC
95oC
22
23 4.3Effects of Heating on Physical Quality
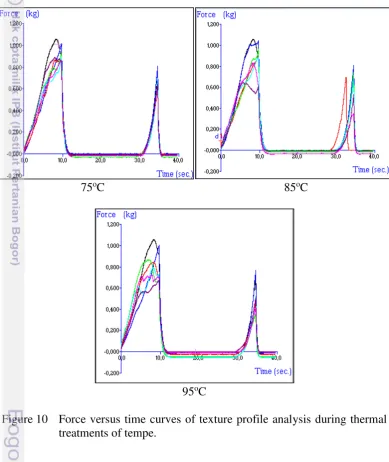
4.3.1 Textural Profiles
Texture profile analysis (TPA) basically simulates the mastication process of humans to give force versus time curves as a function of deformation. Before heating the fresh tempe had textural characteristics as followed: 1.19 kg of hardness, 0.38 of springiness, 0.21 of stickiness, 0.22 of cohesiveness, and 0.14 of chewiness. Thermal processing effectively impacted on hardness, whereas other parameters, such as springiness, stickiness, cohesiveness, and chewiness, were remainly constant when subjected to heating for 30 min (Figure 11).
The main texture attribute of vegetables is hardness or firmness (Bourne 1989) because it has the best correlation to the consumer acceptance (Bourne 1982). According to force-time curves (see Figure 10), hardness is the maximum force needed to compress the sample. Most published studies have described thermal degradation of texture based on hardness characteristic and it is possible to model changes based on other properties, but their relation to consumer perception has not been well established (Rizvi and Tong 1997).
The firmness of various bean was strongly correlated with soluble pectin content increasing due to thermal treatment (Huang and Bourne 1983). Intercellular adhesive material, such as pectin, held the firm texture of cell wall structure. When broken by heat, the pectin was depolymerized, so the resistance of plant tissue to fracturability loss decreased during heating (Loh and Breene 1982). In addition, thermal treatments resulted in plasmolysis which reduces the turgor pressure of cell wall and caused softening texture (Rao and Lund 1986). The presence of salt (NaCl) in the medium accelerated the solubility of pectin (Van Buren 1986). Hence, the more salt dissolved in solution, the texture of tempe became softer.
4.3.2 Visual Appearance
24
25 According to Clydesdale and Ahmed (1978), object-light interactions may affect on color measurement of samples, such as reflection from the surface, refraction into the object, transmission through the object, diffusion, and absorption within the object. Heating tempe in salt solution caused the increase of water content entering into the tissue. When the source light from chromameter came on the tempe surface, it would be resulted increasing intensity of object-light interactions. In this way, increasing water content of tempe produced the more reflected light from the tempe surface. This might increase the lightness of tempe and change the other color propeties.
The change of chroma and hue parameters corresponded to the intensity of yellowness and greenness. The elevation of hue angle was influenced by the increase of yellowness and the decrease of greenness intensity. The chroma had almost similar value to yellowness. Hence, the reduction of greenness value did not significantly affected on the chroma of tempe.
A food system which contain a carbonyl group of reducing sugar and an amine group of free amino acids subjected to high temperature treatment should experience the Maillard reaction involving the formation of brown pigmen (Kim and Lee 2009). It is well known that tempe contains high protein (23-55%) and also some sugars (Kwon et al. 2010). When tempe was heated for certain time, the carbonyl group and amine group might interact to form brown color of Maillard reaction. But, the presence of salt in heating medium could decrease the rate of Maillard Reaction due to the decrease of water activity value (BeMiller and Huber 2008). Therefore, it can be assumed that the use of 2% salt solution as heating medium might be effectively retain the visual appearance of tempe.
4.4Kinetic Modeling of Quality Changes
Kinetic modeling is one of the quantitative modeling used as indicators of food quality degradation. A systematic way is done to stimulate an appropriate design process, thus the quality retention of product can be managed well (Van Boekel 2008). According to Hindra and Baik (2006), the rate of quality change strongly relates with to two main factors, product composition (moisture content, water activity, pH, etc.) and environmental factors (time, temperature, etc.). Furthermore, kinetic order reaction is determined by the characteristics of chemical reaction in the product. Most heat induced reactions are assumed to obey first order kinetic which the reaction rate is proportional to the reactant concentration or quality properties (Holdsworth and Simpson 2007).
26
Figure 13 Kinetic modeling of DPPH scavenging capacity of tempe during heating at 75, 85, and 95oC.
The effects of heating at three different temperatures (75, 85, and 95oC) on radical DPPH scavenging capacity of tempe are shown in Figure 13. The results of spectrophotometric analysis indicated an increase in antioxidant capacity of total of tempe-salt solution and only salt solution due to thermal treatments. In contrast, antioxidant capacity of tempe decreased for 120 min during heating period, but the rate of decreasing antioxidant capacity in tempe increased with increase of temperature (k75=0.0050, k85=0.0051, and k95=0.0052 min-1). On the
other hand, the rate of increasing antioxidant capacity in salt solution (k75=0.0145,
k85=0.0150, and k95=0.0174 min-1) was greater than in total of tempe-salt solution
(k75=0.0025, k85=0.0026, and k95=0.0033 min-1). Totally the thermal treatments of
27 compared to at 95oC. It can be assumed that the rate constant of antioxidant
capacity significantly changed at temperature up to 85oC for 120 min.
Figure 14 Kinetic modeling of total phenolic content of tempe during heating at 75, 85, and 95oC.
28
k85=0.0111, and k95=0.0134 min-1) than in total of tempe-salt solution
(k75=0.0029, k85=0.0043, and k95=0.0051 min-1).
Figure 15 Kinetic modeling of hardness of during heating at 75, 85, and 95oC.
Figure 15 presents hardness parameter (kg) of the samples at three different temperatures. Generally thermal softening in fruits and vegetables was expressed as the first order rate with the firmness as the primary texture attribute (Bourne 1987). The force required to compress tempe decreased during 30 min of thermal treatments. As temperature evelated, the rate of softening tempe increased (k75=0.0075, k85=0.0126, and k95=0.0165 min-1) which at 95oC textural
degradation occured most rapidly. Thermal process affected on turgor cell and changes in wall-pectin composition leading to a decrease in firmness (Revilla and Vivar-Quintana 2008, Van Buren 1986).
Typical results on the changes of color parameters of tempe surface for 12 min at different temperatures are shown in Figure 16. The lightness (L), yellowness (b) and chroma (C) value increased, but the greenness (a) tended to decline during thermal processing. It can be seen from the graphs that the rate of changes in color attribute at 95oC occured most rapidly, followed by heating at 85oCand lastly at 75oC. The increase rate of yellowness (k75=0.0028, k85=0.0076,
and k95=0.0132 min-1) and chroma (k75=0.0033, k85=0.0078, and k95=0.0132 min -1) occured more rapidly as compared to lightness (k
75=0.0005, k85=0.0010, and
k95=0.0014 min-1) for 12 min of heating. On the other hand, the rate of decreasing
in greenness was the greatest (k75=0.0070, k85=0.0126, and k95=0.0207 min-1)
among other color parameters. The chroma influenced by yellowness and greenness had almost similar value to yellowness intensity. Hence, the reduction of greenness value did not significantly affected on the chroma of tempe.
29
Figure 16 Kinetic modeling of lightness, greenness, yellowness, and chroma during heating at 75, 85, and 95oC.
4.5Activation Energy of Quality Changes
The Arrhenius equation described the effects of typical temperature ranges on tempe attribute changes during thermal process. This model is to regress the natural logarithm of the reaction rate constant, Ink, versus the reciprocal of the absolute temperature, 1/T, to obtain the estimates of Ink0, the intercept and Ea/R,
the slope index of the regression line (Van Loey et al. 1995). The Arrhenius plot of antioxidant activity and physical changes of tempe is given in Figure 17. It can be seen from the curves that the slope for degradation of physical properties was
30
sharper than antioxidant capacity indicating that the rate of physical change was more heat sensitive than other parameter.
The activation energy (Ea) (Table 5), which represents the least amount of
energy needed for a chemical reaction to take place, was calculated by the slope of curves (Ea/R). The activation energy also indicated the parameter sensitivity to
31 capacity of tempe. A positive value of Ea means that the reaction rate increases
with increasing temperature. The information from Arrhenius parameters can be used to optimize thermal process and maximize quality retention of tempe by choosing an appropriate time-temperature combination.
Table 5 Activation energy for antioxidant properties and physical quality of tempe during thermal treatments.
Parameters Component Equations r² Ea
(kJ/mol)
4.6Application of Kinetic Data
Design of optimal thermal processing relies on kinetic of bacterial inactivation and quality changes (Van Loey et al. 1995). The destruction of microorganisms and quality factors does not proceed at the same rate (Stumbo 1973, Holdsworth 1985). Commonly, every 10oC rise in temperature the rate of chemical reaction elevates two-fold, while the rate of microbial destruction rises ten-fold or in other words quality deterioration is less heat sensitive than microbial destruction (Holdsworth 1985). Because of the differences in thermal behaviour between safety and quality factors, optimization is required to ensure the product safety and maximize retention of quality attributes.
A conventional thermal process (blanching, pasteurization, and sterilisation) often leads to undesirable changes in food quality, such as color, texture, flavor, nutrition, and functionality (Ndiaye et al. 2009). An accurate kinetic data of microbial inactivation and quality loss can be applied to estimate the effects of time-temperature process on product quality desired. Heating at higher temperatures is relatively lower destruction of quality factors. In addition, when the heat transfer rate is enhanced then the process will be shorter resulting in lesser destruction in quality factors and this forms HTST (High Temperature Short Time) concept (Rattan 2012).
32
(Bacillus stearothermophillus) to achieve commercial sterility condition. Because of kinetic data obtained at temperature <100oC, extrapolation of the data at higher temperature is required for this simulation. The red dash line performs minimum heating time required to kill 12 decimal of C. botulinum type A and B which has D250=0.21 min and z=17.8oF, whereas the blue one is minimum requirement for
33
For this simulation the process was designed to experience 10% destruction of antioxidant properties and physical quality. The example of process calculation is given in Appendix 4. Depending on the graphs, to obtain commercial sterility product, tempe should be heated on the right side of the red
dash line to fullfill a minimum “botulinum cook” (Fo=12x0.21=2.52 min). In
addition, canning food industries consider the other heat resistant spores (generally referred to as thermophiles), such as B. stearothermophillus, that have the potential to cause spoilage and economic losses (Awuah et al. 2007). Therefore, to achieve safety quality of the product, tempe has to be subjected to thermal processing in the grey area.
A conventional canning process is commonly conducted at temperature ranging 110-121.1oC (Hariyadi 2014) for a long time to destroy microorganisms of public health and spoilage concerns. Therefore, it leads to induce permanent changes to the nutritional and sensory attributes of products. It can be seen from the graphs that heating tempe in the grey region resulted in destruction of textural and color attributes significantly. However, the antioxidant capacity of tempe can be retained when tempe is heated for short time (< 11 min) in the grey area.
Heating tempe at mild temperature below 100oC (pasteurization) might be alternative process to retain better antioxidant profiles and physical quality of tempe. This simulation uses C. botulinum type E as target microbe having D185=0.28 min and z=16oF which is considered to be target pathogen of
pasteurized fish and fishery products because this pathogens will survive the pasteurization process and grow under normal storage conditions (FDA 2011, Méndez and Abuín 2006). Furthermore, tempe is identical product to pasteurized fish both of which are source of protein and has pH > 4.5 (low acid canned food, LACF) and water activity > 0.85.
According to FDA (2011), a reduction of six decimal level of C. botulinum type E is suitable (6D process) for pasteurization. Because the process is not severe enough to kill C. botulinum, the pasteurized foods require refrigeration immediately after processing. Consequently the pasteurized products are reduced oxygen packaged (e.g., vacuum packaged or modified atmosphere packaged) and have limited shelf life in the distribution chain (Ahmed and Shivare 2006).
It can be seen from the graphs that the green dash line performs minimum heating time required to destroy 6 decimal of C. botulinum, thus pasteurized tempe should be heated on the right side of the green dash line. When tempe is subjected to termal processing at time-temperature combination in this area, the minimum 10% destruction of antioxidant properties and physical quality in solid and salt solution are achievable. In this case the quality attributes of tempe during pasteurization can be relatively retained.
Ristanti (2010) has reported that pasteurization process (P18516 = 37 min) could extend the shelf life of tempe untill 25 days in vacuum pacakages of aluminium foil and stored at 5oC. However, this process effectively killed the
moulds of tempe but the heat resistant microoganisms was still alive causing spoilage of the product. Protease from spoilage organisms degraded protein into micromolecules, such as amino acids, ammonia (NH3), and hydrogen sulfide
34
35
5
CONCLUSIONS AND SUGGESTION
5.1Conclusions
Thermal treatments affected significantly on antioxidant capacity and physical quality of tempe. During heating the rate of change in antioxidant capacity and physical quality of tempe increased with increase of time and temperature process. The changes of antioxidant capacity had similar trend to total phenolic content (TPC) indicating that TPC strongly influenced the antioxidant power of tempe (p < 0.05), whereas total flavonoid content (TFC) was relatively constant during heating. The presence of salt improved solubility pectin which softened the tempe texture. Moreover, the salt solution decreased water activity that might inhibit the Maillard reaction, thus the visual appearance of fresh tempe was relatively retained.
Not all tested quality attributes could be modeled well as thermal kinetic parameters because some of them were not affected significantly by process conditions, such as the total flavonoid content, hue, springiness, stickiness, cohesiveness, and chewiness. The heat sensitive quality parameters of tempe which can be modeled as first-order reaction: antioxidant capacity, TFC, hardness, lightness, yellowness, greenness and chroma.
The activation energy indicated the parameter sensitivity to temperature changes. The slope for degradation of physical properties was sharper than antioxidant capacity indicating that the rate of physical change was more heat sensitive than other parameter. Determination of activation energy from physical attributes showed that activation energies for color changes (Ea greenness=181.44
kJ/mol, Ea yellowness=82.75 kJ/mol, Ea chroma=73.95 kJ/mol, Ea lightness=54.98 kJ/mol)
were greater than textural changes (Ea hardness=44.32 kJ/mol). The activation energy
for total of antioxidant capacity (14.68 kJ/mol) was smaller than TPC (30.16 kJ/mol).
5.2Suggestion
36 editor. Thermal Food Processing: New Technologies and Quality Issues. Boca Raton (US): CRC Press.
Ahmed J, Shivhare US, Ramaswamy HS 2002. A Fraction Conversion Kinetic Model for Thermal Degradation of Color in Red Chilli Puree and Paste. LWT- Food Sci Technol. 35(6):497-503.
Alekel DL, Germain AS, Peterson CT, Hanson KB, Stewart JW, Toda T. 2000. Isoflavones-rich soy protein isolate attenuates bone loss in the lumbar spine of perimenopausal women. Am J Clin Nutr. 72 (3):844-852.
Alvarez MD, Canet W. 2002. A Comparison of Various Rheological Properties for Modelling the Kinetics of Thermal Softening of Potato Tissue (C.V. Monalisa) by Water Cooking and Pressure Steaming. Int J Food Sci Technol. 37(1): 41-55.
Ames BN, Shigenaga MK, Hagen TM. 1993. Oxidants, antioxidants and the degenerative diseases of aging. Proc Natl Acad Sci USA. 90:7915-7922. Aoki H, Furuya Y, Endo Y, Fujimoto K. 2003. Effect of gamma-aminobutyric
acid-enriched tempeh-like fermented soybean (GABA-Tempeh) on the blood pressure of spontaneously hypertensive rats. Biosci Biotechnol Biochem. 67(8): 1806-1808.
Ashenafi M, Busse M. 1991. The microflora of soak water during tempeh production from various beans. J Appl Bacteriol. 70:334–338.
Awuah GB, Ramaswamy HS, Economides A. 2007. Thermal processing and quality: principles and overview. Chem Eng Proc. 46:584 – 602.
Babu PD, Bhakyaraj R, Vidhyalakshmi R. 2009. A low cost nutritious food
“Tempeh” – A review. J Dairy Food Sci. 4:22–27.
Badger TM, Ronis JJM, Simmen CMR, Simmen FA, Vattem. 2005. Soy Protein Isolate and Protection against Cancer. J Am Coll Nutr. 24(2):146-149.
BeMiller JN, Huber KC. 2008. Carbohydrates. In: Damodaran S, Parkin KL, Fennema OR, editors. Fenema’s Food Chemistry. Boca Raton (US), London (GB), New York (US): CRC Press. 4th Ed.
Berk Z. 2009. Food Process Engineering and Technology. Burlington (US), London (UK), San Diego (US), New York (US): Academic Press.
Blois MS. 1958. Antioxidant determinations by the use of a stable free radical. Nature. 26:1199–1200.
Bourne MC. 1982. Food Texture and Viscosity. New York (US): Academic Press. Bourne MC. 1987. Effect of blanch temperature on kinetics of thermal softening
of carrots and green beans. J Food Sci. 52:667.
37 Cai YZ, Luo Q, Sun M, Corke H. 2004. Antioxidant activity and phenolic compounds of 112 traditional Chinese medicinal plants associated with anticancer. Life Sci. 74:2157–2184.
Chang C, Hsu C, Chou C, Chen Y, Huang F, Chung Y. 2009. Effect of fermentation time on the antioxidant activities of tempeh prepared from fermented soybean using Rhizopus oligosporus. Int J Food Sci Technol. 44: 799–806.
Chen HM, Muramoto K, Yamauchi F, Nokihara K. 1996. Antioxidant activity of designed peptides based on the antioxidative peptide isolated from digests of a soybean protein. J Agric Food Chem. 44:2619-2623.
Clifford AH, Cuppett SL. 2000. Review: Anthocyanins—nature, occurrence and dietary burden. J Sci Food Agric. 80: 1063–1072.
Clydesdale FM, Ahmed EM. 1978. Colorimetry — methodology and applications. Crit Rev Food Sci Nutr. 10(3):243-301.
Damodaran S. 2008. Amino Acids, Peptides and Proteins. In: Damodaran S, Parkin KL, Fennema OR, editors. Fenema’s Food Chemistry. Boca Raton (US), London (GB), New York (US): CRC Press. 4th Ed.
De Reu JC, Linssen VAJM, Rombouts FM, Nout MJR. 1997. Consistency, polysaccharidase activities and non-starch polysaccharides content of soya beans during tempe fermentation. J Sci Food Agric. 73:357–363.
Deng H, Van Berkel GJ. 1998. Electrospray Mass Spectrometry and UV/Visible
Spectrophotometry Studies of Aluminum(III).Flavonoid Complexes. J Mass Spectrom. 33:1080-1087.
Dewanto V, Wu X, Adom KK, Liu RH. 2002. Thermal Processing Enhances the Nutritional Value of Tomatoes by Increasing Total Antioxidant Activity. J Agric Food Chem. 50:3010-3014.
Dong J, Qin L. 2011. Soy isoflavones consumption and risk of breast cancer incidence or recurrence: a meta-analysis of prospective studies. Breast Cancer
Res Treat. 125:315–323.
Egounlety M, Aworh OC. 2003. Effect of soaking, dehulling, cooking and fermentation with Rhizopus oligosporus on the oligosaccharides, trypsin inhibitor, phytic acid and tannins of soybean (Glycine max Merr.), cowpea (Vigna unguiculata L. Walp) and groundbean (Macrotyloma geocarpa Harms). J Food Eng. 56: 249–254.
Eisen B, Ungar Y, Shimoni E. 2003. Stability of isoflavones in soy milk stored at elevated and ambient temperatures. J Agric Food Chem. 51:2212–2215. Esaki H, Onozaki H, Kawakishi S, Osawa T. 1996. New antioxidant isolated from
tempeh. J Agric Food Chem. 44:696–700.
Fang YZ, Yang S, Wu G. 2002. Free radicals, antioxidants, and nutrition. Nutrition. 18(10): 872-879.
Feng XM, Eriksson RBA, Schnurer J. 2005. Growth of lactic acid bacteria and Rhizopus oligosporus during barley tempeh fermentation. Int J Food Microbiol. 104:249–256.
Feng XM. 2006. Microbial dynamics during barley tempeh fermentation [doctoral thesis]. Uppsala (SE): Swedish University of Agricultural Sciences.