Atomic Mean-Square Displacements in Proteins by Molecular
Dynamics: A Case for Analysis of Variance
Luca Maragliano,* Grazia Cottone,y Lorenzo Cordone,yand Giovanni Ciccotti *
*National Institute for the Physics of Matter and Physics Department, University of Rome, La Sapienza, 00185 Rome, Italy; and
y
National Institute for the Physics of Matter and Department of Physical and Astronomical Sciences, University of Palermo, 90123 Palermo, Italy
ABSTRACT Information on protein internal motions is usually obtained through the analysis of atomic mean-square displacements, which are a measure of variability of the atomic positions distribution functions. We report a statistical approach to analyze molecular dynamics data on these displacements that is based on probability distribution functions. Using a technique inspired by the analysis of variance, we compute unbiased, reliable mean-square displacements of the atoms and analyze them statistically. We applied this procedure to characterize protein thermostability by comparing the results for a thermophilic enzyme and a mesophilic homolog. In agreement with previous experimental observations, our analysis suggests that the proteins surface regions can play a role in the different thermal behavior.
INTRODUCTION
The characterization of atomic motions in proteins is essential for understanding their biological relevance; in-deed, a huge variety of experimental and theoretical work has been devoted to the subject. In their pioneering work, Frauenfelder and his co-workers (Frauenfelder, 1989; Frauenfelder et al., 1979) extracted information on atomic mean-square displacements by exploiting the crystallo-graphic atomic Debye-Waller factor that represents the fractional intensity shift of the diffraction pattern, defined as
fDW5exp 22Bsin 2
u l2
; (1)
wherelis the wavelength of incident light,uthe scattering angle, and B58p2Æu2æ, with Æu2
æ a measure of atomic disorder, from which the amplitude of the displacements of atomic positions can be obtained. Such information has also been obtained by other methods as Mo¨ssbauer spectroscopy (Parak et al., 1982) and neutron scattering (Doster et al., 1989).
From now on, we indicate with Æu2æ the mean-square displacements of the atomic positions, i.e., a measure of variability of the distribution functions of the atomic positions. The full form of these distributions is rarely considered, but it is of great relevance to characterize internal atomic motions (Ichiye and Karplus, 1987). The distribu-tions may show only one maximum, i.e., be monomodal, or
be more complicated, for example with several maxima, that is multimodal. This situation is often encountered in proteins in which, due to conformational changes essential for biological activity, atoms can be delocalized among several sites. When the distribution function of atomic positions is multimodal, the average positions of the atoms are ill de-fined, as are their mean-square displacements. In this work, we discuss a method to obtain meaningful mean-square dis-placements of atomic positions in proteins from molecular dynamics (MD) simulations.
We faced this problem while studying the properties of an enzyme extracted from a thermophilic organism. Thermo-philic and hyperthermoThermo-philic bacteria are organisms that thrive optimally at temperatures higher than 60°C, and in recent years their investigation has attracted wide interest (Gupta, 1993; Jaenicke, 2000a; Kumar and Nussinov, 2001). Proteins extracted from these organisms are stable and working at temperatures at which those obtained from or-ganisms living around room temperature (mesophiles) are known to denature. The general strategy by which these proteins achieve their thermal stability is yet poorly under-stood. To address this question we applied our approach to two different macromolecules, a thermophilic one and its homolog from a mesophilic organism, and we analyzed data from simulations performed at different temperatures.
Several experimental (Matthews et al., 1987; Jaenicke, 2000a; Kumar and Nussinov, 2001; Querol et al., 1996; Hardy et al., 1994) and simulation (Lazaridis et al., 1997; Tavernelli and Di Iorio, 2001) studies have pointed out that thermophilic proteins should possess a higher degree of rigidity compared to their mesophilic counterparts, which would enable them to better resist to high temperature. However, this seems not to be a general feature of thermophilic proteins. The assumption that the amplitude of atomic mean-square displacements could reflect the rigidity of a molecule (or of groups of atoms) lays on the Lindemann criterion (Lindemann, 1910). Such a criterion
Submitted September 24, 2003, and accepted for publication January 14, 2004.
Address reprint requests to Luca Maragliano, National Institute for the Physics of Matter National Research Center on nanoStructures and bioSystems at Surfaces (S3), Physics Dept., University of Modena, via Campi 213/A, 41100 Modena, Italy. Tel.:139-059-205-5323; Fax:1 39-059-367-488; E-mail: [email protected].
root mean-square displacements and the lattice constant is
.0.1. This empirical rule, first established for solids, has been also applied to characterize the dynamics of van der Waals clusters and protein modeling homopolymers (Zhou et al., 1997). Accordingly, we will assume that the larger is the value of the atomic mean-square displacements, the less rigid is the protein. This article is organized as follows: in the next section we introduce our approach to analyze mean-square displacements. In the third section, ‘‘Model and Simulation Details’’, we describe the models of the mo-lecules we simulated, together with details of the simula-tions. The fourth section contains the results of the application of our method to the two proteins, and in the fifth section we draw our conclusions.
ANALYZING MEAN-SQUARE DISPLACEMENTS
In statistical mechanics, the probability density function for an atomito be at positionris defined as
PiðrÞ[Ædðri2rÞæ; (2)
where angular brackets indicate ensemble or, for the ergodic hypothesis, time averages. Some relevant parameters asso-ciated with the distribution are the average value of positions,
Æræi[ Z
rPiðrÞdr (3)
and its variance
Æðr2ÆræiÞ 2
æi[ Z
ðr2ÆræiÞ 2
PiðrÞdr5Ær2æi2Æræ 2 i: (4)
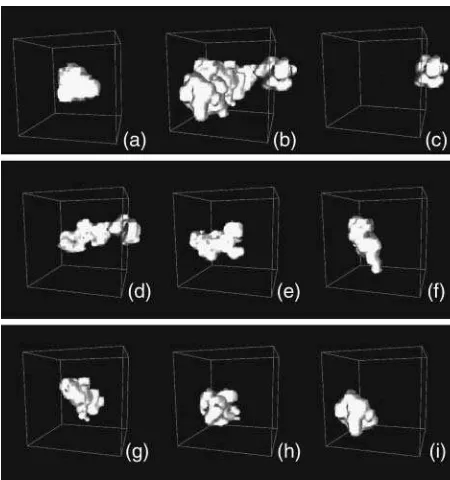
The average value is called a localization measure of the distribution of the population, and tells us where, if ever, we should expect to find the atom, whereas the variance is called a variability measure, and tells us a range for the expected positions. Another important localization measure is the mode, which is defined as the value ofrat whichPi(r) has a maximum. When the distribution Pi(r) has only one maximum, it is said to be monomodal, whereas if it has more than one, it is said to be multimodal. In the latter case, it is not straightforward to estimate the variance, because different methods can bring biased measures. In the following we describe how to obtain reliable (i.e., unbiased) estimates of the variance for the probability distributions functions of atomic positions via molecular dynamics simulations. For each atom, we estimate the probability distribution function with the three-dimensional histogram of coordinates. Before computing histograms, each configura-tion is corrected for the effects of rigid body translaconfigura-tions and rotations of the whole molecule (Kneller, 1991). As an illustration, in Fig. 1,a andb, we show a monomodal and a bimodal distribution, respectively. They pertain to two atoms of the thermophilic protein, the backbone carbon of Trp-316 and the most external nitrogen of the side chain of
Gln-103. Fig. 1,c–i, shows the distributions of positions for the nitrogen atom of the side chain of Gln-103 calculated over successive time windows of 200 ps along the simulated trajectory. The distributions were obtained for the trajectory at 360 K, which is the working temperature for the ther-mophilic enzyme (for details of the simulation, see below). As a first estimate of the variance, we compute the mean-square displacements as the following isotropic average, to which we will refer as total mean-square displacements:
Æu2iæT5
1 3 Æx
*2
i æT2Æx*iæ 2 T1Æy
*2 i æT h
2Æy*iæ2T1Æz*i2æT2Æz*iæ2Ti: (5)
The symbol Æ æT indicates time averages over the whole trajectory, and fr*
i;i51;.;Ng, with N the number of atoms, is the configuration obtained after the correction procedure described above. To define a different estimate, we divide the simulated trajectories inn time blocks of the same length, and calculate displacements as
Æu2iæj5
1 3 Æx
*2 i æj2Æx
*
iæ 2 j 1Æy
*2 i æj h
2Æy*iæ2j 1Æzi*2æj2Æz*iæ 2 j i
; (6)
whereÆ æj, withj51,.n, indicates a time average over the block j. For a discussion of the proper time-block length chosen, see below in the Results section. Then, we define the mean-square displacements within blocks as the average
Æu2iæw5
1
n + n
j51
Æu2iæj: (7)
If an atom has a monomodal distribution, the total and within-blocks displacements will not differ too much, whereas if the distribution is multimodal, they can be significantly different, the total one providing more biased estimate of the variance. In this case, we will consider the within-blocks displacements as the best estimate of the variance. Therefore we calculate and compare the total and within-blocks displacements for each atom, which requires an analysis of variance (Armitage, 1971) for each atom in each simulated trajectory. When the result of the analysis is statistically significant, we conclude that the total mean-square displacement is a biased measure of the variance, and we consider only the within-blocks displacements. To define our method with the highest degree of accuracy, we concentrated only on single atom quantities, avoiding any averaging on structural (i.e., backbone or side chain) or chemical (i.e., residues) groups. The computation of the mean-square displacements for any group of atoms, indeed, requires some consideration of the averaging procedure, which can be the subject of further work.
MODEL AND SIMULATION DETAILS
Using MD simulations, we studied theb-glycosidase protein fromSulfolobus solfataricus(Ssbgly), a hyperthermophilic archaeon that grows at 360 K, and the homolog mesophilic
b-glucosidase (Cbglu) fromTrifolium repens(white clover). The crystal structures of the two proteins have been solved by Aguilar et al. (1997) and by Barrett et al. (1995), respectively. The first is a homotetrameric enzyme, in which each monomer, composed of 489 residues, has a molecular mass of 60 kDa; the second is an homodimer, in which each monomer contains 490 residues and has a molecular mass of 62 kDa. The two monomers show a 25% homology. They both belong to the family 1 of the glycosyl hydrolases enzymatic group, whose structure and mechanism have been extensively described (Davies and Henrissat, 1995; Panasik et al., 2000). Their monomers show the same three-dimensional fold, referred to as (ba)8 barrel structure
(Creighton, 1993): eight b-strand patterns are folded in a barrel fashion, and successive b-strands are connected through parts of the polypeptide chain enclosing large
a-helix patterns, so to have eight pairs of successive
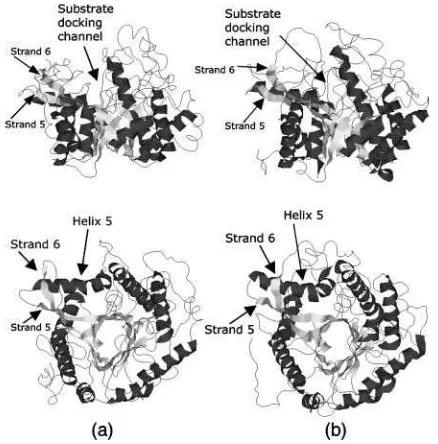
b-strands and a-helices, called ba-units. A pictorial view of the three-dimensional structures of the two proteins is shown in Fig. 2. In Fig. 3 is shown the topology diagram of
both proteins. The connections between subsequent
ba-repeats are located at the bottom of the barrel and are all composed of few residues, with the exception, in both molecules, of the one connectinga-helix 5 andb-strand 6. In both proteins, connections between the b-strand and the
a-helix of each unit (at the top of the barrel) are more elaborate, containing extra secondary structure elements, not explicitly shown in Figs. 2 and 3, which shield the barrel structures from the solvent (Aguilar et al., 1997; Barrett et al., 1995). The thermophilic behavior of Ssbgly has been clearly characterized (Moracci et al., 2001): it shows optimal ac-tivity above 358 K, temperature at which its half-life is 48 h. MD simulations were performed using DLPROTEIN (Melchionna and Cozzini, 2001). The force field used is CHARMM22 (MacKerell et al., 1998), with the SPC/E model for water molecules (Berendsen et al., 1983). The initial coordinates of thermophilic Ssbgly and mesophilic Cbglu were obtained from the crystal structures registered in the Protein Data Bank of the Research Collaboratory for Structural Bioinformatics with codes 1gow (Aguilar et al., 1997) and 1cbg (Barrett et al., 1995).
All hydrogen atoms were explicitly added, obtaining a total of 7819 atoms for Ssbgly and 7838 atoms for Cbglu. Each of the two molecules was then put in a rectangular box filled with water solvent, using an equilibrated SPC/E modeled water configuration as the building block and removing water molecules whose atoms were,1.8 A˚ from any protein atom. The final number of water molecules in the systems was 7258 for Ssbgly and 7116 for Cbglu simulations. To obtain neutrality, in the Ssbgly system we FIGURE 2 Schematic drawings of the (ba)8barrel folded structure of
replaced five randomly chosen water molecules with four calcium ions and one chlorine ion, whereas in the Cbglu system, three water molecules were replaced by three chlorine ions. The two systems were energy minimized, quenching them at zero temperature. For Ssbgly, equilibra-tion runs were performed with Berendsen quasi-constant pressure (P5 1 kbar) and temperature technique (Berend-sen and Van Gusteren, 1984), with temperatures of 300 K and 360 K, and coupling constants of 0.4 ps and 4 ps for the ‘‘thermostat’’ and the ‘‘barostat’’, respectively. The length of these runs was 50 ps at 300 K and 80 ps at 360 K. Then we continued to equilibrate in the canonical ensemble for 250 ps at 360 K and 200 ps at 300 K, by coupling the system with a Nose` thermostat (Nose`, 1984) with a time constant of 0.4 ps. The simulations for data collection were also performed in the canonical ensemble, and consisted of trajectories of 1.4 ns at 360 K and 300 K. For Cbglu, equilibration runs were performed with the Berendsen quasi-constant pressure (P 5 1 kbar) constant temperature technique (Berendsen and Van Gusteren, 1984) with temperatures of 300 K and 360 K, and coupling constants of 0.5 ps and 5 ps for the ‘‘thermostat’’ and the ‘‘barostat’’, respectively. These runs were 60 ps long at 300 K and 360 K. Then we continued equilibration with runs of 250 ps in the canonical ensemble with the Nose` thermostat (Nose`, 1984) and a time constant of 0.4 ps. Data were collected, during simulations in the canonical ensemble, from trajectories of 1.2 ns at 300 K and 1.4 ns at 360 K.
In all simulations, periodic boundary conditions were used (Frenkel and Smit, 2002). Van der Waals interactions were cut off at a distance of 10 A˚ , whereas electrostatic interactions were calculated by Ewald sums using the smooth particle mesh Ewald method (Esmann et al., 1995). The cutoff of the real space part was 10 A˚ , and the Ewald
a-parameter was set to 0.31 for Ssbgly and to 0.36 for Cbglu. Eighth order cubic splines were used for interpola-tion, with grids of 75 3 75 3 65 for Ssbgly and 75 3 85
3 75 for Cbglu. All chemical bonds in the molecules were kept fixed using the SHAKE algorithm (Ryckaert et al., 1977, Ciccotti and Ryckaert, 1986). Equations of motion were integrated with the velocity Verlet scheme (Andersen, 1983, Tuckerman et al., 1992) with a time step of 1 fs. Coordinates were saved every 100 fs for data analysis.
RESULTS
As a first step of our analysis, we need to determine the suitable time-block length to compute the mean-square displacements within blocks defined in Eq. 7. To this purpose we calculated, for the 360-K trajectory of Cbglu, the distribution of atomic mean-square displacements within blocks for several block lengths L, say 50, 100, 150, 175, 200, 250, 300, 350, 400, 600 and 1400 ps. We indicate with
ffjLgj51;.;N the frequency distribution of the mean-square displacements within blocks corresponding to a given block length L, N being the number of class intervals we considered, and with nL the total number of block lengths (and hence of different distributions). Then, we calculate a reference distribution, which we indicate asfffg, defined as follows: given the set of all the valuesfL
j , withj51,.,N andL51,.,nL, we calculate the distributionsff
max
j gand
ffmin
j g, defined such as,"j,
fjmax5 max L2f1;.;nLg
fjL (8)
and
fjmin5 min L2f1;.;nLg
fjL; (9)
respectively; then, we take
ffj5 f max
j 1f
min j
2 : (10)
Hence, by definition, fffg is the distribution of the middle values in the range of all the fL
j values we have. This definition of the reference distribution should ensure that our results do not depend on the total simulation length, since
ffmax
j gand ffjmingshould not vary sizably with it. We will return to this point below. Now, for each distribution, we calculated the value
X25 +
N
j51
fjL2ffj sj
!2
; (11)
where
s2j 5 1 nL21 +
nL
L51
ðfjL2ffjÞ 2
: (12)
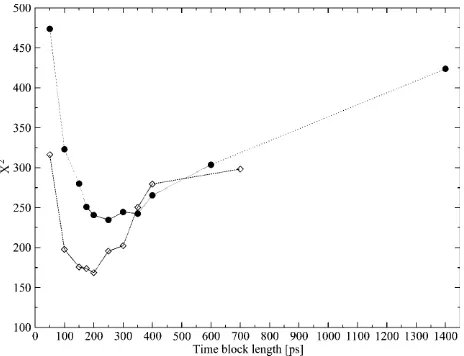
If we could assume that the different values fj, corresponding to different values of L, were statistically independent, X2would be a variablex2 with N-1 degrees of freedom. This hypothesis is, however, not fully plausible. In Fig. 4 (circles), we plot the X2 values obtained for the different block lengths. The stability region between the values 175 and 350 ps tells us that the differences between the distributions for these block lengths are small, and so we take 200 ps as a proper block length for the calculation of atomic mean-square displacements within blocks. To ensure that this result does not depend on the total simulation length, we should repeat the test for different total lengths. Increasing considerably the simulation length would be too time demanding, and so we did the test for a simulation length of 700 ps. In Fig. 4 (diamonds), we plot theX2values obtained for the different block lengths in the case of 700 ps total block length. The distributionsffjmaxg and ffjming are now calculated using the set of distributions withL 5 50, 100, 150, 175, 200, 250, 300, 350, 400, and 700 ps, whereas the reference distribution is calculated again using Eq. 10. As it can be observed, there is a stability region between the values 100 and 250 ps. Since 200 ps is in the center of this range, it turns out again that it is a suitable block length for the calculation of atomic mean-square displacements within blocks. We did this test for the Cbglu trajectory at 360 K, for which a larger variability of the mean-square displace-ments with the time-block length is expected. Accordingly, the obtained value must be suitable also for the other trajectories.
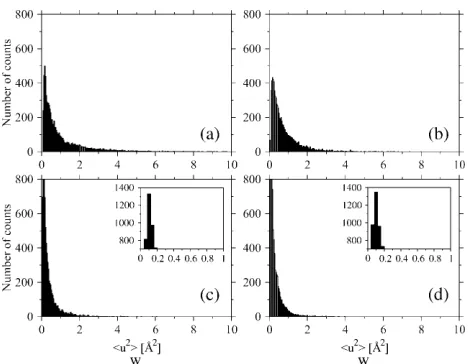
To perform the analysis of variance, we calculated the total and within-blocks mean-square displacements for all the atoms of Ssbgly and Cbglu at 360 K and at 300 K. Figs. 5 and 6, respectively, show the distributions of the total and within-blocks displacements for each protein at both temperatures. In Table 1 are reported the average values, modes, and variances of these distributions. The distributions of total and within-blocks displacements are different, as evident by direct observation and by comparing their parameters. To prove further these differences, we compared them basing on anFvariable test on their average values. For each protein at each temperature, we took
F5 Æu 2 iæT
Æu2iæw; (13)
where bars indicate the average values of the distributions of displacements. The result is always significant at the level of 5%. That is, the two measures are not homogeneous. Since the total mean-square displacements are a biased estimate of the variance, we take the within-blocks mean-square dis-placements as an estimate for the variance of the distribution of atomic positions. Another advantage of using the within-blocks mean-square displacements is that they are robust in time, that is, their values do not depend strongly on the total simulation time length over which they are calculated. To show this property, we calculated the total and within-blocks mean-square displacements for the side-chain Nof residue Gln-103 of thermophilic Ssbgly for different simulation lengths. Data were taken from the simulation at 360 K. In Fig. 7, we plot our results for the total and within-blocks displacement. As evident, the total mean-square displace-ments are always considerably larger than the within-blocks ones. Since they are both estimates of the same quantity, this
FIGURE 4 Values ofX2variable (Eq. 9) for the distributions of within-blocks mean-square displacements with different time-block lengths calculated for Cbglu at 360 K considering the whole 1.4-ns long trajectory (d) and the first 700 ps ()).
confirms that the total mean-square displacements are a biased estimate of the variance of the distribution of atomic positions. Furthermore, the total displacements strongly fluctuate when varying the simulation length, whereas the within-blocks displacements become quickly stationary. It is interesting to correlate these results with the distribution of positions for the same atom, plotted in Fig. 1,
c–i. The boost obtained for the total displacements value in Fig. 7, when going from 200 to 400 ps and 600ps, is clearly due to the extension of the region visited by the atom in the 200–400 ps time slice (Fig. 1 d). By computing the total mean-square displacement for increasing time lengths, the results are biased by this initial value. At variance, from the definition of the within-blocks displacement (Eq. 7), it is clear that the averaging over the different 200-ps-long blocks provides a measure of the local variability of the distribution of atomic positions.
It is important to mention here that our analysis method is not aimed at canceling out the long time dynamics of protein atoms; rather, it stresses that the mean-square displacements are quantities that cannot be computed straightforwardly. Indeed, for a multimodal distribution of positions, the total mean-square displacements would necessarily result in
biased variability measures, associated with ill-defined localization sites, whereas variability measures must only be associated to effective localization sites. A multimodal distribution of positions occurs when, during a certain time, an atom is delocalized between several metastable sites. If this is the case, only local variability measures can be calculated, that is, displacements within the localization sites. From our analysis, it turns out that 200 ps is a proper time-block length to measure this variability. If we do not reduce to local variability measures, due to the change in localization site, we obtain oversized variability measures.
Once established how to calculate mean-square displace-ments, it has physical meaning to study how they behave when varying the temperature. The molecules we simulated form, in their native configuration, tetramers and dimers. By simulating only the monomers, we could obtain a different pattern of the mean-square displacements for the atoms in the residues located at the intersubunit surface. However, a comparison of results for the two different molecules on the same monomer basis helps in capturing essential features and understanding their different behavior with temperature (Bismuto et al., 2002).
In the literature, results about comparison of rigidity between thermophilic and mesophilic homologs are contro-versial. Lazaridis et al. (1997) have shown by MD analysis that, at 300 K, a very small hyperthermophilic rubredoxin exhibits higher rigidity than a mesophilic homolog at the same temperature. This suggestion has subsequently been questioned, see e.g., Jaenicke (2000b); moreover, Fitter and Heberle (2000), basing their findings on neutron scattering measurements, reported that on a short timescale (0.1 ns) thermophilica-amylase, a ba-barrel glycosyl hydrolase as Ssbgly and Cbglu, is less rigid than its mesophilic counterpart. Colombo and Merz (1999) using molecular dynamics simulations, studied the structural equilibrium displacements (i.e., motions in the hundreds of picoseconds timescale) of a mesophilic subtilisin and a thermophilic homolog. The authors reported that although at room temperature the two molecules show similar flexibility, at higher temperature (350 K) the thermophilic protein has an enhanced flexibility.
The analysis of the distributions of mean-square displace-ments within blocks for the two proteins points out that at 300 K (Fig. 6,candd, and parameters in Table 1), the modes are equal, although average values and the variances differ
TABLE 1 Parameters of the distributions of atomic mean-square displacements
Total mean-square displacementsÆu2
iæT Mean-square displacements within blocksÆu2iæw
Average value Mode Variance [A˚4] Average value Mode Variance [A˚4]
Ssbgly 360 K 1.82 0.15 5.23 0.76 0.19 0.60
300 K 0.61 0.11 0.73 0.32 0.11 0.13
Cbglu 360 K 3.24 0.42 20.16 1.05 0.19 1.67
300 K 0.86 0.15 2.99 0.37 0.11 0.22
All data are in A˚2, except where explicitly written.
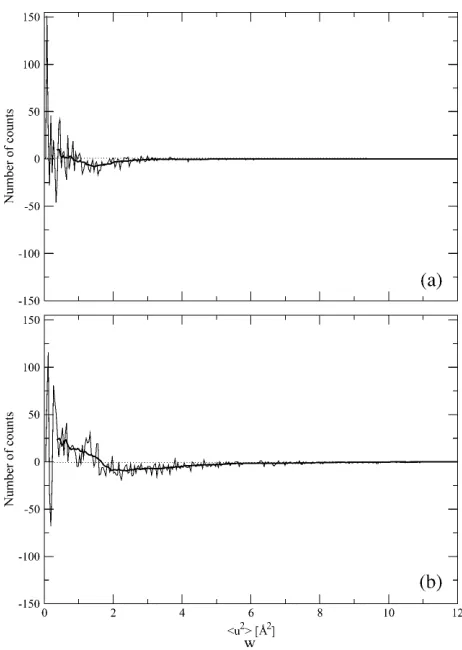
by 15% and 65%, the thermophilic protein showing smaller values. At 360 K (Fig. 6,aandb, and Table 1), the modes are still the same, although the average values differ by;40%, the thermophilic protein showing again smaller values, and the variance of the distribution for the mesophilic is 2.8 times that of thermophilic. More insight can be obtained by plotting the difference between the two distributions at each temperature (Fig. 8). At both temperatures, this quantity oscillates rapidly around zero, implying that it is difficult to extract unambiguous information from the distributions. However, we can observe a signal, small with respect to the amplitudes of the oscillations, but sizable. This signal shows that the distribution for the thermophilic protein is more populated at low fluctuation values, whereas that of the mesophilic is more populated at values.1.5 A˚2. This effect, hardly seen at 300 K, is better evident at 360 K (Fig. 8b).
It is relevant to determine the atoms that contribute to this difference, and if they are located in peculiar regions of the molecules. In Cbglu, the 79% of atoms showing displace-ments of this entity are side-chain atoms, whereas in Ssbgly this fraction is 92%. This means that at 360 K in Cbglu, there are more backbone atoms with large values of mean-square displacements. We found that they belong to residues located in segments of the polypeptide chain with very poor secondary structure organization, and are more exposed to the solvent than the remaining part of the chain. Regions of this kind are, for example, in Cbglu from the N-terminus to residue 64, or the loop region of residues 200–216, whereas for Ssbgly, from residue 464 to the C-terminus, or the loop region formed by residues 212–225. They are the intra- and inter-ba-units connections (see Fig. 3). These parts might be involved in the onset of the denaturation process, character-ized by the falling apart of the externala-helices. The larger displacements could hence reflect the onset of these large-scale motions.
CONCLUSIONS
We have reported a statistical approach to analyze molecular dynamics data on the displacements of atomic positions in proteins. Our method is based on atomic probability density functions of positions. These functions can be estimated by computing three-dimensional histograms of atomic coor-dinates obtained from simulated trajectories. With a tech-nique inspired by the analysis of variance, we introduce an unbiased procedure to compute mean-square displacements of atoms. These displacements are in turn a random variable over the sample of all atoms, and we analyze them statistically. We applied this analysis to try a characterization of thermostability, and, to this end, compared a thermophilic protein, the b-glycosidase from S. solfataricus (Ssbgly), with its mesophilic homolog, the b-glucosidase (Cbglu) from T. repens (white clover). By comparing the distribu-tions of these displacements in Ssbgly with those of Cbglu at the same temperatures, we conclude that there are some differences between the two proteins, and some dissimilarity may be noted in the connection regions of the (ab) barrel structures, which might be a signature of the different behavior of the two molecules at high temperature. Indeed, FIGURE 8 Differences between the Ssbgly (thermophile) and Cbglu (mesophile) distributions of the mean-square displacements within blocks at 300 K (a) and 360 K (b). The thick lines connect points, each one calculated as the average of 20 successive data points.
these structures, which are more exposed to the solvent than the rest of the chain, could have a role in the onset of the denaturation process, characterized by the falling apart of externala-helices, which shield the barrel from the solvent (Bismuto et al., 2003).
The authors thank Prof. Martin Karplus and Prof. David Coker for a critical reading of the manuscript and useful suggestions.
Support has been obtained from MIUR (Ministero Italiano Universita’ e Ricerca), project Cofin 2000.
REFERENCES
Aguilar, C. F., I. Sanderson, M. Moracci, M. Ciaramella, R. Nucci, M. Rossi, and L. H. Pearl. 1997. Crystal structure of theb-glycosidase from the hyperthermophilic archeonSulfolobus solfataricus: resilience as a key factor in thermostability.J. Mol. Biol.271:789–802.
Andersen, H. C. 1983. RATTLE: a ‘‘velocity’’ version of the SHAKE algorithm for molecular dynamics calculations.J. Comput. Phys. 52: 24–34.
Armitage, P. 1971. Statistical Methods in Medical Research. Blackwell Scientific Publications, London.
Barrett, T., C. G. Suresh, S. P. Tolley, E. J. Dodson, and M. A. Hughes. 1995. The crystal structure of a cyanogenicb-glucosidase from white clover, a family 1 glycosil hydrolase.Structure.3:951–960.
Berendsen, H. J. C., J. P. M. Postma, W. F. Van Gusteren, and J. Hermans. 1983. The missing term in effective pair potential.J. Phys. Chem.91: 6269–6271.
Berendsen, H. J. C., and W. F. Van Gusteren. 1984. Molecular dynamics simulations: techniques and approaches.InMolecular Liquids, Dynamic and Interaction. NATO ASI series C135. A. J. Barnes, W. J. Orville-Thomas, and J. Yarwood, editors. Reidel, New York. 475–500. Bismuto, E., F. Febbraio, S. Limongelli, R. Briante, and R. Nucci. 2003.
Dynamic fluorescence studies ofb-glycosidase mutants fromSulfolobus solfataricus: effects of single mutations on protein thermostability.
Proteins.51:10–20.
Bismuto, E., P. L. Martelli, A. De Maio, D. G. Mita, G. Irace, and R. Casadio. 2002. Effect of molecular confinement on internal enzyme dynamics: frequency domain fluorometry and molecular dynamics simulation studies.Biopolymers.67:85–95.
Ciccotti, G., and J. P. Ryckaert. 1986. Molecular dynamics simulations of rigid molecules.Comput. Phys. Rep.4:345–392.
Colombo, G., and K. M. Merz. 1999. Stability and activity of mesophilic subtilisin E and its thermophilic homolog: insights from molecular dynamics simulations.J. Am. Chem. Soc.121:6895–6903.
Creighton, T. E. 1993. Proteins. Structure and Molecular Properties. W. H. Freeman & Co., New York.
Davies, G., and B. Henrissat. 1995. Structure and mechanisms of glycosyl hydrolases.Structure.3:853–859.
Doster, W., S. Cusak, and W. Petry. 1989. Dynamical transition of myoglobin revealed by inelastic neutron scattering.Nature.337:754– 756.
Esmann, U., L. Perera, M. Berkowitz, T. Darden, H. Lee, and L. G. Pedersen. 1995. A smooth particle mesh Ewald method.J. Chem. Phys.
105:8577–8593.
Fitter, J., and J. Heberle. 2000. Structural equilibrium fluctuations in mesophilic and thermophilica-amylase.Biophys. J.79:1629–1636. Frauenfelder, H. 1989. The Debye-Waller-factor from villain to hero in
protein crystallography.Int. J. Quantum Chem.35:711–715.
Frauenfelder, H., G. Petsko, and D. Tsernoglou. 1979. Temperature-dependent X-ray diffraction as a probe of protein structure dynamics.
Nature.280:558–563.
Frenkel, D., and B. Smit. 2002. Understanding Molecular Simulations. Academic Press, New York.
Gupta, M. N. 1993. Thermostability of Enzymes. Springer, Berlin.
Hardy, F., G. Vriend, B. van der Vinne, F. Frigerio, G. Grandi, G. Venema, and V. G. Eijsink. 1994. The effect of engineering surface loops on the thermal stability of Bacillus subtilis neutral protease. Protein Eng.
3:425–430.
Ichiye, T., and M. Karplus. 1987. Anisotropy and anharmonicity of atomic fluctuations in proteins: analysis of a molecular dynamics study.
Proteins.2:236–259.
Jaenicke, R. 2000a. Stability and stabilization of globular proteins in solution.J. Biotechnol.79:193–203.
Jaenicke, R. 2000b. Do ultrastable proteins from hyperthermophiles have high or low conformational rigidity?Proc. Natl. Acad. Sci. USA.97: 2962–2964.
Kneller, G. R. 1991. Superposition of molecular structures using quaternions.Mol. Simulat.7:113–119.
Kumar, S., and R. Nussinov. 2001. How do thermophilic proteins deal with heat?Cell. Mol. Life Sci.9:1216–1233.
Lazaridis, T., I. Lee, and M. Karplus. 1997. Dynamics and unfolding pathways of a hyperthermophilic and a mesophilic rubredoxin.Protein Sci.6:2589–2605.
Lindemann, F. A. 1910. The calculation of molecular vibration frequencies.
Physics, Z.11:609–612.
MacKerell, A. S., Jr., D. Bashford, M. Bellott, R. L. Dunbrack, Jr., J. D. Evanseck, M. J. Field, S. Fischer, J. Gao, H. Guo, S. Ha, D. Joseph-McCarthy, L. Kuchnir, K. Kuczera, F. T. K. Lau, C. Mattos, S. Michnick, T. Ngo, D. T. Nguyen, B. Prodhom, W. E. Reiher III, B. Roux, M. Schlenkrich, J. C. Smith, R. Stote, J. Straub, M. Watanabe, J. Wiorkiewicz-Kuczera, D. Yin, and M. Karplus. 1998. All-atom em-pirical potential for molecular modeling in dynamics studies of proteins.
J. Phys. Chem. B.102:3586–3616.
Matthews, B. W., H. Nicholson, and W. J. Becktel. 1987. Enhanced protein thermostability from site-directed mutations that decrease the entropy of unfolding.Proc. Natl. Acad. Sci. USA.84:6663–6667.
Melchionna, S., and S. Cozzini. 2001. DLPROTEIN user manual. http:/ www.sissa.it/cm/DLPROTEIN.
Moracci, M., M. Ciaramella, and M. Rossi. 2001. b-glycosidase from
Sulfolobus solfataricus.Methods Enzymol.330:201–215.
Nose`, S. 1984. A molecular dynamics method for simulations in the canonical ensemble.Mol. Phys.52:255–268.
Panasik, N., Jr., J. E. Brenchley, and G. K. Farber. 2000. Distributions of structural features contributing to thermostability in mesophilic and thermophilica-b-barrel glycosyl hydrolases.Biochim. Biophys. Acta.
1543:189–201.
Parak, F., E. W. Knapp, and D. Kucheida. 1982. Protein dynamics: Mossbauer spectroscopy on deoxymyoglobin crystals. J. Mol. Biol.
161:177–194.
Querol, E., J. A. Perez-Pons, and A. Mozo-Villarias. 1996. Analysis of protein conformational characteristics related to thermostability.Protein. Eng.9:265–271.
Ryckaert, J. P., G. Ciccotti, and H. J. C. Berendsen. 1977. Numerical integration of the Cartesian equations of motion of a system with constraints: molecular dynamics of n-alkanes. J. Comput. Phys. 23: 327–341.
Tavernelli, I., and E. Di Iorio. 2001. The interplay between protein dynamics and frustration of non-bonded interactions as revealed by molecular dynamics simulations.Chem. Phys. Lett.345:287–294. Tuckerman, M., B. J. Berne, and G. J. Martyna. 1992. Reversible multiple
time scale molecular dynamics.J. Chem. Phys.97:1990–2001.
Zhou, Y., M. Karplus, J. M. Wichert, and C. K. Hall. 1997. Equilibrium thermodynamics of homopolymers and clusters: molecular dynamics and Monte Carlo simulations of systems with square-well interactions.