CHARACTERIZING THE URBAN GROWTH FROM 1975 TO 2003 OF HANOI CITY USING REMOTE SENSING AND A SPATIAL METRIC
Pham Minh Hai1) and Yasushi Yamaguchi2)
Graduate School of Environmental Studies, Nagoya University, Japan Furo-cho, Chikusa-ku, Nagoya 464-8601, Nagoya, Japan
1)Email: [email protected] 2)Email : [email protected]
ABSTRACT
T
his study explores an approach of combining remote sensing and a spatial metric to characterize land use change in Hanoi, Vietnam. The work is based on the land cover information of 4 different times derived from Landsat and ASTER data from 1975 to 2003. This study adopted the spatial metrics; the percentage of like adjacency (PLADJ), which calculates the number of like adjacencies involving the focal class, divided by the focal number of cell adjacencies involving the focal class, multiplied by 100 to convert to a percentage. The result successfully showed proportions of the fragmented and the aggregated areas in urbanization for each development time. During the rapid urbanization periods in 1975 – 1984 and 1984 – 1992, a large proportion of the interior non developed and aggregated non developed was converted to developed landscape, whereas fragmented non developed to developed markedly happened in 2001 – 2003. The study provided intuitive description and separation of three urbanization patterns such as infill, expansion, and outlying. Quantitative assessment revealed that the proportion of the expansion and infill steadily increased, whereas the proportion of the outlying decreased in past 30 years. The combined approach using remote sensing and a spatial metric is an effective method to improve understanding of urbanization patterns and to provide visualization of spatial – temporal change due to urbanization.Keywords: land cover change, Landsat, ASTER, spatial metric
INTRODUCTION
Remote sensing provides great poten-tial of acquiring data to detect land use change and urban growth in an appropriate spatial scale. Spatial metrics (landscape metrics) are a useful tool to quantity urban structures and to detect urbanization pat-terns from geospatial data. This study ex-plores an approach of combining remote sensing and a spatial to characterize land use change in Hanoi, Vietnam. Recently, eco-nomic development in Hanoi city has re-sulted in the urbanization occurring at an un-precedented rate. This led rapid increase in population of the city from 1.4 million people in 1975 to 3.3 million in 2006. The
not resolve the heterogeneity of the urban environment, mixture of build – up areas, transportation lines, park, bare soil, and water bodies. Therefore, those results by re-mote sensing can only show distribution of urbanized areas, Nevertheless, few studies have focuser on the integration of remote sensing data into urban planning and man-agement applications.
The objective of this study is to in-vestigate potential of combining remote sensing and a spatial metric to investigate the structure and change of urban areas. This study adopted one of the spatial metrics; the percentage of like adjacency (PLADJ) to detect proportions of landscape fragmenta-tion for urban areas. Spatial metrics can be used to objectively quantity the spatial struc-ture and pattern from a thematic map. Spa-tial metrics can offer improved description and representation of heterogeneous urban areas and can provide a link between the physical landscape structure and urban from (Martin, 2003). The results of this study will the useful to quantitatively characterize the spatial structure and pattern of urban areas.
METHODE
Study Area
Hanoi is located in the center of the Red River Delta. The city area covers
ap-proximately 921 km2 and the population is approximately3.3 million (2006). The study area is 450 km2 including the city center of Hanoi and has a population density of ap-proximately 5.300 people/ km2.
At present, Hanoi has seven inner – city districts, namely, Hoan Kiem, Ba Dinh, Hai Ba Trung, Dong Da, Tay Ho, Thanh Xuan and Cau Giay, and the five sub urban districts of Tu Liem, Thanh Tri, Dong Anh, Soc Son and Gia Lam. The urban popula-tion growth and rapid economic develop-ment are vital driving forces behind urban-ization, and directly impact the land use change in on the outskirts of Hanoi city. Data Source
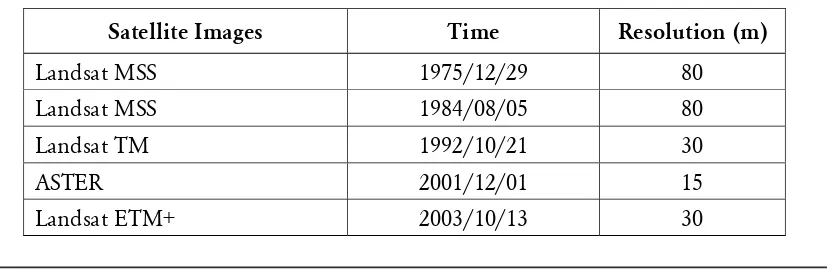
Multi spectral and multi temporal sat-ellite data were obtained, ASTER images from the Earth Remote Sensing Data Analysis Center (ERDAS) and Landsat images as from the Tropical Rain Forest Information Center, Michigan State Univer-sity, U.S.A (Table 1). Cloud cover was less than 10% in these images. The visible and NIR bands were used for data processing. Image Classification
Input data had different spatial reso-lutions and coordinate systems. So that they were converted to a standard resolution and map coordinate system. Re-sampling and
Satellite Images Time Resolution (m)
Landsat MSS 1975/12/29 80
Landsat MSS 1984/08/05 80
Landsat TM 1992/10/21 30
ASTER 2001/12/01 15
Landsat ETM+ 2003/10/13 30
geo-referencing were performed to rectify the Landsat satellite images to the Univer-sal Transverse Mercator coordinate system corresponding to the 15 m spatial resolu-tion of the ASTER VNIR data.
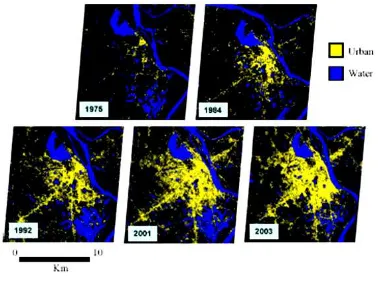
The maximum – likelihood classifi-cation method used to generate surface cover maps of the center of Hanoi. The land surface was classified into the nine classes; such as: water, bright vegetation, dark vegetation, marsh, urban, road, fallow, wet land, and sand. In order to reduce the effects of pixel to the results, this study applied approach that developed by Hai and Yamaguchi (2006) by integrating clas-sification results, VSW index and NIR band. The final results showed the maps of ur-ban areas from 1975 to 2003 (see Figure 1). Urban areas could the easily extracted from satellite data, and the results made it possible to visualize the expansion of Hanoi
City for the period from 1975 to 2003. Since the north of city is bounded by the Red River, Hanoi has expanded primarily to the west and south to date. Also, new devel-opments have recently been initiated on the east side of the Red River. A general char-acteristic of urbanization patterns is that urbanization occurs primarily in response to the construction of new buildings along transportation lines, which then subse-quently expand.
However it is necessary to provide decision makers knowledge of spatial ar-rangements of urban land cover structure (pattern shapes) that are used to character-ize urban land use (Haack, 1997). Combi-nation of remote sensing and spatial metrics can provide more spatially consistent and detailed information on urban structure and change than either of these approaches used independently (Martin, 2003). In this study,
we investigate a potential of combining remote sensing and a spatial metric to quan-tify spatial urban patterns
Spatial Metrics
Recently, there has been an interest in integrating remote sensing and spatial metrics to analyze spatial structure and patterns for urban growth. In this study, spatial structure can be understood as spa-tial distribution of individual urban areas in the thematic maps. According to Martin (2003), spatial metrics can be defined as measurements derived from the digital analysis of thematic categorical maps ex-hibiting spatial heterogeneity at a specific scale and resolution. Indeed, spatial metrics can be computed as patch-based indices (e.g. size, shape, edge length, patch,
den-sity, fractal dimension) or as pixel-based indices (e.g. contagion) computed for all pixels in a patch Gustafson, 1998). Patch can be defined as homogenous regions for a specific landscape property of interest, such as park or residential zone (Anderson, 1976)
We are especially interested in de-tecting spatial structures and quantitative change patters of urban areas due to the urbanization from 1975 to 2003, but those could not be detected directly from the re-sult of remote sensing (see Figure 2). From late 1980s, a number of metrics were de-veloped for a variety of applications such as quantifying total urban growth in urban area by the class area (CA), detecting patch fragmentation of urban area by the edge
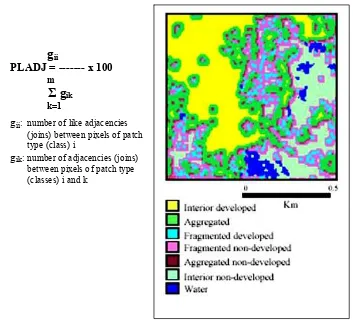
gii
PLADJ = --- x 100 m
Σ gik k=1
gii: number of like adjacencies
(joins) between pixels of patch type (class) i
gik: number of adjacencies (joins)
between pixels of patch type (classes) i and k
density (ED), and measuring of the spatial arrangement and landscape heterogeneity of urban land by the percentage of like adjacency (PLADJ) (Martin, 2003). This study applied PLADJ to investigate the ur-ban growth because it is intuitive and simple in computing.
A 5 x 5 pixel moving window was chosen to compute percentage of fragmen-tation of the urban area. An output value is retuned to the center cell of the window. PLADJ moves randomly conditional prob-abilities through pixels in the moving win-dow and equals the number of like adja-cencies, divided by the total number of cell adjacencies involving in the same class and is multiplied by 100 (to convert to a per-centage). Like adjacencies between four orthogonal cells were refereed, but diago-nal cell were ignored (Noda, 2007).
PLADJ equals 0 when a maximum dis-aggregated pattern happens in the current class or there are no like adjacencies. PLADJ equals 100 when the computed areas cover a single class or all adjacencies are in the same class (maximally contagious). If the result expresses the lower percentage, the higher fragmenta-tion or large number of individual urban units will appear in the map. In order to discrimi-nate developed and non-developed pixels (ur-ban and water, vegetation, bare soil, agricul-tural land), if a center pixel of the window was originally non-developed, a positive PLADJ value was appointed to it. Conversely, id a center pixel of the window was originally developed, a negative PLADJ value was ap-pointed to it. A PLADJ threshold was deter-mined to identify spatial structures of urban areas. A pixel became ‘fragmented’ when its value was less than 70%, “aggregated” when its value ranged from 70% to 99%, and “in-terior” when its value equaled to 100%.
RESULT AND DISCUSS
Rule of Urban Change
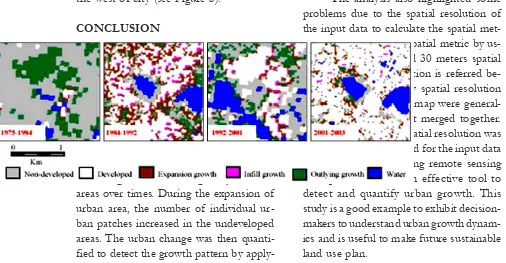
This study adopted three urban growth patterns; infill, expansion and out-lying, which were used to describe and map urban sprawl (Wilson, 2003). Forman (1995) presented a regulation of landscape transformation based on those three patterns. Firstly, the infill pattern occurs when a pixel changes from frag-mented non-developed, and it mostly appears inside the existing developed ar-eas. Secondly, a pixel change from aggre-gated non-developed to developed is de-fined as the expansion pattern, and it dominates in the urban fringe. Lastly, outlying pattern appears when a pixel changes from interior non-developed to developed, and this pattern occurs at a distance from existing developed areas.
with high density in the south-west areas of the city. The east bank of the Red River also exhibited the beginnings of urbaniza-tion. The 2001-2003 marks a significant decrease of outlying growth whereas there are some evidences of expansion-type in the west of city (see Figure 3).
CONCLUSION
Combination of remote sensing and the spatial metric (PLADJ) provided an in-novative approach to study spatial struc-tures of urban dynamics. This study inves-tigated change patterns of urban area due to urbanization from 1975 to 2003 in Hanoi. The results of PLADJ derived from the remote sensing showed clearly the spa-tial arrangement of heterogeneity of urban areas over times. During the expansion of urban area, the number of individual ur-ban patches increased in the undeveloped areas. The urban change was then quanti-fied to detect the growth pattern by
apply-ing the regulation of landscape transforma-tion. Analysis showed that expansion and outlying growth patterns regularly occurred until 2001, whereas infill growth pattern dominated from 2001 to 2003 period.
The analysis also highlighted some problems due to the spatial resolution of the input data to calculate the spatial met-ric. We computed the spatial metric by us-ing both 15 meters and 30 meters spatial resolutions, high resolution is referred be-cause input data of low spatial resolution showed the features of map were general-ized and trended to get merged together. Therefore, 15 meters spatial resolution was selected as the best suited for the input data of this study. Combining remote sensing and spatial metric is an effective tool to detect and quantify urban growth. This study is a good example to exhibit decision-makers to understand urban growth dynam-ics and is useful to make future sustainable land use plan.
REFERENCES
Anderson, J.R., 1976, A Land Use and Land Cover Classification Scheme for Use with Remote Sensing Data, US Geological Survey Professional, pp.964
Forman, R.T.T., 1995, Land Mosaic: The Ecology of Landscapes and Regions, Cambridge, UK
Gustafson, E.J., 1998, Quantifying Landscape Spatial Pattern: What is the State of the Art,
Ecosystems, Vol. 1, pp.143-156
Haack, B.N., 1997, Urban Analysis and Planning, Manual of Photographic Interpretation, pp. 517-554
Hai, P.M. and Yamaguchi, Y., 2006, Monitoring Land Cover Change of the Hanoi City Center Under Impacts of Urbanization by Using Remote Sensing, International Symposium on Geo-informatics for Spatial Infrastructure Development in Earth and Applied
Sciences, pp. 340-345
Martin, H., 2003, The Role of Spatial Metrics in the Analysis and Modeling of Urban Land Use Change, Computers, Environment and Urban Systems, No. 29, pp. 369-399.
Marwasta, D. Kajian Agihan Spasial Fasilitas dan Utilitas Perkotaan da Pengaruhnya terhadap Pola Permukiman di Kota Surakarta”. Forum Geografi, Vol. 18, No. 1, Juli 2004. Hlm 1-13.
Noda., 2007, Charactering Urban Sprawl Using Remote Sensing, GIS and a Spatial Metric for a Medium Sized City in Japan, International Journal of Geo-informatics, in press
O’Neill, R.V., 1988, Indices of Landscape Patterns, Landscape Ecology, the 1st Edition, pp.
153-162