DOI: 10.12928/TELKOMNIKA.v14i2A.4374 189
WRF/UCM Simulations of Urban Heat Island in
Guangzhou with an Extracted Land-use Map from the
Remote Sensing Data
Guang Chen 1, Lihua Zhao*2, Akashi Mochida3
1,2
Building Environment and Energy Laboratory (BEEL), State Key Laboratory of Subtropical Building Science, South China University of Technology, Guangzhou, 510641, China
3
Department of Architecture and Building Science, Graduate School of Engineering, Tohoku University, Sendai, 9857089, Japan
*Corresponding author, e-mail: [email protected]
Abstract
In order to investigate the performance of weather research and forecasting (WRF) model coupled with an urban canopy model (UCM) with an extracted land use data from Remote Sensing data (RS), three numerical experiments with different geographic models were carried out. Supervised classification with the maximum likelihood was applied to extract the land-use map in Guangzhou 2012 named the geographic model RS_12. Then based on the satellite-measured night time light data and the normalized difference vegetation index, a human settlement index was used to classify the urban land category to three urban land subcategories in the UCM as another geographic model named UCM_12. Both new geographic model simulation results are capable of reasonably modeling the observation result. The UCM_12 reasonably reproduced the best 2m temperature evolution and the minimum rootmean -square-error as compared with other experiments. Experiments with new geographic models can capture the strongest UHI time occured at night and gradually decreases in the morning but failure to get negative at noon. A better accuracy when comparing the new geographic models to the observation proved that extract land use data from RS can be used in urban scale simulation under the fast urbanizition in China.
Keywords: WRF/UCM model, remote sensing, numerical simulation, urban heat island
1. Introduction
Urbanization is a population shift from rural to urban areas, and the ways in which society adapts to the change. It predominantly results in the land use and land cover changes and building density increases in urban areas horizontally and vertically. Land use and land cover change associated with urbanization considerable impact on climate [1]. One of the results is a consistent rise in temperature in the urban atmosphere because of the land-use changes and accompanying effects on physical processes governing energy, momentum and matter exchange between land surface and the atmosphere [2, 3]. Guangzhou, the capital and largest city of Guangdong province and the 3rd largest Chinese city, is undergoing a rapid and widespread urbanization and a deterioration of urban environments caused by urban heat islands.
The weather research and forecasting (WRF) model coupled with an urban canopy model (UCM) was developed as a community tool for studying urban environmental issues [4]. It has been applied to many regions by researchers. All of their research demonstrated that urban development and accompanying land use changes can make significant contribution to extreme heat events by performing simulations using land use data in different years with the Noah Urban Canopy Model in WRF [5-8]. But default land-use data (USGS 24-category) used in the WRF model are based on 1-km Advanced Very High Resolution Radiometer data obtained from 1992 to 1993, which is considered outdated, because it fails to represent the rapid urban expansion in the past decade in China. WRF model after version 3.1 provides an alternative land-use dataset which is based on the Moderate Resolution Imaging Spectroradiometer 2001 (MODIS) satellite products [9], but city area in this geographic model also can not reflect reality because of fast urbanization.
applied and been recognized as a powerful and effective tool in detecting land use and studying the land cover change [10]. Multisensor remotely sensed data was used to map human settlements in southeastern China [11]. Many researchers had simulated the urban climate by WRF with extracted land use data from remote sensing data. Supervised classification with the maximum likelihood was applied to extract the land-use map from remote sensing images, and the research demonstrated that there is a best accuracy comparing with the observation data when simulation with an extracted land use map in WRF [12]. Feng Chen [13] based on the remote sensing method to define three urban land subcategories in the UCM, and the research showed that urban land use and classification of three urban land subcategories respectively contributed 56.8% (0.42C), 13.5% (0.10C) to the simulated urban heat island (UHI) effects.
In this paper, supervised classification with the maximum likelihood was applied to extract the land-use map as a geographical model. Then a human settlement index (HSI) will used to divide the extracted urban land cover into three urban land subcategories with different building densities, and the land-use data can be as another geographical model. The mesoscale WRF model coupled the UCM model were used to simulate the formation of a high-temperature synoptic in the area of Guangzhou and investigate the performance of WRF/UCM models with different geographical models, which control the land-use information. The simulation result were also evaluate the respectively perform of the two geographical models in the WRF simulation and contribution to the simulated UHI effects.
2. Extraction of Land-Use Data from the Remote Sensing (RS) Dataset in 2012 2.1. Study Area
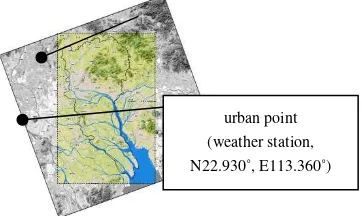
This study is operated in Guangzhou which is located in south China, which owned a population of 12.78 million of the 2010 census. Located in the south-central portion of Guangdong, Guangzhou spans from 112° 57' to 114° 03' E longitude and 22° 26' to 23° 56' N latitude. Located just south of the Tropic of Cancer, Guangzhou has a humid subtropical climate which features warm weather, abundant precipitation and sunshine, a long summer and a short forst period. The hottest period in summer usually lasts from Jul. 11th to Aug. 20th, whose average period is 41 days. The mean annual temperature of the city is 22.3 °C, with monthly daily averages ranging from 12.3 °C in January to 28.4 °C in July.
Figure 1. Study area and comparison point
Guangzhou is also expanding at a very high speed. From the statistical data on China City Statistical Yearbook, we can realize that the constructed area in Guangzhou city has increased more than 4 times since the year 2000, which is much faster than the average expansion pace in the whole China. Such tremendous urban expansion, with increasing built-up areas and human activities, causes remarkable modifications to the underlying surface properties, thereby significantly enhancing the UHI effects. Previous studies show that the UHI is a significant contributor to the regional warming in this area. In this study, the study area covers the 7 main districts in Guangzhou city where undergoing a fast urban expansion and two comparison points are shown in Figure 1.
2.2. Remote Sensing Data Used in this Study
Landsat ETM+, DMSP-OLS stable nighttime-light and multi-temporal MODIS NDVI were used in this research and their major characteristics were summarized as follow. All the selected data sets were acquired in 2012.
The free RS imagery produced by Landsat-7 Enhanced Thematic Mapper Plus (ETM+) was selected within the study area. This dataset can be downloaded from the USGS page of Glovis (http://glovis.usgs.gov/) easily. The RS dataset of Landsat-7 includes 8 bands on different wavelength. As the thermal band 6 data files refer to the gain settings of which the band is acquired in both high and low gain, the gain settings in band 6 are provided as two separate band files [14]. Resolution of the bands is 30-m.
The DMSP-OLS nighttime-lights data with 1 km spatial resolution were downloaded from the National Geophysical Data Center (NGDC) (http://ngdc.noaa.gov/eog/dmsp/downloadV4composites.html). The DMSP-OLS has a unique capability to detect low levels of visible-near infrared (VNIR) radiance at night. With the OLS "VIS" band data it is possible to detect clouds illuminated by moonlight, plus lights from cities, towns, industrial sites, gas flares, and ephemeral events such as fires and lightning-illuminated clouds. The OLS image has DN values ranged from 0 to 63 [15]. The selected DMSP-OLS image was a composite based on time-series archived DMSP-DMSP-OLS images in the calendar year of 2012.
Terra MODIS surface reflectance (MOD09A1) and NDVI (MOD13A2) images were downloaded from the USGS (United State Geographic Survey). The Normalized Difference Vegetation Index (NDVI) is an index of plant “greenness” or photosynthetic activity, and is one of the most commonly used vegetation indices. Vegetation indices are based on the observation that different surfaces reflect different types of light differently. The nearest neighbor resampling algorithm was used to resample multitemporal NDVI images for keeping the pixel size of 1 km by 1 km during their projection procedure [16, 17].
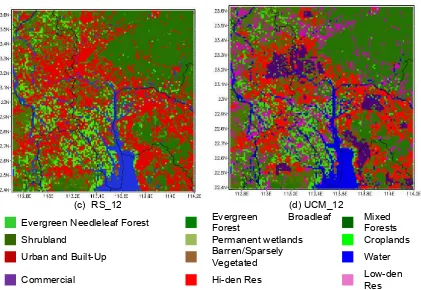
(c) RS_12 (d) UCM_12
Evergreen Needleleaf Forest Evergreen Broadleaf
Forest
Mixed Forests
Shrubland Permanent wetlands Croplands
Urban and Built-Up Barren/Sparsely
Vegetated Water
Commercial Hi-den Res Low-den
Res
Figure 2. (a) Study area and the simulation domain, (b) Modis,default land use data in WRF, (c) RS-12,extracted land use data from RS, (d) UCM-12,classify the urban land category in (c) to
three categories used in UCM
Two processes will be carried on to extract the land-use map. First, map the land use from landsat ETM+ images. Then, a human settlement index will be used to divide the extracted urban land category into three land subcategories by using DMSP-OLS images and NDVI images.The non-urban use categories in extracted land-use map will be not modified.
2.3. Land-Use Mapping from Landsat ETM+ Images
In order to derive and classify the information of each land-use class from the landsat ETM+ images, supervised classification with he maximum likelihood was applied to the whole domain 3.
Supervised classification is the procedure most often used for quantitative analysis of remote sensing image data. It rests upon using suitable algorithms to label the pixels in an image as representing particular land cover classes. The detail steps can be described as follow:
First, decide the set of land cover types into which the image is to be segmented. These are the information classes and could, for example, be water, urban, cropland, wetland, etc. In this study, the land-use classes were essentially consistent with that of the MODIS land-use classes in WRF model of forest, grassland, wetland, cropland, urban, barren land and water.
Sencond, choose representative or prototype pixels from each of the desired set of classes. These pixels are said to form training data. The training data classes should be representative of the class by using more traing data in order to expose more change in the spectrum properties of the continuous range. In this research, training sets for each class were established using the natural colored imagery and photos on Google earth. To obtain more reliable results, the minimum sample number per land-use class should be more than 10 times of the number of brands that used for the classification. This process is finished in GIS.
multispectral space. Use the trained classifier, label or classify every pixel in the image into one of the desired land cover classes. Here the whole image segment of interest is typically classified. This process is finished in IDRISI software.
Then the land-use map of Guangzhou in 2012 which summaries the results of classification was produced. It was named RS_12 and is depicted in Figure 2(c).
2.4. Classify Urban Land to Three Urban Categories Used in WRF/UCM
The extracted land-use map consider only one urban land category and thus cannot reproduce urban effects on local climate caused by the inhomogeneity in an urban area. It is preferable to classify the only one urban land category to low intensity residential, commercial/industrial/Transportation and high intensity residential categories when simulate with coupled UCM model.
In the present study, a human settlement index (HSI) was used for deriving up-to-date urban land-use data and specifying detailed urban land-use categories in the UCM (i.e., CIT, HIR, and LIR). HSI data were obtained from a combination of nighttime light imagery and the normalized difference vegetation index (NDVI)(Lu et al., 2008), as expressed by Eq. (1).
1 1
NDVImax OLSnor
HSI
OLSnor NDVImax OLSnor NDVImax
(1)
Where OLSnor is the normalized value [OLSnor= (OLS-23)/(OLSmax-23)] of the 2012 Defense Meteorological Satellite Program/Operational Linescan System (DMSP/OLS) image (Elvidge et al., 1997, 1999, 2001). A threshold of 23 was selected to minimize the effects of blooming, a phenomenon observed in DMSP/OLS nighttime imagery. OLSmax is the maximum value in the 2012 DMSP/OLS nighttime light image.
To separate human settlements from bare land effectively and remove the effect of cloud contamination, 2012 multi-temporal SPOT NDVI images at a resolution of 1 km × 1 km were used to generate a new NDVI composite index, as shown in Eq. (2) (Maisongrande et al., 2004).
NDVI1, NDVI2, , NDVI23
NDVImaxMAX (2)
HSI values were used to classify urban land in Guangzhou into the following subcategories: (1) pixels with HSI values≥ 80th percentile represented CIT areas; (2) pixels with HSI values between the 30th and the 80th percentile represented HIR areas; and (3) pixels with HSI values ≤ 30th represented LIR areas. The extracted urban land use data were classified to the new urban land cover with three categories data to represent up-to-date urbanization conditions in Guangzhou. We got the up-to date land-use data and shown in Figure 2.(d) and named UCM_12.
3. Simulation with Different Geographic Models in WRF/UCM 3.1. Model Configuration
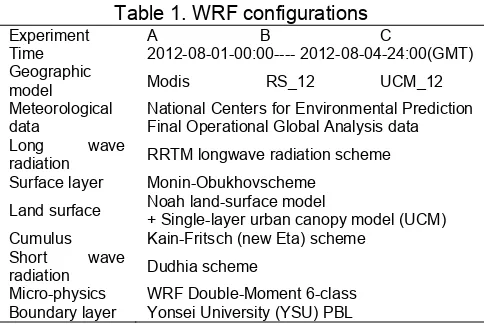
Table 1. WRF configurations
Experiment A B C
Time 2012-08-01-00:00---- 2012-08-04-24:00(GMT)
Geographic
model Modis RS_12 UCM_12
Meteorological data
National Centers for Environmental Prediction Final Operational Global Analysis data Long wave
radiation RRTM longwave radiation scheme
Surface layer Monin-Obukhovscheme
Land surface Noah land-surface model
+ Single-layer urban canopy model (UCM)
Cumulus Kain-Fritsch (new Eta) scheme
Short wave
radiation Dudhia scheme
Micro-physics WRF Double-Moment 6-class
Boundary layer Yonsei University (YSU) PBL
With 72 × 72, 101 × 101, and 121 × 121 grid points and grid spacings of 25, 5and 1 km, respectively, were used. The coordinates of the domain center is 22.116˚ and 113.5189˚. Nesting of the 3 calculation domains and their descriptions are shown in Figure 2(a). The largest domain of domain 1 covers the main part of the southern China and the second domains covers the whole Guangdong area. Main districts of Guangzhou were covered in Domain 3.
The parameterization schemes used in our simulation are listed in Table 1, including long /short wave radiation processes, planetary boundary layer processes, land surface processes and microphysical processes, etc. In the WRF model, a single-layer urban canopy model was implemented in the NOAH land surface model to represent the thermal and dynamic effects of urban buildings, including the trapping of radiation within the urban canopy. The UCM standard values for heat capacity, conductivity, albedo, emissivity roughness length for heat and momentum of roof, road, and wall surface were employed. The building height of three categories were set CIT 30m, HIR 21m and LIR 9m, the road width sespectively set for 20m, 12m, 7.8m. Initial and lateral boundary conditionswere taken from the National Centers for EnvironmentalPrediction (NCEP) Global Forecast System Final Analyses (horizontal resolution of 1° × 1°) with 6-h intervals.
3. Results
3.1.Comparisons of the Simulations from the Three Experiments
To validate the performance of geographic models with extracted land-use data, we compared the simulation results of three cases with observations 2-m temperature from the automatic weather stations. We selected from Aug.1st.to Aug.4th to compare. Two ponits meteorological dataset were acquired for validation.
All of the experimental schemes have better reproduction of the diurnal variation of temperature, though with varying magnitudes. Figure 3 and Figure 4 compared the observed and modeled 2m height temperature. For each value of temperature, we calculate the Root-Mean-Square-Error (RMES) defined by,
Where WWRF is the smulated value in WRF and WOBS is the observation value. N is the number of data. A statistical analysis of the simulations root-mean-square-error in suburban point reveals that
The UCM_12 experiment enjoys the lowest temperature at nighttime than any other experiments.
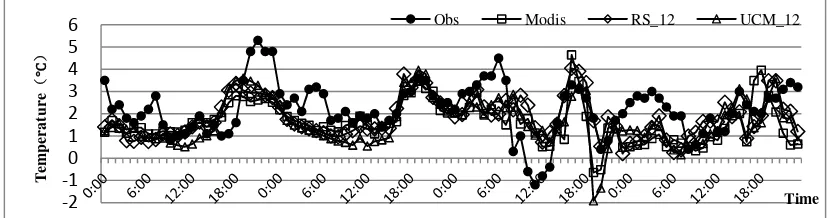
Figure 3. Comparison of air temperature at 2m height simulated in three experiments with observations at suburban point
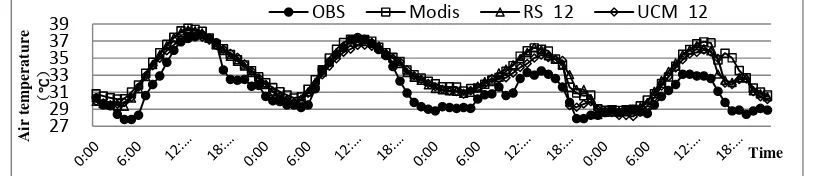
Figure 4. Comparison of air temperature at 2m height simulated in three experiments with observations at urban point
On Aug. 1st and 2nd, the maxmum temperature time of simulation is earlier than observation. The simulation results were smaller than observation in daytime, but larger in nighttime. On 3rd August, there are the same variation tendency between simulation and observation, and all day the simulation larger than observation, but UCM_12 has a good performance. Compared with UCM_12, the Modis and RS_12 experiments produce simulations that deviate the most from the observations, as evidently showing higher temperatures for all day. It is caused by the lack of UCM model, which can realistic description buildings role in blocking radiation and reflecting shortwave and long wave radiation and then improved the description of urban thermodynamic and dynamic effects in the simulated domain. The extracted land-use data have a better performance than the Modis, which is default geographic model in WRF. There is an excellent performance when the geographic model with a classified the urban land use reproduce a better performance to observation than other experiments.
Taking Aug.1st as example, the simulated and observed daily mean, maximum and minimum 2-m air temperatures are marked in Table 2. In general, the WRF/UCM modeling system efficiently simulated the daily variations in near-surface air temperature, which also prove that the geographic model from remote sensing can predict the urban temperature more accurate.
Table 2. Comparison of the simulated and observed 2-m tmperatures (T2) on Aug.1st OBS Modis RS_12 UCM_12
T2 mean 32.22 32.68 32.32 32.27
T2 max 36.4 36.77 36.80 36.60
T2min 27.1 28.86 28.00 27.89
In addition, the distribution of the temperature was shown to give a more intuitive comparison. Because of a higher UHI intensity in 20:00, the typical T2 of 20:00 in the afernoon of Aug.1st (GMT) results is shown in Figure 5. Great difference was shown when using different
geographic models. From the distribution of urban temperature, we can find that the heat island effect of Guangzhou is mainly distributed to its west and southwest in Foshan with the core shaped like a stripe orienting northeast-southwest. Besides, the heat island effect is also obvious in the urban districts of southeastern Guangzhou, Dongguan and Shenzhen. This distribution character agree with the previous studies. The experiment of Modis has a larger high temperature area and more concentrated area than other two experiment, though two experiments can agree with the previous study.
(a) T2 of Modis (b) T2 of RS_12 (c) T2 of UCM_12
Figure 5. Distribution of T2 of each case on 20:00 an Aug.1st ,GMT
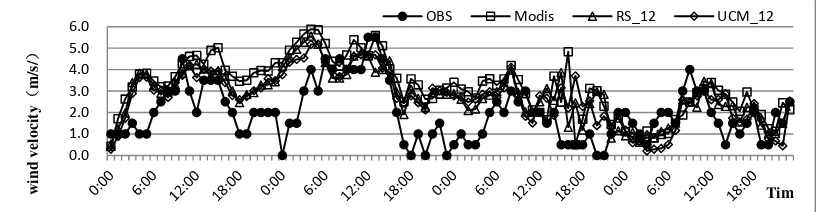
For wind velocity, all the simulation results were close to the observation data in daytime, Figure 6 and Figure 7 compared the observed and simulated 10m height wind velocity at two points. In general, both become larger in the nighttime On Aug. 1st and 2nd, the distribution trends are similar between the simulation and observation. WRF simulation results cannot accurately reflect the observation. Although coupled with UCM model, still cannot reflect the reality of the building influence on the wind environment.
Figure 6. Comparison of win velocity at 10m height simulated in three experiments with observations at suburban point
0.0 1.0 2.0 3.0 4.0 5.0 6.0
w
ind velocity
˄
m/
s/
˅
OBS Modis RS_12 UCM_12
Tim
Guanzhou Foshan
Donggua n
Shenzhe n
Guangzhou Foshan
Shenzhen Dongguan
Guangzhou Foshan
Figure 7. Comparison of win velocity at 10m height simulated in three experiments with observations at urban point
3.2. Improvement of UHI Simulations by WRF/UCM
By comparing the simulations of the three experiments, the simulation capabilities on urban heat island can be examined further. Figure 8 presents the evolution of the UHI intensity as simulated by the three experiments. The intensity of the heat island is calculated by the difference in temperature at the 2-m height between urban point and suburban point. As shown by the observation, the UHI intensity is gradually increasing after the midday and becomes strongest at night, with the maximum temperature difference at more than 5C, while it gradually decreases in the morning and even gets negative at noon. Though all the cases reproduce these characteristics of the UHI evolution except failure to depict the negative UHI on Aug.3rd and most time the modeled underestimate UHI intensity. Case3 have a higher capability to reproduce the UHI intensity on peak time but lower on other time than other experiments. Experiment UCM_12 has a little better performance than other experiments.
Figure 8.Heat island intensity of different experiments
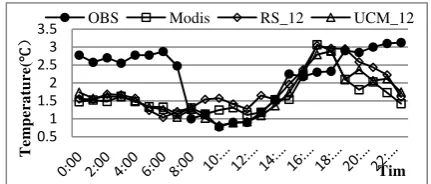
The diurnal cycles of the UHI intensities averaged over the simulation period for 2-m temperature is shown in Figure 9. We can clearly found that all modeled cases have a better UHI intensity characteristics reproduction from 8:00 to 21:00, but a big gap in other time. The WRF model shows a good performance on daytime but poor before daybreak time. The WRF model with the extracted land-use data have a better performance than default geographic model though it not perfect to depict the observation.
0.0
OBS Modis Lu2012 Lu2012‐A
Figure 9. Diurnal cycles of the UHI intensities averaged over the simulation period
4. Conclusion
Using the WRF coupled UCM model, the thermal environment over Guangzhou in the summer of 2012 was simulated. Three numerical experiments with two modified geographic models and a default geographic models were carried out.The land-use data extracted from land sat ETM+ were set as a modified geographic model though it consider only one urban land category. The up-to-date land-use data, derived from the land-use data extracted from land sat ETM+ by specitying detailed three urban land subcategories, were set another modified geographic. All these experiments were simulated to assess the simulation performance by WRF/UCM with the extracted land use data from remote sensing datasets.
(1) Land-use data of Guangzhou city in2012 were firstly extracted from the remote sensing data. Further, a human settlement idex was used to classify the extracted urban land category to three urban land categories in the UCM.
(2) Simulations were carried out by WRF/UCM with different land-use data. The geographic model with UCM_12 run reproduce a better performance to observation T2 than RS_12 run and Modis run, especially in a sunny and hot day. RS_12 run is also enjoy a advantage than Modis run. Both extracted land-use data have an excellent performance on temperature simulation
(3) The wind velocity result from all WRF/UCM model experiments were higher than observation. Compared to Modis runs, the default land-use mode in WRF, RS_12 and UCM_12 runs enjoy the same performance.
(4) The WRF model had a good performance on daytime when simulating the UHI intensity, but poor before daybreak time. The WRF model with the RS_12 and UCM_12 geographic models can have an advantages performance than default geographic model though it not perfect to depict the observation.
As the changing of land-use data can have a significant impact on the WRF/UCM simulation result, this study provided more confidence that the WRF/UCM with extracted land use data from remote sensing dataset can be as an effective tool for urban thermal environment analysis. We are aslo to assess how the urban develop mode can affect the urban thermal environment in the future study.
Acknowledgments
This study was supported by the State Key Laboratory of Subtropical Building Science, South China University of Technology, China (Project No. 2015ZC12). The National Natural Science Foundation of China (Project No. 51408303), and the China Scholarship Council Program (No. [2013]3009). Helpful comments from Professor Yufeng Zhang and Dr. Xiaoshan Yang were greatly appreciated.
References
[1] Chen F, Yang X and Zhu W. WRF simulations of urban heat island under hot-weather synoptic conditions: The case study of Hangzhou City, China. Atmospheric Research. 2014; 138: 364-377. [2] Cheng FY, Hsu YC, Lin PL, et al. Investigation of the effects of different land use and land cover
patterns on mesoscale meteorological simulations in the Taiwan area. Journal of Applied Meteorology and Climatology. 2013; 52(3): 570-587.
[3] Wei R, Shen X, Yang Y. Urban Real-Time Traffic Monitoring Method Based on the Simplified Network Model. International Journal of Multimedia & Ubiquitous Engineering. 2016; 11(3): 199-208.
[4] Cotilla-Sanchez E, Hines PDH, Barrows C, et al. Comparing the Topological and Electrical Structure of the North American Electric Power Infrastructure. Systems Journal IEEE. 2011; 6(4): 616-626. [5] Elvidge CD, Baugh KE, Kihn EA, et al. Relation between satellites observed visible-near infrared
emissions, population, economic activity and electric power consumption. International Journal of Remote Sensing. 1997; 18(6): 1373-1379.
[6] Foley JA, DeFries R, Asner GP, et al. Global consequences of land use. Science. 2005; 309(5734): 570-574.
[7] Wei Feng, Wenxing Bao. An Improved Technology of Remote Sensing Image Fusion Based Wavelet Packet and Pulse Coupled Neural Net. TELKOMNIKA (Indonesian Journal of Electrical Engineering). 2012; 10(3): 551-556.
[8] Kusaka H, Kondo H, Kikegawa Y, et al. A simple single-layer urban canopy model for atmospheric models: Comparison with multi-layer and slab models. Boundary-Layer Meteorology. 2001; 101(3): 329-358.
[9] Saxena S. Extension to HiRLoc Algorithm for Localization Error Computation in Wireless Sensor Networks. Indonesian Journal of Electrical Engineering and Informatics (IJEEI). 2013; 1(4): 119-126. [10] Lu D, Tian H, Zhou G, et al. Regional mapping of human settlements in southeastern China with
multisensor remotely sensed data.Remote Sensing of Environment. 2008; 112(9): 3668-3679. [11] Maisongrande P, Duchemin B and Dedieu G. VEGETATION/SPOT: an operational mission for the
Earth monitoring; presentation of new standard products. International Journal of Remote Sensing. 2004; 25(1): 9-14.
[12] Meng, Yan-xia Z, Jiang-nan L, et al. Application of WRF/UCM in the Simulation of a Heat Wave Event and Urban Heat Island around Guangzhou. Journal of Tropical Meteorology. 2011; 17(3): 74-81.
[13] Miao S, Chen F, LeMone MA, et al. An Observational and Modeling Study of Characteristics of Urban Heat Island and Boundary Layer Structures in Beijing. Journal of Applied Meteorology & Climatology. 2009, 48(3): 54-59.
[14] Z Yang, J Zhou, F Lang. Detection Algorithm of Airport Runway in Remote Sensing Images.
TELKOMNIKA Indonesian Journal of Electrical Engineering. 2014; 12(4): 2776-2783.
[15] Weng Q. Land use change analysis in the Zhujiang Delta of China using satellite remote sensing, GIS and stochastic modelling. Journal of environmental management. 2002; 64(3): 273-284.
[16] Yang L, Huang C, Homer CG, et al. An approach for mapping large-area impervious surfaces: synergistic use of Landsat-7 ETM+ and high spatial resolution imagery.Canadian Journal of Remote Sensing. 2003; 29(2): 230-240.
[17] Dadkhah M, Obeidat MM, Jazi MD, Sutikno T, Riyadi MA. How can we identify hijacked journals?