CONTRASTING PATTERN AND LIMITED CONNECTIVITY
IN TROPICAL SEAGRASS
Enhalus acoroides
(HYDROCHARITACEAE) AT WESTERN REGION OF THE
INDO-MALAY ARCHIPELAGO REVEALED BY
MICROSATELLITE DNA
I NYOMAN GIRI PUTRA
GRADUATE SCHOOL
BOGOR AGRICULTURAL UNIVERSITY BOGOR
DECLARATION OF ORIGINALITY
I hereby declare that the master thesis entitled “Contrasting pattern and limited connectivity in tropical seagrass Enhalus acoroides (Hydrocharitaceae) at western region of the Indo-Malay Archipelago revealed by microsatellite DNA” and the work reported herein was composed by and originated entirely from my supervisors and I. I declare that this is a true copy of my thesis, as approved by my supervisory committee and has not been submitted for a higher degree to any other University or Institution. Information derived from the published and unpublished work of others has been acknowledged in the text and references are given in the list of sources.
Bogor, July 2015
RINGKASAN
I NYOMAN GIRI PUTRA. Pola yang kontras dan konektivitas terbatas pada lamun tropis Enhalus acoroides (Hydrocharitaceae) di bagian barat Kepulauan Indo-Malay diungkap menggunakan DNA mikrosatelit. Dibimbing oleh Hawis H. Madduppa dan Made Pharmawati.
Bagian barat dari Kepulauan Indo-Malay sering dihubungkan dengan barier Indo-Pasifik yang memisahkan antara Samudra Hindia dan Pasifik. Berbagai studi filogeografi menunjukkan bahwa terdapat perbedaan struktur genetik antara biota di samudra Hindia dan Pasifik. Meskipun cukup banyak penelitian filogeografi di Hindia dan Pasifik akan tetapi hanya sedikit dari penelitian tersebut yang memfokuskan penelitiannya di Kepulauan Indo-Malay. Studi terhadap fauna laut menunjukkan bahwa pola filogeografi biota di kepulauan Indo-Malay cukup kompleks bahkan tiap spesies cenderung menunjukkan pola yang berbeda. Sementara itu studi filogeografi menggunakan tumbuhan laut belum pernah dilaporkan sebelumnya. Oleh sebab itu penelitian ini akan mengkaji pola filogeografi dari lamun Enhalus acoroides menggunakan delapan lokus mikrosatelit.
Tujuan dari penelitian ini yaitu: (1) menghitung keragaman genetik E. acoroides di bagian barat dari Kepulauan Indo-Malay, (2) menghitung perbedaan genetik antar populasi dan (3) menerangkan pola filogeografi dari E. acoroides.
Dalam penelitian ini, sebanyak 202 spesimen E. acoroides dikumpulkan dari tujuh lokasi pengambilan sampel (Aceh, Anambas, Batam, Bangka, Tunda, Pramuka, dan Karimun Jawa). Total DNA diekstraksi menggunakan DNeasy plant mini kit (Qiagen®) dengan tahapan ekstraksi mengikuti protokol dari perusahaan. Amplifikasi DNA dilakukan menggunakan delapan lokus mikrosatelit (Eaco_001, Eaco_009, Eaco_019, Eaco_050, Eaco_051, Eaco_052, Eaco_054, Eaco_055).
Hasil penghitungan nilai genotipe menunjukkan bahwa hanya ada enam lokus (dari delapan lokus) yang berhasil diamplifikasi dan polimorfik. Penelitian ini menunjukkan bahwa E. acoroides memiliki keragaman genetik tinggi dengan nilai heterozigositas pengamatan dan harapan secara berturut-turut berkisar dari 0.434 - 0.615 dan 0.458 - 0.605. Nilai statistic F (pairwiseθ berkisar antara 0.127 and 0.359) menunjukkan perbedaan genetik yang signifikan antar lokasi dengan dengan nilai P < 0.001. Analisis isolation by distance juga menunjukkan hasil signifikan (P=0.008) yang mengindikasikan aliran gen terbatas pada semua lokasi.
Pohon Neighbour Joining berdasarkan jarak genetik DA dan analisis klaster Bayesian menunjukkan ada 3 klaster utama dari E. acoroides. Analysis of Molecular Variance (AMOVA) menunjukkan bahwa ketiga grup ini signifikan berbeda dengan nilai P < 0.05. Hasil studi ini menunjukkan bahwa pola filogeografi dari E. acoroides dipengaruhi oleh peristiwa membeku dan mencairnya es selama Pleistocene. Kondisi fisik oceanografi saat ini seperti arus selatan Jawa dan arus musiman juga memegang peran penting dalam pembentukan struktur genetik E. acoroides. Hasil penelitian ini akan menyediakan data genetik yang dapat digunakan untuk tujuan konservasi lamun dan design manajemen unit (MUs).
SUMMARY
I NYOMAN GIRI PUTRA. Contrasting pattern and limited connectivity in tropical seagrass Enhalus acoroides (Hydrocharitaceae) at western region of the Indo-Malay Archipelago revealed by microsatellite DNA. Supervised by Hawis H. Madduppa dan Made Pharmawati
The western region of the Indo-Malay Archipelago is often associated with the Indo-Pacific barrier (IPB), separating Indian and Pacific oceans. Various phylogeographic studies of marine biota throughout Indian and Pacific oceans found genetic partition between these two oceans. Although many phylogeographic studies in the Indian and Pacific oceans have been reported, only a few of these studies focus on the Indo-Malay Archipelago. Previous studies found that genetic structure of marine faunas in Indo-Malay Archipelago is clearly complex, seemingly each species showed different pattern. Meanwhile phylogeographic studies using marine plant have not been reported previously. Therefore, this study will reveal phylogeographic pattern of E. acoroides using eight microsatellite loci.
This study has three main objectives that include the following: (1) to examine genetic diversity of E. acoroides in western region of the Indo-Malay Archipelago, (2) to examine genetic differentiation among all sites and (3) to infer phylogeographic pattern of of E. acoroides.
A total of 202 E. acoroides specimens from seven localities (Aceh, Anambas, Batam, Bangka, Tunda, Pramuka, and Karimun Java) were collected. At each location, 18-42 individuals were taken in a zigzag pattern along the line transect. Total genomic DNA was extracted using DNeasy plant mini kit (Qiagen®)
following the manufacturer’s protocol. DNA amplification was performed using eight microsatellite loci (Eaco_001, Eaco_009, Eaco_019, Eaco_050, Eaco_051, Eaco_052, Eaco_054, Eaco_055).
Genotypic scoring showed only six loci (of eight loci) were successfully amplified and polymorphic. This study showed that E. acoroides has high genetic diversity among all sites. The observed and expected heterozygosity ranged from from 0.434 to 0.615 and from 0.458 to 0.605, respectively. F-statistics (pairwise θ ranges between 0.127 and 0.359) revealed high genetic differentiation between all sites (P < 0.001). A pattern of significant isolation by distance (P = 0.008) was observed among all sites indicating restricted gene flow among all sites.
Neighbour Joining tree based on DA distance revealed three major clusters of
E. acoroides consistent with Bayesian clustering analysis result. Further, Analysis of Molecular Variance (AMOVA) revealed significant partition of these groups (P < 0.05). Our result indicated that phylogeographic pattern of E. acoroides possibly influence by glaciation and deglaciation during Pleistocene. Recent physical oceanography such as South Java Current and seasonality reversing current also play a role in shaping genetic pattern of E.acoroides. These results will provide data for seagrass restoration purposes and management unit (MUs) design.
© Copyright owned by IPB, 2015
All rights reserved
Thesis
Submitted in partial fulfillments of the requirements for the degree of Master of Science at the
Bogor Agricultural University
CONTRASTING PATTERN AND LIMITED CONNECTIVITY
IN TROPICAL SEAGRASS
Enhalus acoroides
(HYDROCHARITACEAE) AT WESTERN REGION OF THE
INDO-MALAY ARCHIPELAGO REVEALED BY
MICROSATELLITE DNA
GRADUATE SCHOOL
BOGOR AGRICULTURAL UNIVERSITY BOGOR
2015
Thesis Title : Contrasting pattern and limited connectivity in tropical seagrass
Enhalus acoroides (Hydrocharitaceae) at western region of the Indo-Malay Archipelago revealed by microsatellite DNA
Name : I Nyoman Giri Putra Student ID : C551124041
Major : Marine Science
Approved by,
Supervisor
Dr. Hawis H.Madduppa, S.Pi. M.Si Head-supervisor
Ir. Made Pharmawati, M.Sc. Ph.D Co-supervisor
Endorsed by,
Head of Major Marine Science
Dr. Neviaty P. Zamani, M.Sc.
Dean of Graduate School
Dr. Ir. Dahrul Syah, M.Sc. Agr
ACKNOWLEDGEMENT
This study is mainly funded by PEER (the Partnerships for Enhanced Engagement in Research, No: PGA-2000003438) funded by United States Agency for International Development (USAID) and the National Science Foundation (NSF) in partnership with NSF-PIRE Program. This was also funded by the government of Indonesia through the Indonesia Endowment Fund for Education (LPDP).
I would like to express my appreciation to Indonesian Education Scholarship (BPI) managed by LPDP for Master program scholarship in Bogor Agricultural University (IPB). I would like to thank Dr. Hawis H. Madduppa, M.Si and Ir. Made Pharmawati, M.Sc. Ph.D. as my supervisors for their supervision and guidance. I also thank Dr. Irma Shita Arlyza, M.Si. as external examiner for valuable comments. I would like to also thank Beginner Subhan and Dondy Arafat (Marine Biodiversity and Biosystematics Laboratory, IPB) for collecting samples in Batam, Ibu Widiastuti (Diponegoro University) for collecting samples in Karimun Jawa, Khalidin (Syah Kuala University) for sample collection in Aceh, Dedi, Gugun and Okto for their assistance with sample collection in Bangka.
I would like to also express my gratitude to Indonesian Biodiversity Research Center (IBRC) who had facilitated all the research works, provided research networks, organized sampling collection and provided laboratory tools and equipments. This specifically goes to Aji Wahyu Anggoro, Dita Cahyani and Prof. IGN Mahardika for their contribution in assuring the research running well. I would like to also thank Yuliana Fitri Syamsuni, Samsul Bahri, Astria Yusmalinda, Rizki Wulandari, Andrianus Sembiring, Masriana, Eka Maya Kurniasih, Dian Pertiwi and Angka Mahardini from IBRC for their helps in laboratory and field work.
TABLE OF CONTENTS
LIST OF TABLES vi
LIST OF FIGURES vi
LIST OF APPENDIX vi
INTRODUCTION 1
Background 1
Problem Description 2
Research Objectives 3
MATERIALS AND METHODS 3
Study Area and Sample Collection 3
DNA Extraction and Amplification 5
Data Analysis 6
Genetic Diversity and Hardy-Weinberg Equilibrium (HWE) 6
Population Structure 6
RESULTS AND DISCCUSSION 7
Results 7
DNA Isolation and Amplification 7
Genetic Diversity and Hardy-Weinberg Equilibrium 8
Genetic differentiation 9
Phylogenetic and Bayesian Clustering Analysis 10
Analysis of Molecular Variance (AMOVA) 11
Discussion 11
Genetic Diversity 11
Population Differentiation 12
Phylogeographic Pattern of E. acoroides 13
Implication for Restoration and Management 14
CONCLUSION AND FUTURE PERSPECTIVE 15
Conclusion 15
Future Perspective 15
REFERENCES 15
APPENDIX 21
LIST OF TABLES
1. Sampling location, abbreviation, geographical coordinates and the
number of samples (N) used in this study 4
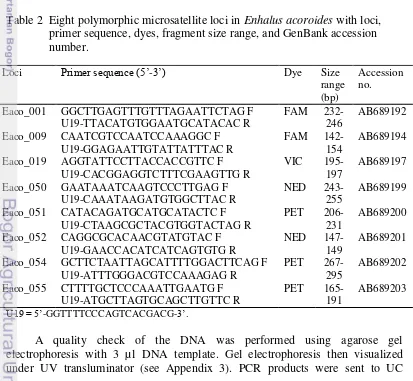
2. Eight polymorphic microsatellite loci in Enhalus acoroides with loci, primer sequence, dyes, fragment size range, and GenBank
accession number. 5
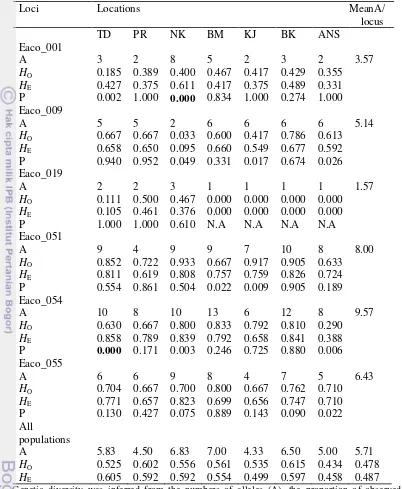
3. Summary of genetic diversity at six microsatellite loci at seven
locations for E. acoroides 9
4. Pairwise FST values (below diagonal) and significant FSTP values
(above diagonal) 10
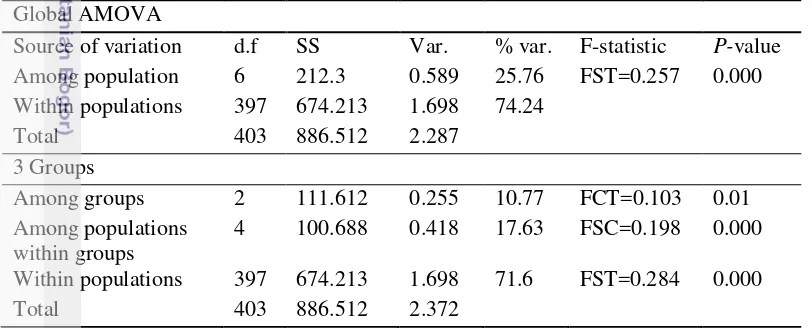
5. Result from hierarchical AMOVA for E. acoroides 12
LIST OF FIGURES
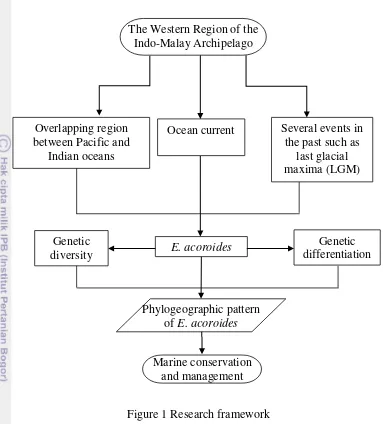
1. Research framework 3
2. Sampling location from which Enhalus acoroides were collected for present study. NK: Nakuri, BK: Bangka, BM: Batam, ANS: Anambas, TD: Tunda, PR: Pramuka, KJ: Karimun Jawa, SJC: South Java Current, SRC: Seasonal Reversing Current. 4 3. Gel electrophoresis of the DNA extraction product. Samples: lane
1-14, size marker: lane 15. 7
4. Multiplex PCR. Size marker: lane 1, samples: lane 2-8. 7 5. Single primer PCR. Size marker: lane 1, samples: lane 2-8. 8 6. Isolation by distance showed significant correlation between
genetic distance (pairwise FST values) and geographic distance
(see Appendix 5) with P = 0.008. 10
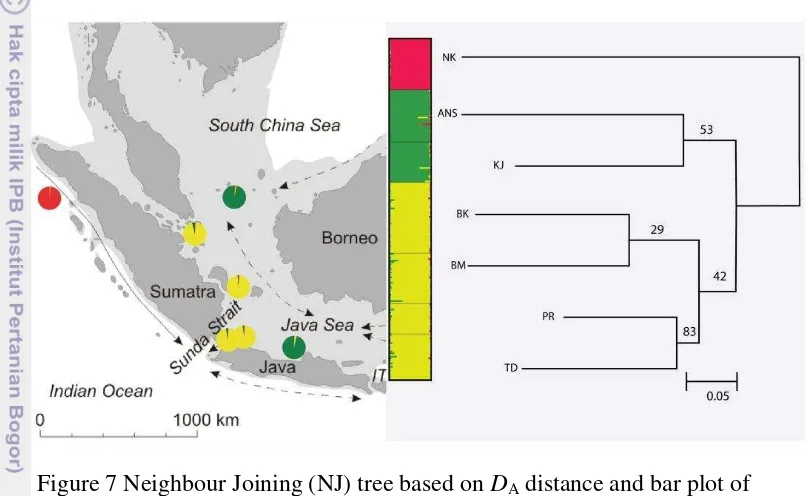
7. Neighbour Joining (NJ) tree based on DA distance and bar plot of Structure 2.3.4 revealed congruent results with all populations were divided into three clusters (NK/TD, PR, BK and BM/ANS and KJ). Each colour represents one cluster. 11
LIST OF APPENDIX
1. Sample collection and preservation. 20
2. Research documentation. (a) Sample collection, (b) Sample identification and preservation, (c) Desiccated sample, (d) Gel electrophoresis, (e) Enhalus acoroides, (f) DNA amplification. 21
3. Gel electrophoresis. 22
INTRODUCTION
Background
The Indo-Malay Archipelago, also known as Indo-Australian Archipelago (IAA) is one of the most important land barriers (The Indo-Pacific Barrier, IPB) separating the Indian and Pacific oceans (Crandall et al. 2008). Although the location of the boundary is debated, this barrier is most often associated with western region of Indo-Malay Archipelago (Sunda shelf) (Barber et al. 2006; DiBattista et al. 2012). Various levels of taxa confirmed the existence of these barriers, ranging from reef fishes of the Pomacanthidae (Thresher & Brothers 1985), marine gastropod Nerita albicilla (Crandall et al. 2008), crown-of-thorns
Acanthaster planci (Vogler et al. 2008; Yasuda et al. 2009) and Snapper fishes Lutjanidae (Gaither et al. 2009). Although many phylogeographic studies in the Indian and Pacific ocean have been reported, only a few of these studies focus on the Indo-Pacific Barrier (Carpenter et al. 2011; Keyse et al. 2014). Though this barrier was an overlapping region of organisms from both ocean (Gaither & Rocha 2013).
The western Indo-Malay Archipelago mostly constitutes of large lands mass such as Sumatra, Thai-Malay Peninsula, Borneo, and the Greater Sundas. During the ice age period, these islands formed a large land known as Sunda shelf (Voris 2000). Despite their same geological origin, population structures of flora and fauna in these islands is not simple. Studies of the mantis shrimp Haptosquilla pulchella revealed sharp genetic break across Java seas, which divided population into the north (Pasific) and south (Indian) (Barber et al. 2002). Other studies on giant clams Tridacna crocea (DeBoer et al. 2014), tuna and mackerel (Jackson et al. 2014) showed that the population of Sumatra in western Indonesia represent the Indian ocean population while the population of Java represents middle Indonesian population. Thus, the phylogeographic patterns shown by the two islands is quite complex.
Gene flow is driven by various factors such as currents and geological history of a location. In eastern Indonesia, Halmahera Eddy and Indonesian Throughflow are the main factors shaping biogeographic barrier between eastern and western Indonesia (Barber et al. 2006; Carpenter et al. 2011). Another study found that water circulation and eddy located at the southern tip of Sumatra plays a role in maintaining the genetic structure of mangrove Rhizophora mucronata
Lam. in the Malay Peninsula and Sumatra (Wee et al. 2014). Geological history such as the emergence of Sunda shelf during the Pleistocene period, are the main factors that inhibit larval dispersal and genetic exchange between the Indian and Pacific which then triggers lineage diversification in both oceans (Carpenter et al.
2011)
(Arnaud-2
Haond et al. 1999) and marine gastropod Nerita plicata (Crandall et al. 2008) indicated lack genetic structuring. Study of marine plants such as mangroves with DNA nuclear marker revealed genetic discontinuity of mangrove Rhizophora mucronata Lam. at the boundary between the Andaman sea and Malacca Strait (Wee et al. 2014). Meanwhile phylogeographic studies using seagrass has not been reported previously.
Seagrass is marine angiosperm lives in coastal areas on a substrate of sand, mud or a mixture of both and the entire life cycle occurs below sea level. Enhalus acoroides is one of seagrass species that widely spread in the Indo-Pacific from southern Japan, Southeast Asia, northern Australia, southern India and Sri Lanka (Short & Waycott 2010). In Indonesia, E. acoroides can be found in Papua, North Maluku, Ambon, Sulawesi, Bali, Java, Kalimantan, and Sumatra (Kiswara & Hutomo 1985). This species is easily distinguished from other seagrass because it has long leaves, black stringy rhizome, and usually form a bed. Fruits of E. acoroides could floats up to 10.2 days (Lacap et al. 2002). Meanwhile, median dispersal ability of seeds and fruits could reach 0.1 (max. 3.7) km and 41 (max. 63.5) km, respectively (Lacap et al. 2002), which might limiting the dispersal of
E. acoroides. Species with limited dispersal frequently hypothesized to be more genetically structured (Bay et al. 2006).
In this study, eight microsatellite markers (Nakajima et al. 2012) were used to infer phylogeographic pattern of E. acoroides. These DNA marker are widely used because they are both codominant and highly polymorphic (Beebee & Rowe 2008). Microsatellites have been found to be very useful and broadly used in region of the Indo-Malay Archipelago often showed complex phylogeographic patterns eventhough the islands originate from the same geologic history. Previous studies agreed that phylogeographic pattern of marine biota could be affected by several factor such as current, larval dispersal ability, several events in the past (e.g. Last Glacial Maxima, LGM) and the characteristics of each species.
3
Figure 1 Research framework
Research Objectives
The aims of this study are:
1. To evaluate the genetic diversity of E. acoroides in the western region of the Indo-Malay Archipelago using microsatellite DNA
2. To examine genetic differentiation among sites
3. To infer phylogeographic pattern of E. acoroides in the western region of the Indo-Malay Archipelago
MATERIALS AND METHODS
Study Area and Sample Collection
A total of 202 E. acoroides specimens from seven localities over Java and Sumatra were collected in 2014 (Figure 2, Table 1). At each location, 18-42 individuals were taken in a zigzag pattern along the line transect. To avoid
The Western Region of the Indo-Malay Archipelago
Several events in the past such as
last glacial maxima (LGM) Ocean current
Overlapping region between Pacific and
Indian oceans
E. acoroides
Marine conservation and management Phylogeographic pattern
of E. acoroides
Genetic diversity
4
collection of the same genet, only one shoot was collected within a diameter of 5 m (see Appendix 1). Collected shoots were rinsed with fresh water to remove epiphytic algae. A young leaf from each shoot was desiccated with silica gel and preserved at room temperature until use (see Appendix 2). Molecular work was conducted at Indonesian Biodiversity Research Center (IBRC), Bali from March 2014 – April 2015.
Figure 2 Sampling location from which Enhalus acoroides were collected for present study. NK: Nakuri, BK: Bangka, BM: Batam, ANS: Anambas, TD: Tunda, PR: Pramuka, KJ: Karimun Jawa, SJC: South Java Current, SRC: Seasonal Reversing Current.
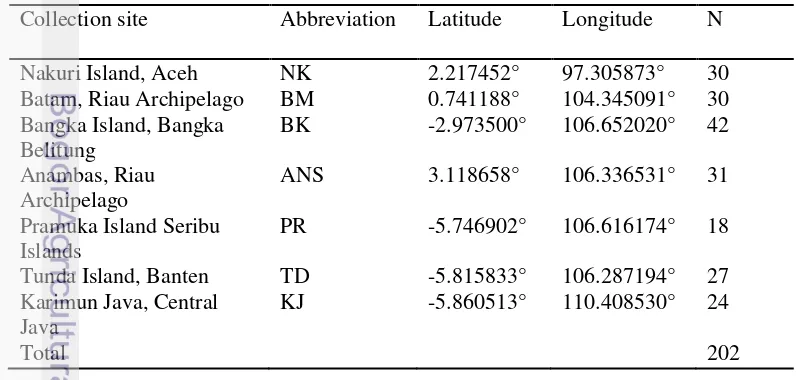
Table 1 Sampling location, abbreviation, geographical coordinates and the number of samples (N) used in this study
Collection site Abbreviation Latitude Longitude N
Nakuri Island, Aceh NK 2.217452° 97.305873° 30
Batam, Riau Archipelago BM 0.741188° 104.345091° 30 Bangka Island, Bangka
Belitung
BK -2.973500° 106.652020° 42
Anambas, Riau Archipelago
ANS 3.118658° 106.336531° 31
Pramuka Island Seribu Islands
PR -5.746902° 106.616174° 18
Tunda Island, Banten TD -5.815833° 106.287194° 27 Karimun Java, Central
Java
KJ -5.860513° 110.408530° 24
5
DNA Extraction and Amplification
Silica gel-dried leaves (5 cm in length) from each shoot were grounded using mortar. Genomic DNA was extracted using DNeasy plant mini kit (Qiagen®) following the manufacturer’s protocol. Eight microsatellites loci (Eaco_001, Eaco_009, Eaco_019, Eaco_050, Eaco_051, Eaco_052, Eaco_054, Eaco_055) developed by Nakajima et al. (2012) were used to score genotypes (Table 2). Forward primer labeled with 6FAM, VIC, NED, or PET.
Polymerase Chain Reaction (PCR) was performed into two ways. (i) First, five loci (Eaco_001, Eaco_009, Eaco_019, Eaco_051, Eaco_054) was amplified using multiplex PCR Kit (Qiagen®) in a total 10 µl reaction containing 3 µl ddH2O, 5 µl PCR Master Mix, 1 µl primer mix and 1 µl template DNA. PCR cycling was carried out for 5 min at 950C, followed by 35 cycles of 30 s at 950C, 1.5 min at 570C and 30 s at 720C with an extension of 30 min at 600C in the final cycle. (ii) Second, PCR of three loci (Eaco_050, Eaco_052, Eaco_055) was carried out in total 20 µl reaction containing 7.8 µl ddH2O, 2 µl PCR gold buffer, 2 µl MgCl2, 2 µl dNTP, 1.5 µl of each primer (forward and reverse), 0.2 µl Amplitaq Gold (Applied Biosystem®) and 3 µl DNA template. PCR cycling was carried out for 15 min at 950C, followed by 32 cycles of 30 s at 940C, 1.5 min at 580C and 60 s at 720C with an extension of 30 min at 600C in the final cycle. All PCR cycle was performed on 2720 Thermal cycler (Applied Biosystem®).
Table 2 Eight polymorphic microsatellite loci in Enhalus acoroides with loci, primer sequence, dyes, fragment size range, and GenBank accession number.
U19 = 5’-GGTTTTCCCAGTCACGACG-3’.
6
Berkeley DNA sequencing Facility, USA for fragment analysis. GeneScan™ 500 LIZ® (Applied Biosystems®) was used as internal line standard. Individual genotypes were scored using Geneious ver. 7.0.6.
Data Analysis
Genetic Diversity and Hardy-Weinberg Equilibrium (HWE)
The number of alleles (A), observed heterozigosities (HO) and expected heterozigosities (HE) were calculated using Genalex ver. 6.5 (Peakall & Smouse 2012). Departure from the Hardy–Weinberg equilibrium (HWE) for each locus in all populations was computed via the Markov Chain method (dememorization = 1000, batch = 100, iterations per batch = 1000) using Genepop on the web (Raymond & Rousset 1995). Levels of statistical significance were corrected according to a Holm Bonferroni correction (Holm 1979). Micro-checker (Van Oosterhout et al. 2004) was used to test existence of null alleles and genotypic scoring error due to stuttering with 1000 randomizations and 95% confidence level.
Population Structure
Genetic structure among populations was assessed in multiple ways. First, Genetic differentiation was estimated between pairs of populations with the
estimator θ (Weir & Cockerham 1984) as implemented in Arlequin ver. 3.5.1 (Excoffier & Lischer 2010). Isolation by distance (IBD) was used to infer correlation between genetic and geographical distance. Geographical distance between sampling locations was calculated as the shortest distance by sea between all pair of locations using the PATH tool implemented in Google Earth (Google Earth Plus for Windows). Pairwise genetic distance was plotted against the geographical distance and the correlation between the two distances was tested using Isolation By Distance Web Service (IBDWS) version 3.23 (Jensen et al.
2005) with 10.000 randomizations.
Second, phylogenetic relationship among population was inferred using Poptree2 (Takezaki et al. 2010) with the Neighbour Joining method (Saitou & Nei 1987) and Nei’s DA distance (Nei et al. 1983). Bootstrapping was performed at 1.000 replicates. Tree topology was edited using Mega 5 (Tamura et al. 2011).
Third, Structure 2.3.4 (Pritchard et al. 2000) was used to infer population structure and assign individuals to clusters based on microsatellite genotype. Ten replicate runs were conducted for each K between 1 and 10 using admixture model and assuming correlated allele frequencies (Falush et al. 2003). Each run consisted of 20.000 burn-in and 100.000 Markov Chain Monte Carlo (MCMC).
The best K was determined using the ΔK method (Evanno et al. 2005) as implemented in Structure Harvester (Earl & VonHoldt 2012). Run data were merged by Clumpp (Jakobsson & Rosenberg 2007) and population structure then displayed graphically using Distruct (Rosenberg 2004).
7 regional groupings and enforcing regional partitions according to groups identified by NJ and Structure 2.3.4.
RESULTS AND DISCCUSSION
Results
DNA Isolation and Amplification
Figure 3 showed total DNA extraction product, extracted using DNeasy plant mini kit (Qiagen®) following manufacturer’s protocol. This extraction method produced thick and clear DNA band patterns. The size marker on the edge of the gel was use to estimating the mass (quantity) of DNA manually.
Figure 3 Gel electrophoresis of the DNA extraction product. Samples: lane 1-14, size marker: lane 15.
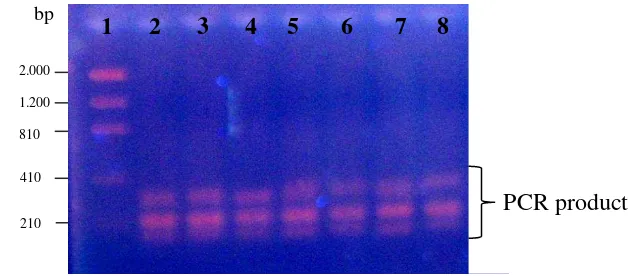
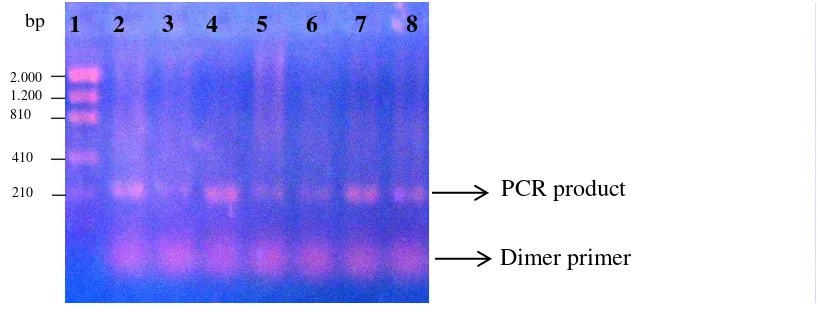
DNA visualization using 1% agarose gel showed that multiplex PCR had clearer and thicker bands than standard PCR (Figure 4). Multiplex PCR produced more than one bands in a single gel lane since this PCR using a group of primers and each primer would produce different size of fragment length. Meanwhile standard PCR produced only a single band DNA since this PCR used only a pair of primer (Figure 5). Single PCR also showed existence of the dimer primer (residues of the primer).
Figure 4 Multiplex PCR. Size marker: lane 1, samples: lane 2-8.
1 2 3 4 5 6 7 8 9 10 11 12 13 14 15 bp
2.000 1.200 810 410 210 100
bp
2.000 1.200 810 410
210
1 2 3 4 5 6 7 8
8
Figure 5 Single primer PCR. Size marker: lane 1, samples: lane 2-8.
Genetic Diversity and Hardy-Weinberg Equilibrium
Two loci (Eaco_052 and Eaco_050) were not used for further analysis. Eaco_052 only had one type of allele in all populations (monomorphic), while the Eaco_050 was not successfully amplified in most of samples. Thus, only six loci (Eaco_001, Eaco_009, Eaco_019, Eaco_051, Eaco_054, and Eaco_055) were used for further analysis (Table 3).
A total of 89 alleles (see Appendix 4, for allele frequency) were detected across six microsatellites loci ranging from one allele at the locus Eaco_019 in BM, KJ, BK, and ANS populations to 13 alleles at the locus Eaco_054 in the BM population. The mean number of alleles per locus ranged from 1.57 to 9.57 and the mean number of alleles per population ranged from 4.33 to 7.00 (Table 2). The BM population had the highest average number of alleles, while the lowest was found in the KJ population. The levels of the observed and expected heterozygosities varied from 0.434 to 0.615 and from 0.458 to 0.605, respectively. The TD population had the highest HE value (0.605), while the ANS showed the lowest HE (0.458).
Five loci consisted of Eaco_001 in TD and NK, Eaco_009 in KJ and ANS, Eaco_051 in KJ, Eaco_054 in TD, NK, ANS and Eaco_055 in ANS were found to deviate significantly from Hardy-Weinberg equilibrium (P < 0.05) prior to Holm Bonferroni correction. Two loci (Eaco_001 in NK and Eaco_054 in TD) significantly deviated from Hardy-Weinberg equilibrium after Holm Bonferroni correction (P < 0.05). However, according to Micro-checker, these populations were possibly in HWE with two loci suggest presence of null alleles. Thus, null alleles are the most probable explanation for the deviation from Hardy-Weinberg equilibrium, although Wahlund effect and deviation from panmixia are also possible. Thus, all populations were possibly in Hardy-Weinberg equilibrium.
1 2 3 4 5 6 7 8 9 10 11 12 13 14 15 16
PCR product Dimer primer
bp
9 Table 3 Summary of genetic diversity at six microsatellite loci at seven
locations for E. acoroides
Genetic diversity was inferred from the numbers of alleles (A), the proportion of observed heterozygosities (HO) and expected heterozygosities (HE). Exact P value associated with the
Weinberg equilibrium (P). Numbers in bold indicate significant deviation from Hardy-Weinberg equilibrium at P < 0.05 after Holm Bonferroni corrections. TD: Tunda, PR: Pramuka, NK: Nakuri, BM: Batam, KJ: Karimun Java, BK: Bangka, ANS: Anambas.
Genetic differentiation
Pairwise FST values ranged from 0.127 to 0.359. FST was statistically highly significant between all pairs of samples with P < 0.001 (Table 4). The highest genetic differentiation was found between samples from NK and ANS (FST = 0.359), while the lowest was found between TD and PR and between BM and BK (FST = 0.127). These result indicated high levels of genetic differentiation among
10
populations of E. acoroides. Isolation by distance (IBD) revealed significant correlation between genetic differentiation and geographic distance across all pairs of samples with P = 0.008 (Figure 6).
Table 4 Pairwise FST values (below diagonal) and significant FSTP values (above diagonal)
TD PR NK BM KJ BK ANS
TD - *** *** *** *** *** ***
PR 0.127 - *** *** *** *** ***
NK 0.290 0.302 - *** *** *** ***
BM 0.235 0.270 0.301 - *** *** ***
KJ 0.225 0.273 0.338 0.247 - *** ***
BK 0.175 0.203 0.214 0.127 0.247 - ***
ANS 0.298 0.348 0.359 0.293 0.239 0.303 -
*** P < 0.001.
Figure 6 Isolation by distance showed significant correlation between genetic distance (pairwise FST values) and geographic distance (see Appendix 5) with P = 0.008.
Phylogenetic and Bayesian Clustering Analysis
11 Cluster 2, consists of two populations in Java (TD and PR) and two populations in Sumatra (BK and BM). The highest bootstrap support was found between TD and PR. Cluster 3 shows discordance between genetic and geographic distance. These populations were separated about 1095 km but they were closely related.
The ΔK test in Structure (Pritchard et al. 2010) indicated the optimum value
of ΔK at K = 3 with a secondary peak at K = 7. At K = 3, Structure 2.3.4 analysis
mirror those seen in NJ tree with three major clusters (NK/KJ, ANS/TD, PR, BM and BK) (Figure 7). With K set to 7, each population becomes different cluster (not shown).
Figure 7 Neighbour Joining (NJ) tree based on DA distance and bar plot of Structure 2.3.4 revealed congruent results with all populations were divided into three clusters (NK/TD, PR, BK and BM/ANS and KJ). Each colour represents one cluster.
Analysis of Molecular Variance (AMOVA)
AMOVA analysis with no a priori regional structure indicates highly significant genetic partitioning among populations (25.76%) and among individuals within population (74.24%) with FST = 0.257 and P < 0.001 (Table 5). When populations were divided into three regions according to phylogenetic relationship and clustering analysis (NK/TD, PR, BK, BM/KJ, ANS), 10.17% variance were resided among groups with FCT = 0.103 (P < 0.05). Variances among population within group and among individual within group were 17.63% and 71.6 %, respectively.
Discussion
Genetic Diversity
12
found that observed heterozygosities were 0.436 – 0.582, respectively (Pharmawati et al. 2015). Nakajima et al. (2014) revealed observed heterozygosities of E. acoroides ranged from 0.165 – 0.575 in three locations (Japan, China, and Philippines) using nine microsatellite loci. Other study found heterozygosities of E. acoroides varied from 0.100 to 0.567 in China (Gao et al.
2012).
The genetic diversity studies of other seagrass species showed almost similar result. Alberto et al. (2008) revealed level of observed heterozygosities of
Cymodocea nodosa ranged from 0.296 to 0.750 across Mediterranean-Atlantic transition region using eight microsatellites loci. In other regions, heterozygosities of Zostera marina ranged from 0.491 to 0.563 in San Quintin Bay, Mexico using eight marker (Muniz-Salazar et al. 2006). Serra et al. (2010) found the heterozygosities of Posidonia oceanica ranged from 0.212 – 0.569 in Mediterranean using 12 microsatellites loci. Genetic diversity, like species diversity, may be most important for enhancing the consistency and reliability of ecosystems by providing biological insurance against environmental change (Hughes & Stachowicz 2004). Degradation and loss of seagrass meadows has led to the general notion of low genetic diversity, extensive clonality and minimal gene flow among populations (Coyer et al. 2004).
Table 5 Result from hierarchical AMOVA for E. acoroides
Global AMOVA
Source of variation d.f SS Var. % var. F-statistic P-value Among population 6 212.3 0.589 25.76 FST=0.257 0.000 Within populations 397 674.213 1.698 74.24
Total 403 886.512 2.287 component, % var: percentage of variances, F-statistics among region, among populations within regions, and within populations, P-value for F-statistics.
Population Differentiation
13 continuous for 2 to 5 days but the maximum distance move by a seed was only 204 cm.
Limited dispersal distances are also indicated from another seagrass species such as Thalassia hemprichii (Lacap et al. 2002) and T. testudinum (Davis et al.
1999). Hosokawa et al. (2015) found that seed dispersal in the Zostera marina is mostly within the parent bed. Spatial autocorrelation analysis showed fine scale genetic pattern in two Z. marina populations on the Baltic Coast (Hämmerli & Reusch 2003). Becheler et al. (2010) also found fine scale significant genetic differentiation among quadrats separated by less than 100 m for Z. marina. Thus, the local genetic differentiation maybe common in seagrass species although large geographic genetic homogeneity also found in Z. noltii (Coyer et al. 2004).
Limited dispersal of seagrass is probably caused by several factor such as short buoyancy period, low seed production, and low survival of seeds that disperse further from its meadow of origin (Lacap et al. 2002; Arnaud-Haond et al.
2007). Another factor probably related to habitats, coastal habitats are frequently more discontinuous because has more barrier to dispersal such as current, predation, temperature etc., than deeper water habitats (Lourie et al. 2005; Poortvliet et al. 2013). Thus, dispersal in shallow habitats should be more difficult and populations become isolated from the other sites.
Phylogeographic Pattern of E. acoroides
Phylogenetic relationships among E. acoroides suggest partition into three major groups consistent with Bayesian clustering analysis. Moreover, hierarchical AMOVA support these significant partitioned with P < 0.05. NK showed distinct genetic structure from the six other sites, represent the western Indonesian population (Indian population). Divergence of the western Indonesian (Indian population) are hypothesized as result to Pleistocene vicariance (Barber et al.
2000; Crandall et al. 2008; Yasuda et al. 2009). Low sea level during Pleistocene would result in the entire Sunda shelf becoming terrestrial, thus limiting dispersal of E. acoroides to the rim of Sunda shelf. Similar genetic pattern has been reported in previous research such as in false clownfish Amphiprion ocellaris
(Nelson et al. 2000), mantis shrimp Haptosquilla pulchella (Barber et al. 2002), coral reef fish Caesio cuning (Ackiss et al. 2013), giant clam Tridacna crocea
(DeBoer et al. 2014), tuna and mackerel (Jackson et al. 2014).
Historical process may contribute to the observed patterns of genetic structure but they may also result or be reinforced by more recent physical oceanography (DeBoer et al. 2014). South Java Current (SJC) is a unidirectional current, flow down the west coast of Sumatra. This current probably acts as barrier to dispersal of E. acoroides between NK and the other sites. Current can acts as barrier to dispersal or forcing for genetic homogeneity. The importance of current in shaping the genetic structure have been reported in both large and small geographical scale (Barber et al. 2002; Galarza et al. 2009; Yasuda et al. 2009; Zhan et al. 2009; Wee et al. 2014).
The genetic structuring of cluster 2 mirrors the genetic structure in three of four species Hippocampus (Lourie et al. 2005) and Nerita albicilla (Crandall et al.
14
acoroides find an appropriate habitat across Seribu Islands, Bangka, Batam and used it as stepping stone to long distance dispersal.
Another factor probably related to the alternating monsoon in Indonesia. Two alternating monsoon generated seasonally reversing current (SRC) across Java, Natuna, and South China seas. These reversing currents would also create a complexity of local oceanographic features. Although previous research could not find any relations between genetic pattern and seasonal current in Sunda shelf (Nelson et al. 2000) but this result indicated the SRC maybe play an important role in dispersalof E. acoroides.
Close relationship of E. acoroides population of KJ and ANS indicated inconsistent correlation between genetic and geographic distance. These two sites were genetically close related even they separated about 1095 km. This genetic pattern probably influenced by sea level changes during Pleistocene. When the sea level was at 30 m below present level (BPL), land bridges connected Sumatra and Kalimantan via Bangka Belitung were likely to have been lost (Voris 2000). Thus, both the Java and Natuna seas become connected and this connection could be facilitated gene flow between ANS and KJ.
Although fruits and seeds of E. acoroides has limited dispersal, long distance dispersal could be due to floating reproductive shoots (Harwell & Orth 2002). Floating reproductive shoots with mature seeds were found to remain positively buoyant for up to 2 week and retain mature seeds for up to 3 week before release under laboratory conditions (Harwell & Orth 2002). Exceptional climatic events such as hurricanes or typhoons possibly reinforce long distance dispersal (Lacap et al. 2002; Kendall et al. 2004). Long distance dispersal of E. acoroides could be reinforces by ocean current (Nakajima et al. 2014).
Implication for Restoration and Management
The result of the present study indicated limited connectivity and highly genetic differentiation between all sampling sites. Therefore the differentiated populations should be considered as Management Units (MUs) for conservation measurements. Any activities resulting in gene mixing such as transplanting seed or plants to other sites should be avoided. Introduction of genotypes that are distinct from native populations may lead to higher mortality if not locally adapted or the introduced genotypes may mate with local genotypes producing offspring that are less fit (Williams 2001).
15
CONCLUSION AND FUTURE PERSPECTIVE
Conclusion
Genetic diversity analysis revealed high level of observed and expected heterozygosities between all sampling sites. Our result also indicated low gene flow among sites of E. acoroides as suggest by highly significant genetic differentiation and positive correlation of isolation by distance. Strong genetic differences were observed between population from NK and the six others. These probably represent Pleistocene vicariance between Indian and Pacific population. Recent Seasonality current maybe plays a role in long dispersal of E. acoroides
since the phylogeographic pattern match these two alternating current pattern.
Future Perspective
To prove the hypothesis that seasonality reversing currents also affect the connectivity of E. acoroides in Anambas and Karimun Java, it would require additional sampling sites at several locations such as around the coast of West Kalimantan, eastern Belitung and several islands in Natuna seas.
REFERENCES
Ackiss AS, Pardede S, Crandall ED, Ablan-Lagman MCA, Ambariyanto, Romena N, Barber PH, Carpenter KE. 2013. Pronounced genetic structure in a highly mobile coral reef fish, Caesio cuning, in the Coral Triangle. Mar Ecol Prog Ser. 480:185–197.
Adams SM, Lindmeier JB, Duvernell DD. 2006. Microsatellite analysis of the phylogeography, Pleistocene history and secondary contact hypotheses for the killifish, Fundulus heteroclitus. Mol Ecol. 15:1109–1123.
Alberto F, Massa S, Manent P, Diaz-Almela E, Arnaud-Haond S, Duarte CM, Serrão EA. 2008. Genetic differentiation and secondary contact zone in the seagrass Cymodocea nodosa across the Mediterranean-Atlantic transition region. J Biogeogr. 35:1279–1294.
Arnaud-Haond S, Bonhomme F, Borsa P. 1999. Mitochondrial DNA analysis of the genetic relationships among populations of scad mackerel (Decapterus macarellus, D. macrosoma, and D. russelli) in South-East Asia. Mar Biol.
135:699–707.
Arnaud-Haond S, Migliaccio M, Diaz-Almela E, Teixeira S, van de Vliet MS, Alberto F, Procaccini G, Duarte CM, Serrão EA. 2007. Vicariance patterns in the Mediterranean Sea: east-west cleavage and low dispersal in the endemic seagrass Posidonia oceanica. J Biogeogr. 34:963–976.
Barber PH, Erdmann M V, Palumbi SR. 2006. Comparative phylogeography of three codistributed stomatopods: origins and timing of regional lineage diversification in the Coral Triangle. Evolution (N Y). 60:1825–1839.
Barber PH, Palumbi SR, Erdmann M V, Moosa MK. 2000. Biogeography: A
16
Barber PH, Palumbi SR, Erdmann M V., Moosa MK. 2002. Sharp genetic breaks among populations of Haptosquilla pulchella (Stomatopoda) indicate limits to larval transport: Patterns, causes, and consequences. Mol Ecol. 11:659–674. Bay LK, Crozier RH, Caley MJ. 2006. The relationship between population
genetic structure and pelagic larval duration in coral reef fishes on the Great Barrier Reef. Mar Biol. 149:1247–1256.
Becheler R, Diekmann O, Hily C, Moalic Y, Arnaud-Haond S. 2010. The concept of population in clonal organisms: mosaics of temporally colonized patches are forming highly diverse meadows of Zostera marina in Brittany. Mol Ecol. Implications for Marine Management. J Mar Biol. 2011:1–14.
Coyer JA, Diekmann OE, Serrão EA, Procaccini G, Milchakova N, Pearson GA, Stam WT, Olsen JL. 2004. Population genetics of dwarf eelgrass Zostera noltii
throughout its biogeographic range. Mar Ecol Prog Ser. 281:51–62.
Crandall ED, Frey MA, Grosberg RK, Barber PH. 2008. Contrasting demographic history and phylogeographical patterns in two Indo-Pacific gastropods. Mol Ecol. 17:611–626.
Davis J, Childers D, Kuhn D. 1999. Clonal variation in a Florida Bay Thalassia testudinum meadow:molecular genetic assessment of population structure. Mar
Ecol Prog Ser. 186:127–136.
DeBoer TS, Naguit MRA, Erdmann M V, Ablan-Lagman MCA, Carpenter KE, Toha AHA, Barber PH. 2014. Concordant phylogenetic patterns inferred from mitochondrial and microsatellite DNA in the giant clam Tridacna crocea. Bull Mar Sci. 90:301–329.
DeBoer TS, Subia MD, Ambariyanto, Erdmann M V., Kovitvongsa K, Barber PH. 2008. Phylogeography and limited genetic connectivity in the endangered boring giant clam across the coral triangle. Conserv Biol. 22:1255–1266. DiBattista JD, Rocha LA, Craig MT, Feldheim KA, Bowen BW. 2012.
Phylogeography of two closely related Indo-Pacific butterflyfishes reveals divergent evolutionary histories and discordant results from mtDNA and microsatellites. J Hered. 103:617–629.
Earl DA, VonHoldt BM. 2012. STRUCTURE HARVESTER: A website and program for visualizing STRUCTURE output and implementing the Evanno method. Conserv Genet Resour. 4:359–361.
Evanno G, Regnaut S, Goudet J. 2005. Detecting the number of clusters of individuals using the software STRUCTURE: A simulation study. Mol Ecol. 14:2611–2620.
Excoffier L, Lischer HEL. 2010. Arlequin suite ver 3.5: A new series of programs to perform population genetics analyses under Linux and Windows. Mol Ecol Resour. 10:564–567.
17 Falush D, Stephens M, Pritchard JK. 2003. Inference of population structure using multilocus genotype data: Linked loci and correlated allele frequencies.
Genetics. 164:1567–1587.
Gaither MR, Rocha LA. 2013. Origins of species richness in the Indo-Malay-Philippine biodiversity hotspot: evidence for the centre of overlap hypothesis.Dawson M, editor. J Biogeogr. 40:1638–1648.
Gaither MR, Toonen RJ, Robertson DR, Planes S, Bowen BW. 2009. Genetic evaluation of marine biogeographical barriers: perspectives from two widespread Indo-Pacific snappers (Lutjanus kasmira and Lutjanus fulvus). J Biogeogr. 37:133–147.
Galarza JA, Carreras-Carbonell J, Macpherson E, Pascual M, Roques S, Turner GF, Rico C. 2009. The influence of oceanographic fronts and early-life-history traits on connectivity among littoral fish species. Proc Natl Acad Sci U S A. 106:1473–1478.
Gao H, Jiang K, Geng Y, Chen X-Y. 2012. Development of microsatellite primers of the largest seagrass, Enhalus acoroides (Hydrocharitaceae). Am J Bot. 99:e99–e101.
Hämmerli A, Reusch TBH. 2003. Genetic neighbourhood of clone structures in eelgrass meadows quantified by spatial autocorrelation of microsatellite markers. Heredity (Edinb). 91:448–455.
Harwell MC, Orth RJ. 2002. Long-Distance Dispersal Potential in a Marine Macrophyte. Ecology. 83:3319–3330.
Holm S. 1979. A Simple Sequentially Rejective Multiple Test Procedure. Scand J Stat. 6:65–70.
Hosokawa S, Nakaoka M, Miyoshi E, Kuwae T. 2015. Seed dispersal in the seagrass Zostera marina is mostly within the parent bed in a protected bay.
Mar Ecol Prog Ser. 523:41–56.
Hughes AR, Stachowicz JJ. 2004. Genetic diversity enhances the resistance of a seagrass ecosystem to disturbance. Proc Natl Acad Sci U S A. 101:8998–9002. Jackson AM, Erdmann M V, Toha AHA, Stevens LA, Barber PH. 2014.
Phylogeography of commercial tuna and mackerel in the Indonesian Archipelago. Bull Mar Sci. 90:471–492.
Jakobsson M, Rosenberg NA. 2007. CLUMPP: A cluster matching and permutation program for dealing with label switching and multimodality in analysis of population structure. Bioinformatics. 23:1801–1806.
Jensen JL, Bohonak AJ, Kelley ST. 2005. Isolation by distance, web service.
BMC Genet. 6:13.
Kendall MS, Battista T, Hillis-Starr Z. 2004. Long term expansion of a deep
Syringodium filiforme meadow in St. Croix, US Virgin Islands: The potential role of hurricanes in the dispersal of seeds. Aquat Bot. 78:15–25.
Keyse J, Crandall ED, Toonen RJ, Meyer CP, Treml EA, Riginos C. 2014. The scope of published population genetic data for Indo-Pacific. Bull Mar Sci. 90:1–32.
Kiswara W, Hutomo M. 1985. Habitat dan sebaran geografik lamun. Oseana. 10:21–30.
Koskinen MT, Nilsson J, Veselov AJ, Potutkin AG, Ranta E, Primmer CR. 2002. Microsatellite data resolve phylogeographic patterns in European grayling,
18
Lacap CDA, Vermaat JE, Rollon RN, Nacorda HM. 2002. Propagule dispersal of the SE Asian seagrasses Enhalus acoroides and Thalassia hemprichii. Mar Ecol Prog Ser. 235:75–80.
Liu SYV, Dai CF, Allen GR, Erdmann MV. 2012. Phylogeography of the neon damselfish Pomacentrus coelestis indicates a cryptic species and different species origins in the West Pacific Ocean. Mar Ecol Prog Ser. 458:155–167. Lourie SA, Green DM, Vincent ACJ. 2005. Dispersal, habitat differences, and
comparative phylogeography of Southeast Asian seahorses (Syngnathidae: Hippocampus). Mol Ecol. 14:1073–1094.
Madduppa HH, Timm J, Kochzius M. 2014. Interspecific, spatial and temporal variability of self-recruitment in anemonefishes. PLoS One. 9:e90648.
Muniz-Salazar R, Talbot SL, Sage GK, Ward DH, Cabello-Pasini A. 2006. Genetic structure of eelgrass Zostera marina meadows in an embayment with restricted water flow. Mar Ecol Prog Ser. 309:107–116.
Nakajima Y, Matsuki Y, Lian C, Fortes MD, Uy WH, Campos WL, Nakaoka M, Nadaoka K. 2012. Development of novel microsatellite markers in a tropical seagrass, Enhalus acoroides. Conserv Genet Resour. 4:515–517.
Nakajima Y, Matsuki Y, Lian C, Fortes MD, Uy WH, Campos WL, Nakaoka M, Nadaoka K. 2014. The Kuroshio current influences genetic diversity and population genetic structure of a tropical seagrass, Enhalus acoroides. Mol Ecol. 23:6029–44.
Nei M, Tajima F, Tateno Y. 1983. Accuracy of estimated phylogenetic trees from molecular data - II. Gene frequency data. J Mol Evol. 19:153–170.
Nelson JS, Hoddell RJ, Chou LM, Chan WK, Phang VPE. 2000. Phylogeographic structure of false clownfish, Amphiprion ocellaris , explained by sea level changes on the Sunda shelf. Mar Biol. 137:727–736.
Van Oosterhout C, Hutchinson WF, Wills DPM, Shipley P. 2004. MICRO-CHECKER: Software for identifying and correcting genotyping errors in microsatellite data. Mol Ecol Notes. 4:535–538.
Peakall R, Smouse PE. 2012. GenALEx 6.5: Genetic analysis in Excel. Population genetic software for teaching and research-an update. Bioinformatics. 28:2537– 2539.
Pharmawati M, Putra ING, Syamsuni YF, Mahardika IGNK. 2015. Genetic diversity of Enhalus acoroides (L.) Royle from coastal waters of Pramuka Island, Lembongan Island, and Waigeo Island, Indonesia, based on microsatellite DNA. Adv Sci Lett. 21:199–202.
Poortvliet M, Longo GC, Selkoe K, Barber PH, White C, Caselle JE, Perez-Matus A, Gaines SD, Bernardi G. 2013. Phylogeography of the California sheephead,
Semicossyphus pulcher: the role of deep reefs as stepping stones and pathways to antitropicality. Ecol Evol. 3:4558–4571.
Pritchard JK, Stephens M, Donnelly P. 2000. Inference of population structure using multilocus genotype data. Genetics. 155:945–959.
Raymond M, Rousset F. 1995. GENEPOP (version 1.2): population genetics software for exact tests and ecumenicism. J Hered. 86:248–249.
Rosenberg NA. 2004. DISTRUCT: A program for the graphical display of population structure. Mol Ecol Notes. 4:137–138.
19 Serra IA, Innocenti AM, Di Maida G, Calvo S, Migliaccio M, Zambianchi E, Pizzigalli C, Arnaud-Haond S, Duarte CM, Serrao EA, Procaccini G. 2010. Genetic structure in the Mediterranean seagrass Posidonia oceanica: disentangling past vicariance events from contemporary patterns of gene flow.
Mol Ecol. 19:557–568.
Short FT, Waycott M. 2010. Enhalus acoroides. IUCN Red List Threat Species Version 20143 [Internet]. [cited 2015 Apr 15]. Available from: http://www.iucnredlist.org/
Suárez NM, Betancor E, Klassert TE, Almeida T, Hernández M, Pestano JJ. 2009. Phylogeography and genetic structure of the Canarian common chaffinch (Fringilla coelebs) inferred with mtDNA and microsatellite loci. Mol Phylogenet Evol. 53:556–564.
Takezaki N, Nei M, Tamura K. 2010. POPTREE2: Software for constructing population trees from allele frequency data and computing other population statistics with windows interface. Mol Biol Evol. 27:747–752.
Tamura K, Peterson D, Peterson N, Stecher G, Nei M, Kumar S. 2011. MEGA5: Molecular evolutionary genetics analysis using maximum likelihood, evolutionary distance, and maximum parsimony methods. Mol Biol Evol. 28:2731–2739.
Thresher RE, Brothers EB. 1985. Reproductive ecology and biogeography of Indo-West Pacific Angelfishes (Pisces: Pomacanthidae). Evolution (N Y). 39:878–887.
Vogler C, Benzie J, Barber PH, Erdmann M V, Ambariyanto, Sheppard C, Tenggardjaja K, Gérard K, Wörheide G. 2012. Phylogeography of the crown-of-thorns starfish in the Indian Ocean. PLoS One. 7:e43499.
Vogler C, Benzie J, Lessios H, Barber P, Worheide G. 2008. A threat to coral reefs multiplied? Four species of crown-of-thorns starfish. Biol Lett. 4:696– 699.
Voris HK. 2000. Maps of Pleistocene sea levels in SoutheastAsia: shorelines, river systems and time durations. J Biogeogr. 27:1153–1167.
Wee AKS, Takayama K, Asakawa T, Thompson B, Sungkaew S, Tung NX, Nazre M, Soe KK, Tan HTW, Watano Y, et al. 2014. Oceanic currents, not land masses, maintain the genetic structure of the mangrove Rhizophora mucronata Lam. (Rhizophoraceae) in Southeast Asia. J Biogeogr. 41:954–964. Weir BS, Cockerham CC. 1984. Estimating F-statistics for the analysis of
population structure. Evolution (N Y). 38:1358–1370.
Williams SL. 2001. Reduced genetic diversity in eelgrass transplantation affects both population growth and individual fitness. Ecol Appl. 11:1472–1488. Yasuda N, Nagai S, Hamaguchi M, Okaji K, Gérard K, Nadaoka K. 2009. Gene
flow of Acanthaster planci (L.) in relation to ocean currents revealed by microsatellite analysis. Mol Ecol. 18:1574–1590.
Zhan A, Hu J, Hu X, Zhou Z, Hui M, Wang S, Peng W, Wang M, Bao Z. 2009. Fine-scale population genetic structure of Zhikong scallop (Chlamys farreri): do local marine currents drive geographical differentiation? Mar Biotechnol
20
Appendix 1 Sample collection and preservation.
Laboratorium Biodiversitas dan Biosistematika Kelautan IPB
Gd. Marine Center Jl. Agatis, No.1, FPIK, IPB Bogor 16680
I. Tata Cara Pengambilan sampel Lamun
1) Sampel diambil dari tepi pantai ke arah tengah laut hingga mencapai 200 m. 2) Jarak antar titik sampling minimal 5 meter. Sampel diambil secara zig-zag.
3) Pada tiap titik diambil sampel daun lamun yang masih muda dari masing-masing individu lamun. Panjang daun yang diambil kurang lebih 50 cm. Untuk lamun yang ukuran daunnya kecil bisa diambil lebih dari satu daun. Lokasi tiap titik sampling ditentukan dengan GPS dan dicatat.
4) Sampel yang telah diambil dimasukkan ke dalam plastik dan dilabel.
II. Labelling
Penulisan label dilakukan sebagai berikut:
1) Nama pemilik sampel_kode spesies_wilayah_nomor individu, contoh: GP_Ea_Tda_01
(Giri Putra_Enhalus acoroides_pulau tunda_sampel nomor 1)
2) Apabila ada sampel yang belum diketahui spesiesnya diberikan kode X, contoh:
GP_X_Tda_01
III. Preservasi
1) Sampel dicuci dengan air mengalir untuk membersihkan kotoran dan epifit. 2) Sampel dikeringkan dengan tissue lalu dipotong-potong dengan ukuran 5 cm.
3) Masukkan potongan daun ke dalam plastik ziplock yang telah ditambahkan silika gel.
21 Appendix 2 Research documentation. (a) Sample collection, (b) Sample
identification and preservation, (c) Desiccated sample, (d) Gel electrophoresis, (e) Enhalus acoroides, (f) DNA amplification.
(1) (2)
(3) (4)
22
Appendix 3 Gel electrophoresis.
Instruments
Agarose gel : 1% (0.75 gr agarose + 75 ml TAE buffer ) Ethidium bromide (EtBr) : 4µl
Low mass ladder : 4 µl
Template DNA : 3 µl
Loading dye : 1 µl
Electrophoresis setting :100 volt, 400 Amp, 30 minutes.
Procedure
1) Put the comb into electrophoresis tray.
2) Mix 0.75 gr agarose powders with 75 ml TAE buffer. Put it in the microwave until the mixture boils. Add 4 µl Etbr and mix it.
3) Pour the mixture into the electrophoresis plate, wait until the gel turn into solid. Remove the comb and put the gel into electrophoresis chamber.
4) Mix 3 µl of template DNA with 1 µl loading dye and load it into gel’s well.
5) Run the gel at 100 volt, 400 Amp for 30 menit. 6) Visualize the gel using UV transluminator.
agarose 1 % microwave
Etbr 4 µl
comb
tray
DNA + loading dye
Run at100 volt, 400 Amp, 30 minutes
UV transluminator
1
2
3
4
5
23 Appendix 4 Allele frequencies and sample size by populations.
26
Appendix 5 Geographic distance between all sampling sites (in km).
TD PR NK BM KJ BK ANS
TD - 37.3 1418 850 456 328 1000
PR - 1456 834 419 317 986
NK - 1706 1875 1716 2050
BM - 1000 511 356
KJ - 525 1095
BK - 682
27
ABOUT THE AUTHOR
I Nyoman Giri Putra was born in Kintamani, Bali on 12 March 1987. He is the eldest son of I Wayan Bakti and Ni Wayan Suardi. He had his elementary school at SDN 1 Belantih, Kintamani and his junior school was at SMP 2 Kintamani. He finished his junior high school at SMAN 4 Denpasar in 2007. He became a student at Ganesha University of Education, Faculty of Mathematics and Science, Department of Biology Education and graduated with a Bachelor of Education in 2011. He was interested in biology since junior high school and had won medal in biology competitions at regional and national levels.