Journal of Applied Horticulture , 18(2): 87-99, 2016
Integrated use of GIS, AHP and remote sensing in land use
planning for tropical high altitude vegetable crops
Widiatmaka*
Department of Soil Science and Land Resources, Bogor Agricultural University, Indonesia *E-mail: [email protected]; [email protected]
Abstract
In Indonesia, Java Island still contributes a large amount of the total number of vegetables produced. In this tropical country, vegetables are produced in two different agro-ecological conditions, which are high altitude and low altitude. The rapidly increasing population growth has caused the centre’s production of high altitude vegetables on Java Island to be increasingly pressured by other types of land utilization. This study was conducted in one of the production centres of tropical high altitude vegetable crops in the upper slope area of Mts Gede-Pangrango, West Java, covering an area of 78,290 ha. The research objective was to delineate the suitable land that is available for high altitude vegetables crops. In the irst step, land suitability was analysed using multi-criteria decision-making methodology. The criteria used include those grouped within the parameters of land, topography, climate and ease of management; criterion consists of sub-criteria. The criteria were weighted using the Analytical Hierarchy Process, while sub-criteria were scored according to their contributions to land suitability. The weights of the criteria and scores of the sub-criteria were used for delineating land suitability in a geographic information system model. In the second step, the land availability was analysed by taking into account the constraints of forest area status designation and the spatial pattern of oficial land use plan map. Results of both analyses were used to delineate suitable and available land for tropical high altitude vegetables crops. The results showed that the amount of land that was suitable and available for tropical high altitude vegetables crops was 23.7% of the analysed area. The area of suitable and available land that is actually not used yet is 9% of the area analysed, which could be recommended for the expansion of vegetable crops. Land that is suitable and available, either land that is already used or land that is not yet used, could be designated as priority lands to be protected from the pressure of non-agricultural land utilization in order to maintain the sustainability of vegetable availability.
Key words: Land suitability, land availability, multi-criteria decision-making, spatial overlay, SPOT-6 imagery.
Introduction
Vegetables are herbaceous species that have parts that can be consumed by humans, either the leaves, roots, hypocotyl, stem, petiole or lower buds (Shannon and Grieve, 1999). In daily life, eating vegetables is one of humans’ primary needs. Inadequate intake of vegetables and fruit has caused millions of deaths each year, making it one of the top ten risk factors contributing to mortality (Weinberger and Lumpkin, 2005). The World Health Organization (WHO) recommends a minimum of 400 g of fruits and vegetables per day, excluding potatoes and other starchy tubers (ISHS, 2012). Increasing the number of population would increase the need for vegetables. As is the implication, more vegetable production will be required in the future. On the other hand, the land available for production becomes more and more limited due to the population increase, which will also increase the need for land for various uses (Pilehforooshha et al., 2014; Zhang et al., 2014). One of the implications for agriculture is the necessity of selecting agricultural land that has a high level of suitability for cultivation (Widiatmaka et al., 2014, 2015a) so that higher production can be achieved in each parcel of land.
Indonesia is one of the important tropical countries producing vegetables and fruits. ISHS (2012) notes that Indonesia is the 6th largest horticulture producer in the world after China, India, Nigeria, the USA and Brazil. Data from the Ministry of Agriculture (2014) shows that Indonesian production of fruits
and vegetables in 2013 was 18.3 million tons of fruits and 11.6 million tons of vegetables. Such data indicate that vegetables are one of the important agricultural products in Indonesia.
Agricultural and food production are highly inluenced by agro-ecology and the environment (Francis et al., 2013). In a tropical country such as Indonesia, the farming of vegetables is highly inluenced by altitude. Different vegetables can be found in the high altitudes as well as in the low altitudes. Many vegetables are temperate in origin, and productivity remains low under tropical conditions (Singh et al., 2015). However, a temperate-like agro-ecology may be achieved by increasing the altitude. Some of vegetables that are traditionally grown in high altitude areas are cabbage, caulilower, carrots, broccoli, chives, potatoes and others. Other types of vegetables such as beans and eggplant are traditionally cultivated in the lowlands. Many deinitions can be used to deine high altitude agriculture. Midmore and Poudel (1996) divides the agro-ecological zones for growing vegetables as cool highland and warm-dry and warm-wet lowlands based on an agro-ecological environment without height deinitions. Lin et al. (2013) deines high altitude agriculture in his research as agriculture that is cultivated at an altitude of more than than 500 m above sea level (a.s.l.). In the case of Indonesia, the Ministry of Agriculture (2006) has issued oficial recommendations after various assessments in accordance with Indonesian agro-ecology (Saida et al., 2010, 2011) for the cultivation of tropical high altitude vegetables. In these recommendations, high altitude
Journal
is expressed as the area at an altitude of 700 m a.s.l. or more. With the Indonesian agro-ecosystem ranging from the coast to the plains and mountains, a region with an altitude of more than 700 m a.s.l. covers a wide area that reaches 3.28 million hectares (Subiksa et al., 2012). This figure shows the high potential of Indonesia for the development of tropical high altitude agricultural products including vegetables.
One of the major problems facing Indonesia is the insuficiency of agricultural production to meet the needs of its high number of population, which in 2015 is estimated at 255 million (Statistics Indonesia, 2015). Currently, the consumption of vegetables in Indonesia reached 40.66 kg.capita-1.year-1 (Directorate General
of Horticulture, 2010). Such a consumption igure is still far from the FAO recommendations, which reached 73 kg.capita-1.year-1
(Directorate General of Horticulture, 2010), and so theoretically, the total requirement of vegetables for such a large Indonesian population should be increased in the future, reaching more than 15 million tons.year-1 in the next ten years (Directorate General
of Horticulture, 2010). The actual insuficiency of production is relected, among others, by the fact that the country’s need for vegetables is actually supplied from imports. The statistical data of the Ministry of Agriculture (2014) note that the import value of 11 kinds of vegetables in 2013 was US $ 476.8 million, while the export value of the same products was only US $ 20.5 million. Another serious problem in terms of vegetables suficiency is an imbalance of production between regions in Indonesia. Of the total planting area of Indonesian vegetables of 1,099,847 ha, there is an area of 565,734 ha or 51.4% that is located on Java Island (Ministry of Agriculture, 2014, data processed). From this planting area, the total production of vegetables from ive provinces on Java Island was 6,844,902 tons, or 59.2% of the total Indonesian vegetable production. This igure indicates the very high dependence on the vegetable production of Java Island. This phenomenon is not just occuring in vegetables and fruits, but also for the products of other food crops such as rice, corn and soybeans (Statistics Indonesia, 2014a). The problem is that Java Island is a small island, which covers only 6.7% of the total Indonesian land area (Statistics Indonesia, 2015). Moreover, this small island is inhabited by more than 60% of Indonesia’s population (Statistics Indonesia, 2015), and so, the pressure on agricultural land is very high (Verburg et al., 1999; Widiatmaka et al., 2015b) due to this high density of population and its implied need of land for settlements, industry and other non-agricultural uses.
Faced with this phenomenon, land utilization on the island of Java should be regulated in a more strict and eficient way. One way to make eficient land utilization is to cultivate lands with a high level of suitability for a commodity. To that end, land evaluation tools are needed. Land evaluation could be considered as the core of land use planning (FAO, 1996; Roetter et al., 2005; Nguyen et al., 2015). Land evaluation is the process of determining the suitability of a given land for a certain type of use (agriculture, forest, recreation, etc.) and the level of suitability (FAO, 1976; Akinci et al., 2013). This concept comes from the fact that the successful cultivation of a plant is strongly inluenced by the biophysical conditions of the location. In the next step, cultivation of vegetables which are agro-ecologically suitable will provide economic beneits, giving prosperity to the people and protecting
the land and environment simultaneously. Thus, agricultural development and sustainable development (WCED, 1986) could be achieved. Experience shows that horticulture can offer good opportunities for poverty reduction because it increases income and generates employment (Weinberger and Lumpkin, 2007). Thus, land evaluation becomes a fundamental step in sustainable land management (Schwilch et al., 2011; Nyeko, 2012; Zolekar and Bhagat, 2015).
The method that is currently widely used in land use planning is integrating the land evaluation method with the geographic information system (GIS) and remote sensing. GIS is very useful in land evaluation due to its capability in acquisition, storage and extraction of georeferenced data (Mendas and Delali, 2012). Land suitability evaluation and mapping even become one of the most useful application of GIS in planning (Malczewski, 2004, 2006). Remote sensing give its contribution in a broad view, both spatial and temporal (Ambarwulan et al., 2010). The integrated use of land evaluation, remote sensing and GIS can be done in a decision-making system in land evaluation methodology, which is known as multi-criteria decision-making. In this manner, a lot of criteria that affect land suitability can be considered. There are various methods in multi-criteria decision-making (Raju, 2009), among others the methods of distance-based (where the best decision is based on the closest distance to the decision of the ideal), outranking-based (where that the decision is based on preference) and utility-based (where the alternative with the best utility is chosen) (Raju, 2009). Analytical hierarchy process (AHP)-based decision-making is one of the outranking-based decision-making methods that is widely used in land evaluation. In this method, the weight of a variety of criteria was irst determined using AHP, such weights were then applied to a weighted overlay in a GIS model. Such a multi-criteria method has been widely used in agriculture to assess the suitability of agricultural commodities singly, such as for coffee planting (Mighty, 2015), tobacco (Chen et al., 2010; Zhang et al., 2015), wheat (Mendas and Delali 2012; Sarkar et al., 2014), tea (Foshtomi et al., 2011; Li et al., 2012) and others. This type of assessment may also be done for agricultural use more generally without reference to a particular commodity, such as for example, the assessments done by Bandyopadhyay et al. (2009), Akinci et al. (2013), Zolekar and Bhagat (2015) and Kumar and Jhariya (2015). In addition to agriculture, this method has also been widely used, such as in disaster mitigation analysis (Feizizadeh et al., 2014; Dragicevic et al., 2015). In a wider application, this method also covers the areas of the environment (Finn et al., 2009), settlement (Qiu et al., 2010), forestry (Valente and Vettorazzi, 2008), industry (Komarovska et al., 2015), energy (Nerini et al., 2014) and tourism (Bunruamkaew and Murayama, 2011; Crecente et al., 2012). Reviews of the methodology and literature can be found in Malczewski (2004, 2006) and Raju (2009).
of crops (ISHS, 2012). However, it should also be noted that vegetable crops are also characterized by a high diversity of production systems and involve different species. The agro-ecological criteria for different plants may vary (FAO, 1976). For this reason, modelling for vegetables as well as for horticulture in general needs the generic approach. This modelling has even become one of the challenges in vegetable and horticultural modelling (Gary et al., 1998).
One of the areas that became the centre of vegetable production in Indonesia is West Java Province. This province produced 2.9 million tons of vegetables in 2013 or 25% of Indonesian vegetable production (Ministry of Agriculture, 2014). Most of the vegetables are produced in high altitude agricultural areas because this province has a lot of mountains. One of the centres of tropical high altitude vegetable production in West Java is an area located at the upper slopes between Mount Pangrango and Mount Gede. Although this area has the potential for growing tropical high altitude vegetable crops, the area also has the potential for other major types of land utilization, causing high competition. Other land utilizations that are fairly extensive are tea plantations and tourism. The increasing mountainous touristic object has recently caused the growth of settlements and villas, causing pressure on agricultural land. This pressure is more pronounced for vegetable crops because they involve small farmers with low income compared to the tea plantations owned by large state companies. Therefore, agricultural land, in this case an area with a high potential for vegetables, needs to be identiied in the context of protecting it against pressure for non-agricultural uses. In the future, protection could be accomplished, for example in the form of subsidies for farmers (Qin et al., 2015); however, the identiication of such potential land should be done irst. Against such a background, this study aims to delineate suitable and available land for tropical high altitude vegetables crops. Analysis of the irst phase will be carried out using multi-criteria decision-making for land evaluation to determine the land’s suitability. Furthermore, an analysis of the land availability will be carried out on such suitable land. Prioritization can then be carried out regarding land that is suitable and available.
Materials and methods
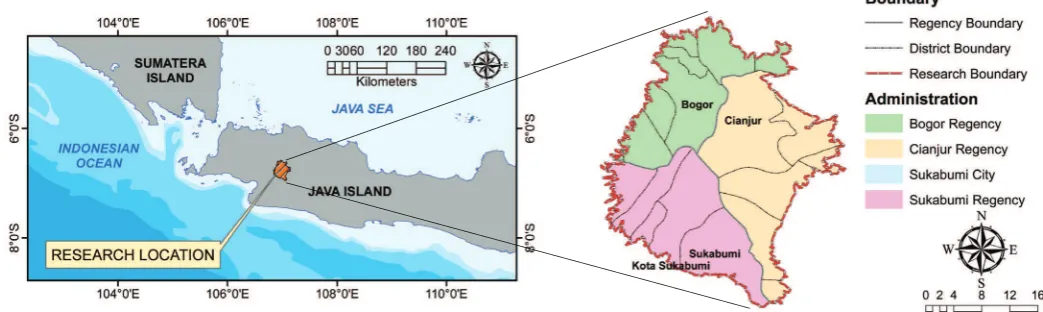
Research area: The research was carried out in the upper slope area, situated between Mt. Pangrango and Mt Gede, called “Puncak” (meaning “high altitude place” in the Indonesian
language). Geographically, the study area is located at 106o50’30
“-107o9’30” East and 6o34’30 “-6o57’30” South. Mt. Pangrango
(3,019 m) is located side-by-side with Mt. Gede (2,958 m) (Syartinilia and Tsuyuki, 2008), and the upper valley between the two mountains is also a touristic and agricultural area, with tea and vegetable crops as the major agricultural products. Vegetable crops that are currently grown include cabbage, squash, celery, lettuce, potatoes, asparagus, broccoli, carrots, tomatoes, radishes, spring onions, beets, mustard, kailan, Chinese cabbage, chili peppers, garlic and scallions.
With the altitude limit taken at 700 m a.s.l. or more as stated by the Ministry of Agriculture (2006), the study area covers an area of 78,290 ha (Fig. 1). This area includes administratively Bogor Regency (22,541 ha, 7 districts), Cianjur Regency (30,287 ha, 7 districts), Sukabumi Regency (25,805 ha, 6 districts), and the City of Sukabumi (8.2 ha, one district).
Geologically, the study area is composed of rocks of diverse age, from recent alluvium sediment, Holocene, lower Miocene, middle Miocene, Pleistocene, Pliocene, upper Miocene until the upper Pleistocene (Sudjatmiko, 1972; Effendi et al., 1998). Rock breccia and lava from the mountain of Pangrango dominate, covering 50% of the area. Old volcano sediment is also quite dominant, reaching 30% of the area. The sedimentary and volcanic formation of Pangrango and Gede are scattered almost evenly.
The climate of the research area, as well as the general climate of Indonesia, is influenced by the tropical humid monsoon. In general, there are two seasons: the rainy season, which runs September-April, and the dry season, which runs April-September. Rainfall and temperature will be presented in detail in the description of the parameters used for this research; however as an illustration, the average rainfall in Bogor Regency, the closest regency, is 3,992.7 mm.year-1 (Statistics Bogor Regency, 2014).
Data: The data used in this study were structured in the criteria and sub-criteria. The criteria used for multi-criteria decision-making of land suitability for tropical high altitude vegetable crops can be grouped into three parameters: parameters of soil and land, which include the criteria of soil class and land capability class; parameters of topography, which includes criteria of slope class, altitude class and slope aspect class; parameters of climate, which include the criteria of temperature and rainfall; and parameters of ease of management, which include the criteria
Fig. 1.Research area of the upper slope area of Mts Gede-Pangrango, West Java Province, Indonesia
of land use/land cover, distance from roads and distance from the markets. The choice of the parameters used for analysis were done in light of the ield observations.
The parameter of soil and land was acquired from the soil map at a scale of 1: 50,000, compiled from Widiatmaka et al. (2006, 2007, 2012). This map is a result of detailing the soil map of 1: 250,000 (ICALRRD, 2011), using many local research sources including the student thesis, supplementary ield observations during 2014 and topographic detailing using the topographic map at scale of 1: 25,000. In this map, the soil is classiied up to the subgroup category (Soil Survey Staff, 2014); however for this research, the soil classiication used will only come from the great group category (Soil Survey Staff, 2014) in order to simplify the choice for decision-making. The data from such a map was also used to generate a land capability class map using the land capability criteria of Klingebiel and Montgomery (1961), which has been made in a quantitative way for Indonesian applications by Arsyad (2010).
Topographic parameters were obtained from topographic maps at a scale of 1:25,000, produced by the Indonesian Geospatial Information Agency. The whole research area was covered by the 12-sheet map, which was then integrated into a sheetless map for this research area. From these maps, the spatial treatment was completed using Arc-GIS 10.2. Using such software, the slope class map, which will be used for the slope criteria was derived using the Slope module in Spatial Analyst, while the slope aspect map, which will be used for the slope aspect criteria was obtained using the Aspect module in Spatial Analyst. The altitude class was obtained using the module of Reclassify, applied to Digital Elevation Model.
The climatic parameters, which include the criteria of rainfall,
temperature and relative humidity, were obtained from the Indonesian Agency for Meteorology, Climatology and Geophysics (BMKG). The data were obtained in the form of spatial data, resulting from climate spatialization of West Java Province data (Wulandari et al., 2012).
The land use/land cover criteria was obtained from the interpretation of SPOT-6 imagery on the acquisition date of March 2014. The imagery interpretation was done using supervised classiication with ERDAS Imagine software. Field checking was done in August 2014 in order to match the results of image interpretation with ground appearance. The data of market position was surveyed along with this ield checking by noting the coordinates using GPS. The data of distance from the road was obtained from topographic maps of 1:25,000. Distance was buffered in the GIS Spatial module.
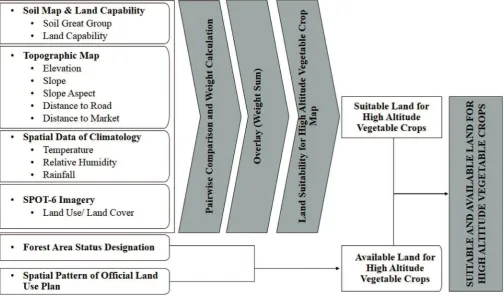
Analysis procedure: The overall analysis procedure for this research is presented schematically in Fig. 2. The land suitability analysis is performed using multi-criteria decision-making. Such decision-making is based on the weight of the criteria used. Weighting is done using the analytical hierarchy process (AHP) (Saaty, 2008). The AHP was conducted by interviewing ive experts. In AHP, the weighting is done on a scale of 1 to 9 by comparing in pairs the relative importance of each pair (Table 1). Criteria consisted of sub-criteria. For each of the sub-criteria in each criterion, a score is given. The scores given have a value ranging from 0 to 10 based on the level of importance of each sub-criteria. Scores are given based on the consensus of ive experts. The weight of the criteria generated from the AHP and the scores of the sub-criteria resulting from the consensus are then used to obtain a total weight value. These total weight values are then used to perform a GIS model for spatial overlaying. The
level of land suitability for tropical high altitude vegetable crops was carried out by dividing into quartiles, based on the following formula (Rahman and Saha, 2008; Cengiz and Akbulak, 2009):
1 S
n i i i
w x =
=
∑
where, S = land suitability; wi = weight of land suitability criteria; xi = score of sub-criteria i; and n = number of land suitability criteria.
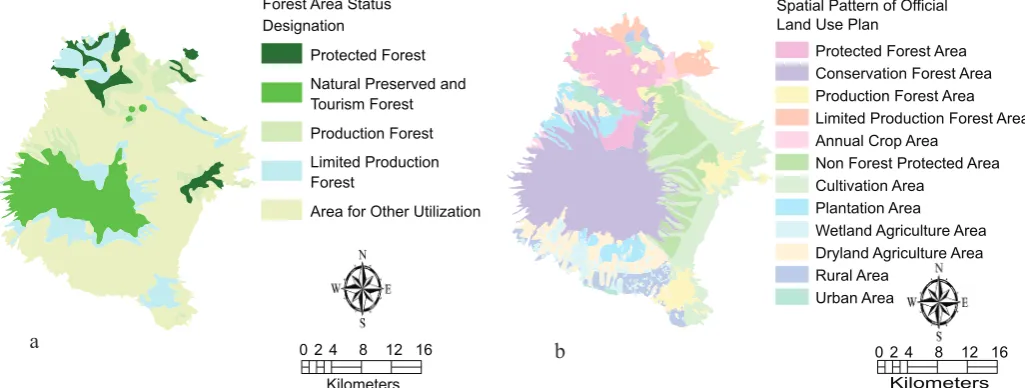
In analyzing the land availability, two maps were used to determine the constraint of land availability. First, the Forest Area Status Designation (FASD) map (Ministry of Forestry, 2009; Brockhaus et al., 2012) was used because the utilization of forest areas in Indonesia is set according to the regulations as outlined in the map. The FASD map for the study area is presented in Fig. 3a. In this map, the existing forest in the study area is classiied into ive classes, namely Protected Forest, Tourism and National Reserve Forest, Production Forest, Limited Production Forest, and Area for Other Utilization (AOU). The area that can be considered as available for agriculture is AOU, while the other forest classes are forest areas that are not allowed to be used other than for forestry purposes. The second map used is the Spatial Pattern of Oficial Land Use Plan (SP-OLUP) of West Java Province (Government of West Java, 2010). This map is designed for land allocation for a variety of formal sectors; the agricultural sector is just one of many sectors. Based on SP-OLUP of West Java, there are 12 land allocations (Fig. 3b). Of such land allocation, ones that can be used for agriculture include Cultivation Area, Annual Crop Area, Wetland Agriculture Area, Dry Land Agriculture Area and Rural Area; while land allocation that cannot be used for agriculture include Protected Forest Area, Conservation Forest Area, Production Forest Area, Limited Production Forest Area, Non-Forest Protected Area and Urban Area. The land allocation for Plantation Area is not included as available for use of vegetables crops.
In the next step, the suitable area and the available area were then overlayed in the GIS environment. Such a process will give an
output of suitable land that is available for tropical high altitude vegetables crops. The interpretation can then be given, both in terms of land that has actually been used for the cultivation of tropical high altitude vegetables crops and land which is currently not used but is suitable and available.
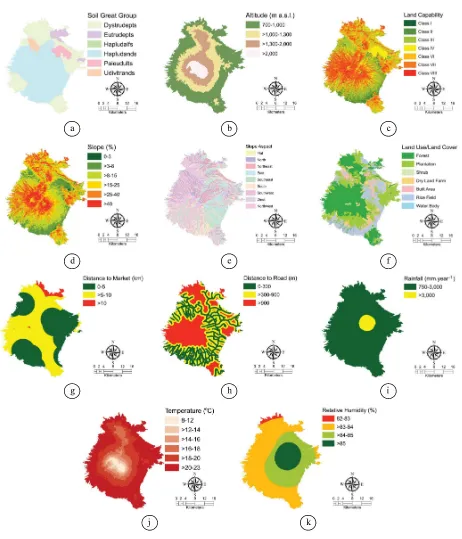
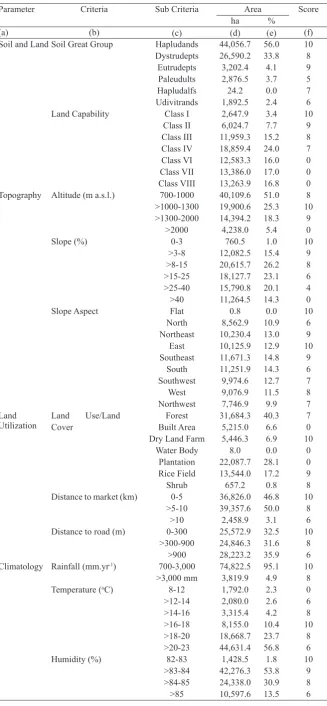
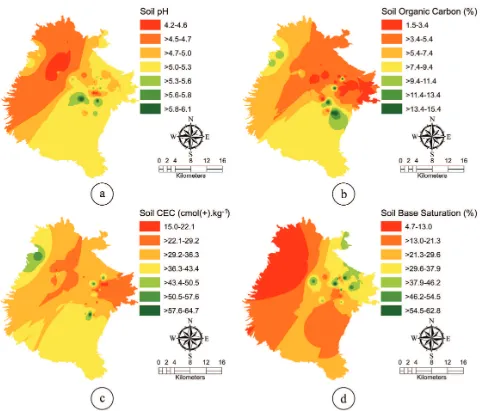
The spatial distribution of criteria and scores of the sub-criteria: The spatial distribution of criteria and sub-criteria are presented in Table 2 and Fig. 4. In Table 2, the scores derived from the expert consensus for each sub-criterion were also given. For the criteria of soil class, the soil occupying the largest area are the soil great group of Hapludands followed by Dystrudepts, occupying 56.0% and 33.8% of the research area, respectively. Other soils are of relatively limited extent, each with an area of less than 5%. For scoring purposes, in addition to the soil classiication and soil characteristics obtained from the information from classiication, consideration of the chemical characteristics of the soil were also used. Vegetables crops generally require high soil requirements and so, the initial capital of good soil properties is crucial (Sharma et al., 2014). The summary of soil properties that are used as consideration in the scoring, mapped using a geostatistical process (Widiatmaka et al., 2006) from all primary and secondary soil analysis data are presented in Fig. 5.
The highest score of 10 is given to the soil great group of Hapludands (Soil Survey Staff, 2014), which was a soil great group of the Andisols soil order. Almost all high altitude vegetables crops in Indonesia were grown in Andisols, and so most of the Andisols soil order is generally considered as suitable for high altitude vegetable crops. This fact was found in the high altitude vegetables centre on Java Island as well as on other islands such as Sumatra, Bali, Lombok, Flores and North Sulawesi (Sukarman and Dariah, 2014). The soil great group of the Hapludands is part of Andisols soil order which has an Udic soil moisture regime (Soil Survey Staff, 2014). It should be noted
Table 1. Rating for pairwise comparison according to Saaty (2008)
1/9 1/7 1/5 1/3 1 3 5 7 9
Extremely Very strongly Strongly Moderately
Equally Moderately Strongly Very strongly Extremely
Less important More important
a b
Fig. 3. Map of: (a) Forest area status designation (Ministry of Forestry, 2003, 2009); and (b) land allocation in spatial pattern of official land use plan (Government of West Java, 2010)
however, that not all members of the Andisols soil order can be considered suitable for vegetables crops. To other Andisols, which are a soil great group of Udivitrands, a lower score was given. Udivitrands is a soil great group of Andisols that are relatively less able to retain and provide water and have a hard layer at a depth of less than 60 cm (Soil Survey Staff, 2014). With these properties, the Udivitrands received a score of 6.
To the Inceptisols, high scores was also attributed: 9 for the soil great group of Eutrudepts and 8 for the soil great group of Dystrudepts. Inceptisol is a relatively young soil (from Latin,
inceptum = beginning). This soil generally has a cambic horizon (Soil Survey Staff, 2014). Because of its early development, most of the soil is quite fertile. Eutrudepts soil is more fertile than Dystrudepts because it has a higher base saturation (> 60%) (Soil Survey Staff, 2014).
A score of 7 was given to the soil great group of Hapludalfs, which was a member of the Alisols soil order. Alisols have an accumulation of clay within the sub-surface horizon (argillic horizon) and has a high base saturation of more than 35% at a depth of 180 cm from the soil surface (Soil Survey Staff, 2014).
Fig. 4. Spatial distribution of: a. soil great group; b. land capability class, c. altitude; d. slope; e. slope aspect; f. land use/land cover; g. distance to
Paleudult is a soil great group of the soil order of Ultisols (Soil Survey Staff, 2014), a soil which has an accumulation of clay in the sub-surface horizon, acidic, with a base saturation of less than 35% at a depth of 180 cm from the soil surface (Soil Survey Staff, 2014). To this soil great group, a score of 5 was given.
Regarding land capability, the land capability is primordial since the research area is a sloping mountainous area, where preserving soil from erosion is very important in order to sustain land utilization (Malley et al., 2006; Fenton, 2014). Land capability is deined as a systematic arrangement of different kinds of land according to those properties that determine the ability of the land to produce permanently (Klingebiel and Montgomery, 1961; Fenton, 2014). The land capability in the study area ranges from land capability classes of I to VIII, only land capability class V does not exist. Land class I is the best land that can be used for all types of land utilization. Land class VIII is the worst land, which can only be used for nature reserves and protected areas. In the study area, most of the land are classiied as class III to VIII with an area distribution that is almost even, whereas land of class I and II are relatively few. For reasons of conservation, cultivation is only permitted on land classes I until IV (Arsyad, 2010). Therefore in scoring, to land classes V to VIII a score of 0 are given. The land of classes I to IV were scored successively from 10 to 7.
Altitude is of course the first criterion of the topographical parameters to be considered in the cultivation of tropical high altitude vegetables crops. The consideration of altitude is closely related to temperature, and there is a relation between altitude, temperature and even rainfall (Sagredo et al., 2014). In the soil of West Java, Braak (1928) investigated that each of 100 m of increasing altitude, the soil temperature diminished by 0.6oC. In addition to temperature, altitude is also closely related to other aspects that also affect plant growth. Increasing altitude is also related to increasing cloudiness in the sky, decreasing atmospheric pressure and other environmental changes (Guerrero-Chavez et al., 2015). Altitude may also cause effects in chemical reactions inside species as has been shown in phenolic synthesis and accumulation (Guerrero-Chavez et al., 2015). In this study area, the distributions of height at an altitude of > 700 m a.s.l. are mostly in the altitude interval of 700-1,000 m a.s.l., followed by 1,000-1,300 m a.s.l. and then 1,300-2,000 m a.s.l. The region at an altitude of > 2,000 m a.s.l. has a very limited area. Because the research area has already been delineated at an altitude of >700 m a.s.l., then Table 2. Distributions of criteria and sub-criteria in the study area
Parameter Criteria Sub Criteria Area Score ha %
(a) (b) (c) (d) (e) (f)
Soil and Land Soil Great Group Hapludands 44,056.7 56.0 10 Dystrudepts 26,590.2 33.8 8
Eutrudepts 3,202.4 4.1 9
Paleudults 2,876.5 3.7 5 Hapludalfs 24.2 0.0 7 Udivitrands 1,892.5 2.4 6 Land Capability Class I 2,647.9 3.4 10
Class II 6,024.7 7.7 9 Topography Altitude (m a.s.l.) 700-1000 40,109.6 51.0 8
>1000-1300 19,900.6 25.3 10
Slope Aspect Flat 0.8 0.0 10 North 8,562.9 10.9 6 Cover Built Area 5,215.0 6.6 0
Dry Land Farm 5,446.3 6.9 10
Water Body 8.0 0.0 0 Plantation 22,087.7 28.1 0
Rice Field 13,544.0 17.2 9
Shrub 657.2 0.8 8
Distance to market (km) 0-5 36,826.0 46.8 10
>5-10 39,357.6 50.0 8
>10 2,458.9 3.1 6
Distance to road (m) 0-300 25,572.9 32.5 10
>300-900 24,846.3 31.6 8
>900 28,223.2 35.9 6
Climatology Rainfall (mm.yr-1) 700-3,000 74,822.5 95.1 10
>3,000 mm 3,819.9 4.9 8
Temperature (oC) 8-12 1,792.0 2.3 0
>12-14 2,080.0 2.6 6
>14-16 3,315.4 4.2 8
>16-18 8,155.0 10.4 10
>18-20 18,668.7 23.7 8
>20-23 44,631.4 56.8 6
Humidity (%) 82-83 1,428.5 1.8 10
>83-84 42,276.3 53.8 9
>84-85 24,338.0 30.9 8
>85 10,597.6 13.5 6
the entire region is basically suitable for tropical high altitude vegetables crops according to altitude; the distinction in altitude class is just to distinguish the level of suitability. Based on ield observations conducted in this research, high altitude vegetable crops grow optimally in the altitude range of 1,000-1,300 m a.s.l.; therefore, a score of 10 is given to this altitude range. For the altitude ranges of 1,300-2,000 m a.s.l. and 700-1,000 m a.s.l., scores of 9 and 8 were given respectively. In the altitude > 2,000 m a.s.l., cultivation was not allowed according to oficial regulations (Government of Indonesia, 2007); therefore, it was given a score of 0.
Another criterion of the topographic parameter is slope. In the study area, slopes ranging from 0-3% to > 40% exist; however, the dominant slope range is >3-40%. Generally, agriculture is recommended more in lat areas in order to minimize soil erosion, and the soil is considered to have good quality (Kumar and Jhariya, 2015). Cultivation on steep slopes is not recommended for reasons of sustainability (Malley et al., 2006). Therefore, the highest score was given to the slope range of 0-3%. The higher the slope, the lower the scores are given (Table 2). On the slopes of > 40%, cultivation is not allowed according to oficial regulations (Government of Indonesia, 2007); therefore, it was
given a score of 0.
The criterion of slope aspects indicate the face of the slope according to the compass direction, which determines also the level of suitability for agriculture. In the upper slope of this mountainous area, the relatively lat areas are very few. Most of the areas are sloping, with diverse direction aspects (Table 2). To the east facing slope, a score of 10 was given, as the morning sunlight is considered good for photosynthesis. The same score was given to the lat area, where solar radiation can be captured in a sufficiently high amount. Optimal sunlight will lead to optimal photosynthesis, which will further affect the optimum physiological aspects of plants. The research of Jaimez et al. (2008) showed a close relationship between photosynthesis and root growth. Lack of radiation will result in a reduction of quality, such as etiolation and vegetative growth at the expense of edible organs or the lack of production of tubers (Gruda, 2007).
Climatic parameters are very important in vegetables growth and handling. They affect not only the physiological processes and lead to differences in appearance of vegetable products, but they also have direct and indirect inluence on the internal quality of vegetables (Gruda, 2007). In climatic parameters,
Fig. 5. Several soil chemical properties in the research area: a. soil pH; b soil organic carbon; c. soil cation exchange capacity; and
rainfall affects plant growth. The research area is located in wet tropical climates and so, rainfall is relatively high. Thus, water scarcity is not an issue, meaning that there is no drought in these highlands. Problems would arise if the rainfall were too high, because it would cause rapid deterioration of vegetables. The spatial distribution of rainfall in the study area is dominated by rainfall of 700-3,000 mm.year-1. High scores are given to rainfall that is not too high, at an interval of 700-3,000 mm.year-1, whereas lower scores were given to rainfall of > 3,000 mm.year-1. The temperature is fundamental to the growth of high altitude vegetables crops, demonstrated by various research (Motsa et al., 2015; Naughton et al., 2015). Temperature affects chemical reactions and physical properties of plants and this inluence occurs at both the cellular level and the plant level (Gruda, 2007). High altitude vegetables crops generally need an optimum temperature: temperatures that are too cold or too hot will not be suitable for growing tropical high altitude vegetables crops. In addition to growth, temperature affects the ease of handling. For example, a temperature that is too hot will cause the vegetables to easily damage (Abousaedi et al., 2015). The storage life of commodities varies inversely with the rate of respiration, which in turn depends considerably on the temperature (Hobson, 1992). The spatial distribution of temperature in the study area ranged from 8oC to 23oC. The most extensive temperature range
is >20-23oC (Table 2). In this study, a high score is given to a
temperature range of >16-18oC. Lower scores are given to the
temperatures below 16oC and above 18oC. Similarly, relative humidity also affects both the physiological aspects and growth of plants as well as the post-harvest handling. In this region, the entire region is essentially considered to have high humidity; thus, the highest score was given to the area with the lowest relative humidity range.
In the study area, the predominant land use/land cover is forest, which covers 40.3% of the area, followed by plantation, which covers 28.1% of the area (Table 2). Almost the entire plantation area is tea plantations. This region is famous for its tea plantations, which have been cultivated since the Dutch colonial era (Etherington, 1974). The land use of rice ields also covers an extensive area. The high altitude vegetable crops are actually cultivated on dry land, which covers 5,446.3 (6.9%); the highest score of 10 is thus given to this dry land agriculture. Moreover, the vegetable crops are also often cultivated in the rice ield area, especially in the non-irrigated rice ields where rice is alternated with vegetables. Thus, to the rice ields area, a high score of 9 is given. Scores were given to the forest and shrub; although they are not currently used for cultivation, but they have a potential to be used in the future. Part of the forest, which is not permitted to become a cultivated area according to FASD will be excluded in the next analysis of land availability. Land utilizations that do not allow for vegetables cultivation such as built areas, existing tea plantations and water bodies, are scored at 0.
In terms of accessibility, this area has quite good accessibility, especially at an altitude that is not too high, up to about 1,000 m a.s.l. Areas at higher altitudes are generally forest areas with limited accessibility. There are not too many markets, only in the district capital. In terms of distance to market and distance to the road, a high score was given to land close to the road or close to the market. Vegetables are perishable and lose quality and appearance shortly after harvest (Sharma et al., 2014), so
the aspects of ease of transportation become very important (Abousaeidi et al., 2015). The range of distance to the road and distance to the market used in this study are judged based on observations of ield conditions.
Results and discussion
The weight of criteria resulting from AHP are presented in Table 3. The results indicate that the value of the consistency ratio (Cr) is 0.03. This value is still below the maximum allowable Cr of 0.1. This indicates that the results are valid in accordance with the threshold recommended by Saaty (2008).
The weighting results showed that the soil criterion has the highest weight. This result indicates that soil quality is very crucial in the successful cultivation of vegetables crops (Sharma et al., 2014). The next weights are altitude, followed by land capability class and slope. The relatively high weights for land capability class and slope indicate that experts have a great concern in terms of soil conservation, since this region is indeed dominated by sloping areas. Areas at high altitude generally have hilly landforms and are even mountainous. On the other hand, cultivation of vegetable crops can be considered as intensive cultivation; thus, soil conservation efforts should be done to protect the land from degradation.
The criteria which have low weights include relative humidity, the slope aspect, the distance to road and the distance to market. In terms of relative humidity, the low weight is related to the location of the research areas in a humid tropical climate. The difference between classes in terms of relative humidity is not too high and even, the lowest scored class still belonged to the range of suitable for vegetables crops. A similar case was valid for the slope aspect: the study area is located in a tropical region where sunlight is generally not an obstacle, whatever the slope aspect. There is no great difference between the slope aspects, because in tropical areas, the sun is relatively verticale. In terms of distance from the road, since the research area is located on the upper slope of a mountain that is a touristic area, in general, accessibility is not a major problem. Usually farmers sell their vegetables with a two-wheeled vehicle to a nearby market and so, transportation is relatively lexible.
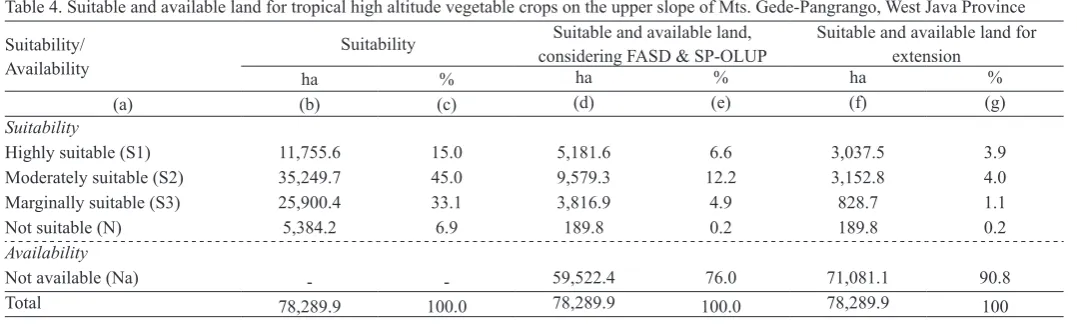
The analysis results of the land suitability for tropical high altitude vegetable crops are presented in Fig. 6. The summary of these land suitability results are presented in Table 4 (column a, b and c). Land that is not suitable for tropical high altitude vegetable crops covers an area of 5,384.2 ha, or 6.9% of the area. Land that is not suitable is mainly land situated close to the top of the mountain, causing a combination of limited physical properties that do not allow the cultivation of vegetable crops: a very high altitude at more than 2,000 m a.s.l., a steep slope of more than 40%, a low land capability (land capability class of VII or VIII) and a very low temperature. This land is actually not cultivated; its land use/land cover is forest. Of the total area of 78,289.9 ha that were analysed, the total area of 72,905.7 ha or 93.1% is suitable for high altitude vegetable crops. The land suitability classes vary from highly suitable (S1) to marginally suitable (S3); however, the dominant part is land with a land suitability class of moderately suitable (S2), which covers an area of 35,249.7 ha or 45% of the area being analysed.
Of such suitable land, the results of the land availability analysis
considering FASD maps and the map of SP-OLUP are presented in Fig. 7a and Table 4 (column d and e). In consideration of FASD, all areas included in forest areas that are not allowed for cultivation were excluded. In the same way, considering SP-OLUP, all areas designated for uses other than agriculture are also excluded. With this analysis, the area that is not available for high altitude vegetable crops covers an area of 59,522.4 ha, or 76% of the area being analysed. Most of the area that is not available coincides with areas that are allocated to become protected areas. Functionally, this protected area should be obeyed because this
region is an upstream part of a large watershed that includes the Ciliwung River. The downstream part of this watershed includes the cities of Bogor and Jakarta, the Indonesian capital. As has been known, in recent years, Jakarta experienced an annual lood. Some studies indicate that the incidence of loods in Jakarta is closely associated with the destruction of forests in the upstream watershed (Costa et al., 2015; Lin et al., 2015). In this context, planning for land utilization for agriculture should respect the existing oficial spatial land use plan. With these considerations, the total area of suitable and available land for tropical high altitude vegetable crops covers an area of 18,577.8 ha or 23.7% of the analysed area. Mostly of such area (9,579 ha or 12.2%) is moderately suitable (S2).
Of such suitable and available land, several parts are areas of land that are currently used for agriculture. This fact is based on principles used in weighting and scoring, which were applied in the land suitability analysis. In the weighting and scoring process, land use and land cover become one of the parameters considered, and land that is actually in use for agricultural dry land farming (which in fact is actually used for agriculture), was given a high score. Re-utilization of land use and land cover maps at this step -after previous use for weighting- does not mean it is redundant: in the irst analysis, land cover was used for weighting and scoring for suitability analysis, while in this second analysis, it is used to identify the potency and land availability analysis. Overlaying the suitable and available land with actual land use/land cover resulted in Table 4 (column f and g) and Fig. 7b. With this process, the land that is actually used for agriculture (paddy ield, existing
Fig. 6. Map of land suitability for tropical high altitude vegetables crops
Fig. 7. Map of suitable and available land for tropical high altitude vegetable crops: (a) taking into account FASD and SP-OLUP; (b) taking into account FASD, SP-OLUP and actual land utilization
Table 3. Weight of criteria resulting from pairwise comparison
SGG ALT LCC SL LULC TEMP RF DM DR SA RH Weight
SGG 1 2 3 3 4 5 6 7 8 9 9 0.271
ALT 1/2 1 2 2 3 4 5 6 7 8 8 0.190
LCC 1/3 1/2 1 1 2 3 4 5 6 7 7 0.130
SL 1/3 1/2 1 1 2 3 4 5 6 7 7 0.130
LULC 1/4 1/3 1/2 1/2 1 2 3 4 5 6 6 0.089
TEMP 1/5 1/4 1/3 1/3 1/2 1 2 3 4 5 5 0.062
RF 1/6 1/5 1/4 1/4 1/3 1/2 1 2 3 4 4 0.044
DM 1/7 1/6 1/5 1/5 1/4 1/3 1/2 1 2 3 3 0.031
DR 1/8 1/7 1/6 1/6 1/5 1/4 1/3 1/2 1 2 2 0.022
SA 1/9 1/8 1/7 1/7 1/6 1/5 1/4 1/3 1/2 1 1 0.016
RH 1/9 1/8 1/7 1/7 1/6 1/5 1/4 1/3 1/2 1 1 0.016
Note: SGG: soil great group; ALT: altitude; LCC: land capability class; SL: slope; ; LULC: land use and land cover; TEMP: temperature; RF: rainfall;
DM: distance to market; DR: distance to road; SA: slope aspect; RH: relative humidity
Max eigenvalue (γmax) = 11.4551121 n = 11
Consistency index (Ci) = (γmax - n)/(n - 1) = 0.04551121 Random index (Ri) = 1.49
Consistency ratio (Cr) = Ci/Ri = 0.030544436
vegetable crops, etc.) was excluded. The result is suitable and available land, which is currently not used and available for further use for vegetable crops. Results of this analysis step is presented in Table 4 (column g). The area covers 7,019 ha, or 9% of the area analysed, and its suitability spread from S1, S2 and S3. Results of this analysis can be interpreted as the maximum potential expansion land for high altitude vegetable crops in this region. In real terms, this potency constitute the land that is actually covered by shrub and forest but is located in the FASD status of AOU and is not prohibited to be used for cultivation.
The results of the overall analysis can be used to prioritize the development of tropical high altitude vegetable crops in the study area. Information about different classes of land suitability can be used as considerations for land use planning. A more detailed analysis for more speciic vegetable commodities still requires more data, for example in terms of soil chemical analysis. In the concept of land evaluation, speciic commodities require speciic land characteristics as well. Nonetheless, this analysis using common characteristics is very necessary as has been insisted by Gary et al. (1998). The analysis would be included as part of the database for horticultural land use planning (Rao et al., 2014).
Acknowledgements
We thank the Indonesian Geospatial Information Agency for the inancial support for this research during the iscal year of 2014. The SPOT-6 imagery was provided by the Indonesian Ministry of Agriculture.
References
Abousaeidi, M., R. Fauzi and R. Muhamad, 2015. Geographic Information System (GIS) modeling approach to determine the
fastest delivery routes. Saudi J. Biol. Sci. (article in press). http://
dx.doi.org/10.1016/j.sjbs.2015.06.004.
Akınci, H., A.Y. Ozalp and B. Turgut, 2013. Agricultural land use suitability
analysis using GIS and AHP technique. Computer Electronic Agric.,
97: 71-82. http://dx.doi.org/10.1016/j.compag.2013.07.006.
Ambarwulan, W., C.M. Mannaerts, H.J. van der Woerd and Mhd. S.
Salama, 2010. Medium resolution imaging spectrometer data for
monitoring tropical coastal waters: a case study of Berau estuary,
East Kalimantan, Indonesia. Geocarto Intl., 25(7): 525-541. http:// dx.doi.org/10.1080/10106049.2010.505303.
Arsyad, S., 2010. Soil and Water Conservation. IPB Press. Bogor (in
Indonesian).
Bandyopadhyay, S., R.K. Jaiswal, V.S. Hegde and V. Jayaraman, 2009.
Assessment of land suitability potentials for agriculture using a remote sensing and GIS based approach. Intl. J. Remote Sensing,
30(4): 879-895. http://dx.doi.org/10.1080/01431160802395235.
Braak, C., 1928. The climate of the Netherlands Indies. Proc. Royal Mgt. Meteorol. Observation Batavia, 8: 272.
Brockhaus, M., K. Obidzinski, A. Dermawan, Y. Laumonier and C. Luttrell, 2012. An overview of forest and land allocation policies
in Indonesia: Is the current framework sufficient to meet the
needs of REDD+. For. Policy and Econ., 18: 30-37. http://dx.doi.
org/10.1016/j.forpol.2011.09.004.
Bunruamkaew, K. and Y. Murayama, 2011. Site suitability evaluation for
ecotourism using GIS & AHP: a case study of Surat Thani Province, Thailand. Procedia Soc. and Behaviour Sci., 21: 269-278. http:// dx.doi.org/10.1016/j.sbspro.2011.07.024.
Cengiz, T. and C. Akbulak, 2009. Application of analytical hierarchy process and geographic information systems in land-use suitability
evaluation: a case study of Dümrek village (Çanakkale, Turkey). Intl. J. Sustainable Dev. World Ecol., 16(4): 286-294. http://dx.doi. org/10.1080/13504500903106634.
Chen, H., G. Liu, Y. Yang, X. Ye and Z. Shi, 2010. Comprehensive
evaluation of tobacco ecological suitability of Henan Province based on GIS. Agric. Sci. in China, 9(4): 583-592.
Costa, D., P. Burlando and C. Priadi, 2015. The importance of integrated solutions to looding and water quality problems in the tropical
megacity of Jakarta. Sustainable Cities and Soc. (article in press), http://dx.doi.org/10.1016/j.scs.2015.09.009.
Crecente, J.M., I. Santé, C. Díaz and R. Crecente, 2012. A multicriteria approach to support the location of thalassotherapy (seawater therapy) resorts: Application to Galicia region, NW Spain. Landsc. and Urban Planning, 104: 135-147. http://dx.doi.org/10.1016/j. landurbplan.2011.10.010.
Directorate General of Horticulture, 2010. Strategic Plan of Directorate Generale of Horticulture 2010-2014. Directorate General of Horticulture, Indonesian Ministry of Agriculture. <http://www.
pertanian.go.id/sakip/admin/file/RENSTRA-HOR.pdf> (in Indonesian).
Dragicevic, S., T. Lai and S. Balram, 2015. GIS-based multicriteria
evaluation with multiscale analysis to characterize urban landslide
susceptibility in data-scarce environments. Habitat Intl, 45: 114-125.
Efendi, A.C., Kusnama and B. Hermanto, 1998. Geologic Map of Bogor,
Scale 1: 100,000. Puslitbanggeo. Bandung (in Indonesian). Etherington, D.M., 1974. The Indonesian Tea Industry. Bul. Indonesian
Econ. Studies, 10(2): 83-113. http://dx.doi.org/10.1080/00074917 412331332489.
Feizizadeh, B., M.S. Roodposht, P. Jankowski and T. Blaschke, 2014.
A GIS-based extended fuzzy multi-criteria evaluation for landslide susceptibility mapping. Computer and Geoscience, 73: 208-221. http://dx.doi.org/10.1016/j.cageo.2014.08.001.
Fenton, T.E., 2014. Land Capability Classiication. In: Encyclopedia of Natural Resources: Land. Taylor and Francis: New York, Published online (21 Oct 2014): 299-301. http://dx.doi.org/10.1081/E-ENRL-120049143.
Finn, J.A., F. Bartolini, D. Bourke, I. Kurz and D. Viaggi, 2009.
Ex-post environmental evaluation of agri-environment schemes using expert’s judgements and multicriteria analysis. J. Environ. Planning Mgt, 52(5): 717-737.
Table 4. Suitable and available land for tropical high altitude vegetable crops on the upper slope of Mts. Gede-Pangrango, West Java Province
Suitability/ Availability
Suitability Suitable and available land,
considering FASD & SP-OLUP
Suitable and available land for extension
ha % ha % ha %
(a) (b) (c) (d) (e) (f) (g)
Suitability
Highly suitable (S1) 11,755.6 15.0 5,181.6 6.6 3,037.5 3.9
Moderately suitable (S2) 35,249.7 45.0 9,579.3 12.2 3,152.8 4.0
Marginally suitable (S3) 25,900.4 33.1 3,816.9 4.9 828.7 1.1
Not suitable (N) 5,384.2 6.9 189.8 0.2 189.8 0.2
Availability
Not available (Na) - - 59,522.4 76.0 71,081.1 90.8
Total 78,289.9 100.0 78,289.9 100.0 78,289.9 100
Food and Agriculture Organization (FAO), 1976. A framework for
land evaluation. Soils Bul., 32. Organization of the United Nations, Rome, Italy.
Food and Agriculture Organization (FAO), 1996. Guidelines for
Land-use Planning. Food and Agriculture Organization of the United
Nations, Rome, Italy.
Foshtomi, M.D., M. Norouzi, M. Rezaei, M. Akef and A. Akbarzadeh, 2011. Qualitative and economic land suitability evaluation for Tea in
sloping area of Guilan, Iran. J. Biol. Environ. Sci., 5(15): 135-146. Francis, C., G. Lieblein, S. Gliessman , T.A. Breland, N. Creamer, R.
Harwood, L. Salomonsson, J. Helenius, D. Rickerl, R. Salvador,
M. Wiedenhoeft, S. Simmons, P. Allen, M. Altieri, C. Flora and
R. Poincelot, 2003. Agroecology: the ecology of food systems.
J. Sustainable Agric., 22(3): 99-118. http://dx.doi.org/10.1300/ J064v22n03_10.
Gary, C., J.W. Jones and M. Tchamitchian, 1998. Crop modelling in
horticulture: state of the art. Sci. Hort., 74: 3-20. http://dx.doi. org/10.1016/S0304-4238(98)00080-6.
Government of Indonesia, 2007. Law No. 26/2007 on Spatial Planning (in Indonesian).
Government of West Java, 2010. Regional Regulation for Oficial
Regional Spatial Planning of West Java. Government of West Java,
Republic of Indonesia (in Indonesian).
Gruda, N., 2007. Impact of environmental factors on product quality of greenhouse vegetables for fresh consumption. Critical Rev. Plant Sci., 24(3): 227-247. http://dx.doi.org/10.1080/07352680591008628. Guerrero-Chavez, G., M. Scampicchio and C. Andreotti, 2015.
Inluence of the site altitude on strawberry phenolic composition
and quality. Sci. Hort., 192: 21-28. http://dx.doi.org/10.1016/j. scienta.2015.05.017.
Hobson, G., 1992. Slowing the detrerioration of fruits and vegetables
after harvest. J. Biol. Educ., 26(2): 100-106.
Indonesian Center for Agricultural Land Resources Research and
Development (ICALRRD), 2011. Soil Map of West Java and Banten.
Indonesian Agency for Agricultural Research and Development,
Ministry of Agriculture (in Indonesian).
International Society for Horticultural Science (ISHS), 2012. Harvesting the sun: a proile of world horticulture. Scripta Hort., 14.
Jaimez, R.E., N. Santos, B. An˜ez, J. Va´squez and W. Espinoza, 2008.
Photosynthesis of ield-grown Arracacha (Arracacia xanthorriza
Bancroft) cultivars in relation to root-yield. Sci. Hort., 118: 100-105. http://dx.doi.org/10.1016/j.scienta.2008.05.027.
Klingebiel, A.A. and P.H. Montgomery, 1961. Land Capability Classiication. In: Agricultural Handbook 210, U.S. Department of Agricultural Soil Conservation Service, Washington, DC.
Komarovska, A., L. Ustinovichius, G. Shevchenko and L. Nazarko, 2015.
Multicriteria evaluation of commercial industrial zone development.
Intl. J. Strategy Property Mgt., 19(1): 84-95. http://dx.doi.org/10.38 46/1648715X.2015.1027321.
Kumar, T. and D.C. Jhariya, 2015. Land quality index assessment for agricultural purpose using multi-criteria decision analysis (MCDA). Geocarto Intl. (article in press). http://dx.doi.org/10.1080/1010604 9.2014.997304.
Li, B., F. Zhang, L.W. Zhang, J.F. Huang, Z.F. Jin and D.K. Gupta, 2012.
Comprehensive suitability evaluation of tea crops using GIS and a
modiied land ecological suitability evaluation model. Pedosphere,
22(1): 122-130. http://dx.doi.org/10.1016/S1002-0160(11)60198-7. Lin, E., K. Shaad and C. Girot, 2015. Developing river rehabilitation
scenarios by integrating landscape and hydrodynamic modelling for the Ciliwung River in Jakarta, Indonesia. Sustainable Cities and Soc. (article in press). http://dx.doi.org/10.1016/j.scs.2015.09.011. Lin, Y.C., S.L. Huang and W.W. Budd, 2013. Assessing the environmental
impacts of high-altitude agriculture in Taiwan: a
driver-pressure-state-impact-response (DPSIR) framework and spatial emergy
synthesis. Ecol. Indicators, 32: 42-50. http://dx.doi.org/10.1016/j. ecolind.2013.03.009.
Malczewski, J., 2004. GIS-based land-use suitability analysis: a critical
overview. Programe Planning, 62: 3-65. http://dx.doi.org/10.1016/j.
progress.2003.09.002.
Malczewski, J., 2006. GIS-based multicriteria decision analysis: a survey of literature. Intl. J. Geogr. Info. Sci., 20(7): 703-726. http://dx.doi. org/10.1080/13658810600661508.
Malley, Z.J.U., J.M.R Semoka, J.A. Kamasho and C.V. Kabungo,
2006. Participatory assessment of soil degradation in the uplands of southwestern Tanzania: Implications for sustainable agriculture and rural livelihoods. Intl. J. Sustainable Dev. World Ecol., 13(3): 183-197. http://dx.doi.org/10.1080/13504500609469671.
Mendas, A. and A. Delali, 2012. Integration of multi-criteria decision
analysis in GIS to develop land suitability for agriculture: Application to durum wheat cultivation in the region of Mleta in Algeria.
Computer Electronic Agric., 83: 117-126.
Midmore, D.J. and D.D. Poudel, 1996. Asian vegetable production
systems for the future. Agric. System, 50: 51-64. http://dx.doi. org/10.1016/0308-521X(95)00003-N.
Mighty, M.A., 2015. Site suitability and the analytic hierarchy process:
How GIS analysis can improve the competitive advantage of the Jamaican coffee industry. Appl. Geography, 58: 84-93. http://dx.doi. org/10.1016/j.apgeog.2015.01.010.
Ministry of Agriculture, 2006. Regulation of Minister of Agriculture No. 47/Permentan/OT.140/10/2006 on General Guidance for Agriculture in Mountaineous Area. Ministry of Agriculture. Jakarta
(in Indonesian).
Ministry of Agriculture, 2014. Agricultural Statistics 2014. Indonesian Ministry of Agriculture. Jakarta.
Ministry of Forestry, 2003. Decree of Minister of Forestry No. 195/
Kpts-II/2003 on Forest Area Designation in West Java Province, of + 816.603 ha (in Indonesian).
Ministry of Forestry, 2009. Regulation of Minister of Forestry of the
Republic of Indonesia No.: P.50/Menhut-II/2009. Ministry of
Forestry, Jakarta.
Motsa, M.M., M.M. Slabbert, W. van Averbeke and L.Morey, 2015. Effect of light and temperature on seed germination of selected
African leafy vegetables. South Africa J. Bot., 99: 29-35. http:// dx.doi.org/10.1016/j.sajb.2015.03.185.
Naughton, C.C., P.N. Lovett and J.R. Mihelcic, 2015. Land suitability modeling of shea (Vitellaria paradoxa) distribution across
sub-Saharan Africa. Appl. Geography, 58: 217-227. http://dx.doi. org/10.1016/j.apgeog.2015.02.007.
Nerini, F.F., M. Howells, M. Bazilian and M.F. Gomez, 2014. Rural electriication options in the Brazilian Amazon A multi-criteria
analysis. Energy Sustainable Dev., 20: 36-48.
Nguyen, T.T., A. Verdoodt, V.Y. Tran, N. Delbecque, T.C. Tran and E. Van Ranst, 2015. Design of a GIS and multi-criteria based land evaluation
procedure for sustainable land-use planning at the regional level. Agric. Ecosystem Environ. 200: 1-11. http://dx.doi.org/10.1016/j. agee.2014.10.015.
Nyeko, M., 2012. GIS and multi-criteria decision analysis for land use
resource planning. J. Geography Info. System, 4: 341-348. http:// dx.doi.org/10.4236/jgis.2012.44039.
Pilehforooshha, P., M. Karimi and M. Taleai, 2014. A GIS-based
agricultural land-use allocation model coupling increase and decrease in land demand. Agric. System, 130: 116-125. http://dx.doi. org/10.1016/j.agsy.2014.07.001.
Qin, T., X. Gu, Z. Tian and J. Deng, 2015. Comparison of Agriculture and Forestry Fiscal Subsidy Policies in China. J. Sustainable For.,
34(8): 683-697. http://dx.doi.org/10.1080/10549811.2015.1025286. Qiu, Q., J. Liu, Y. Ren and J. Zhao. 2010. Towards a sustainable
Rahman, Md.R. and S.K. Saha, 2008. Remote sensing, spatial multi criteria evaluation (SMCE) and analytical hierarchy process (AHP) in optimal cropping pattern planning for a lood prone area. J. Spatial Science, 53(2): 161-177. http://dx.doi.org/10.1080/144985 96.2008.9635156.
Raju, K.S., 2009. Multicriterion decision making: a brief overview. ISH J. Hydrology Eng., 15(supl): 129-150. http://dx.doi.org/10.1080/09 715010.2009.10514972.
Rao, P.V.K., K.V. Ramana and M.V.R. Seshasai, 2014. Identiication
of potential areas for horticulture expansion using remote sensing and GIS techniques: Research & reviews. J. Space Sci. Technol.,
3(1): 1-8.
Roetter, R.P., C.T., Hoanh, A.G. Laborte, H. Van Keulen, M.K. Van
Ittersum, C. Dreiser, C.A. Van Diepen, N. De Ridder and H.H.
Van Laar, 2005. Integration of systems network (SysNet) tools for
regional land use scenario analysis in Asia. Environ. Model Software,
20(3): 291-307. http://dx.doi.org/10.1016/j.envsoft.2004.01.001.
Saaty, T.L., 2008. Decision making with the analytic hierarchy process. Int. J. Service Sci., I(1): 83-98. http://dx.doi.org/10.1504/ IJSSCI.2008.017590.
Sagredo, E.A., S. Rupper and T.V. Lowell, 2014. Sensitivities of the
equilibrium line altitude to temperature and precipitation changes along the Andes. Quaternary Res., 81: 355-366. http://dx.doi. org/10.1016/j.yqres.2014.01.008.
Saida, S. Sabiham, Widiatmaka and S.H. Sutjahjo, 2010. Sustainability
analysis of fruits farming in sloping area of upper Janaberang watershed, South Sulawesi. J. Bertani, 7(2): 162-177 (in Indonesian). Saida, S. Sabiham, Widiatmaka and S.H. Sutjahjo, 2011. Sustainability
analysis of vegetables farming in sloping area of upper Janaberang watershed, South Sulawesi. J. Matematika, Sains & Teknol. 12(2): 101-112 (in Indonesian).
Sarkar, A., A. Ghosh and P. Banik, 2014. Multi-criteria land evaluation
for suitability analysis of wheat: a case study of a watershed in eastern plateau region, India. Geosp. Inform. Sci., 17(2): 119-128. http://dx.doi.org/10.1080/10095020.2013.774106.
Schwilch, G., B. Bestelmeyer, S. Bunning, W. Critchley, J. Herrick, K. Kellner, H.P. Liniger, F. Nachtergaele, C.J. Ritsema, B. Schuster, R. Tabo, L.G. Van and M. Winslow, 2011. Experiences in monitoring
and assessment of sustainable land management. Land Degrad. Dev.,
22: 214-225. http://dx.doi.org/10.1002/ldr.1040.
Shannon, M.C. and C.M. Grieve, 1999. Tolerance of vegetable crops
to salinity. Sci. Hort., 78: 5-38. http://dx.doi.org/10.1016/S0304-4238(98)00189-7.
Sharma, R.P., R.S. Singh, S.K. Singh, P.S. Naik and B. Singh, 2014.
Health of soil supporting vegetable cultivation in peri-urban areas.
Intl. J. Veg. Sci., (article in press). http://dx.doi.org/10.1080/19315 260.2014.923549.
Singh, S., D.R. Singh, S. Chand, A. Birah and S. Dam Roy, 2015. Analysis of perspectives of self-suficiency in vegetable production under
tropical conditions. Intl J. Veg. Sci., 21: 53-68. http://dx.doi.org/10 .1080/19315260.2013.823585.
Soil Survey Staff, 2014. Keys to Soil Taxonomy. Natural Resources
Conservation Service, United States Department of Agriculture.
Statistics Bogor Regency, 2014. Bogor Regency in Figures 2013.
Statistical Agency of Bogor Regency (in Indonesian).
Statistics Indonesia, 2014. Area, Productivity, Production Food Crops
All Provinces. Indonesian Agency for Statistics. <http://www.bps.
go.id/.> (in Indonesian).
Statistics Indonesia, 2015. Statistics of Indonesia. Indonesian Agency for Statistics.
Subiksa, I.G.M., Sukarman and A. Dariah, 2012. Prioritizing dryland
utilization for food crop development. Indonesian Center for Agricultural Land Resources Research and Development, Ministry of Agriculture. Jakarta.
Sudjatmiko, 1972. Geological Map of Cianjur, Scale 1:100,000.
Puslitbanggeo. Bandung (in Indonesian).
Sukarman and A. Dariah, 2014. Andosol in Indonesia: characteristics,
potency, weakness and its management for agriculture. Indonesian Center for Agricultural Land Resources Research and Development,
Ministry of Agriculture. 144 p. (in Indonesian).
Syartinilia and S. Tsuyuki, 2008. GIS-based modeling of Javan
Hawk-Eagle distribution using logistic and autologistic regression models. Biol. Conservation, 141: 756-769.
Valente, R.O.A. and C.A. Vettorazzi, 2008. Deinition of priority areas
for forest conservation through the ordered weighted averaging method. For. Ecol. Mgt., 256: 1408-1417. http://dx.doi.org/10.1016/j.
foreco.2008.07.006.
Verburg, P.H., T.A. Veldkamp and J. Bouma, 1999. Land use change
under conditions of high population pressure: the case of Java.
Global Environ. Change, 9: 303-312. http://dx.doi.org/10.1016/ S0959-3780(99)00175-2.
Weinberger, K. and T.A. Lumpkin, 2005. Horticulture for poverty
alleviation-the unfunded revolution. Shanhua, Taiwan: AVRDC - The
World Vegetable Center, AVRDC Publication No. 05-613, Working Paper No. 15. 20 pp.
Weinberger, K. and T.A. Lumpkin, 2007. Diversiication into horticulture
and poverty reduction: a research agenda. World Dev., 35(8): 1464-1480. http://dx.doi.org/10.1016/j.worlddev.2007.05.002.
Widiatmaka, A. Sutandi, I. Anas, U. Daras, M. Hikmat and A. Krisnohadi, 2014. Establishing land suitability criteria for cashew (Anacardium occidentale L.) in Indonesia. Appl. and Environ. Soil Sci., 2014: 1-14. http://dx.doi.org/10.1155/2014/743194.
Widiatmaka, K. Munibah, S.R.P. Sitorus, W. Ambarwulan and I. Firmansyah, 2015b. Multidimensional scalling appraisal of paddy
ield sustainability in Karawang, West Java. J. Kawistara, 5(2):
113-131 (In Indonesian).
Widiatmaka, M. Ardiansyah and W. Ambarwulan, 2006. Dynamic Model of Spatial Distribution of Soil Organic Carbon in the Area with High Intensity of Land Use Change: Case Study of Bogor-Puncak, West
Java. Research Report. Directorate General of Higher Education,
Indonesian Ministry of National Education (in Indonesian).
Widiatmaka, M. Ardiansyah and W. Ambarwulan, 2007. Spatial Distribution of Soil Organic Carbon in Puncak, West Java. Research
Report. OGFICE Foundation.
Widiatmaka, M. Ardiansyah and W. Ambarwulan, 2012. Change in soil
organic carbon in the context of land use change during 2 decades: case study of Bogor Regency, West Java. Globe, 14(2): 170-177. Widiatmaka, W. Ambarwulan, A. Sutandi, K. Murtilaksono, K. Munibah
and U. Daras, 2015a. Suitable and available land for cashew (Anacardium occidentale L.) in the island of Lombok, Indonesia. J. Appl. Hort., 17(2): 129-139.
World Commission on Environment and Development, 1987. Our
Common Future. Oxford University Press. New York.
Wulandari, W.S., D. Darusman, C. Kusmana and Widiatmaka, 2014. Land suitability analysis of biodiesel crop Kemiri Sunan (Reutealis trisperma (Blanco) Airy Shaw) in the Province of West Java,
Indonesia. J. Environ. Earth Sci., 4(21): 27-37.
Zhang, J., M. Fu, Z. Zhang, J. Tao and W. Fu, 2014. A trade-off approach
of optimal land allocation between socio-economic development and ecological stability. Ecol. Model., 272: 175-187. http://dx.doi. org/10.1016/j.ecolmodel.2013.10.008.
Zhang, J., Y.Su, J.Wua and H. Liang. 2015. GIS based land suitability
assessment for tobacco production using AHP and fuzzy set in Shandong province of China. Computer Electronic Agric., 114: 202-211. http://dx.doi.org/10.1016/j.compag.2015.04.004.
Zolekar, R.B. and V.S. Bhagat, 2015. Multi-criteria land suitability
analysis for agriculture in hilly zone: remote sensing and GIS approach. Computers Electronics Agric., 118: 300-321. http://dx.doi. org/10.1016/j.compag.2015.09.016.
Submitted: December, 2015; Revised: March, 2016; Accepted: March, 2016