Economic Crisis, Small Farmer Well-Being, and Forest Cover Change in
Indonesia
William D. Sunderlin; Arild Angelsen; Daju Pradnja Resosudarmo and Ahmad Dermawan; Edy Rianto
Center for International Forestry Research (CIFOR), Bogor, Indonesia; Agricultural University of Norway, Ås, Norway, and Center for International Forestry Research (CIFOR), Bogor,
Indonesia; Center for International Forestry Research (CIFOR), Bogor, Indonesia; Bogor Agricultural Institute, Bogor, Indonesia
Accepted 20 November 2000
Abstract
Field research was conducted on 1,050 Indonesian households to understand the effects of the Asian economic crisis on the well-being of small farmers outside of Java and on their forest-clearing practices. The main findings are: (a) most farmers perceived themselves as worse off during the crisis than before, challenging the claim that farmers with export income would be better off and (b) forest clearing by farmers increased significantly during the crisis to expand rubber holdings and other tree crops, with the aim of increasing future income security. Among the policy lessons are that crop diversification and targeted aid can minimize impoverishment and avert increased forest clearing following macroeconomic destabilization.
1. Introduction
In mid-1997, an unprecedented Asia-wide economic crisis began when regional currencies lost value against the US dollar. Among all the Asian countries affected, none fared worse than Indonesia. As explained by the World Bank (1998, p. 1), ―No country in recent history, let alone one the size of Indonesia, has ever suffered such a dramatic reversal of fortune.‖ During 1967– 97, Indonesia experienced average annual economic growth of 6.5%; in 1998, the economy contracted 13.6%. Associated with this vertiginous decline, the rupiah (Rp.) decreased in value against the US$ from Rp. 2400 in July 1997 to an average of Rp. 8300 in the period September 1997–September 1999. (The rupiah briefly peaked at around Rp. 16,000–17,000 to the dollar in January and again in July 1998, and was in the range of Rp. 8000 through the end of 1999.) Among the consequences of the economic crisis have been an increase in the aggregate rate of poverty from 11% in 1996 to 14–20% in 1998 ( Poppele, Sumarto, & Pritchett, 1999, p. 14), increasing unemployment, rampant inflation and loss of consumer purchasing power, grave social instability, and the collapse of the 32-year tenure of Suharto as president in May 1998. There were emerging signs of economic recovery in the latter half of 1999. It is projected that GDP growth will have been 0.8% in 1999 ( EIU, 1999, p. 11).
This article poses two questions: (a) What are the effects of Indonesia's economic crisis on the well-being of small farmers in or nearby natural forest areas? and (b) What are the effects of the crisis on these small farmers' agricultural practices and how does this in turn affect natural forest cover?
The article is structured as follows. Section 2 explains the theory and hypotheses guiding the research. Section 3 describes the methodology employed. The research findings are presented in Section 4. Section 5 summarizes the findings and proposes policy lessons to be drawn from the findings.
2. Theory and hypotheses
At the level of economic theory, the crisis could have either positive or negative effects on the well-being of forest villagers. During the crisis there were widely diverging opportunities introduced by the drastic depreciation of the Indonesian rupiah against the US dollar. On one hand, producers of agro-export commodities could get an income windfall from higher market prices; on the other hand, increased costs of living and input costs could neutralize nominal income gains. The well-being outcome depends greatly on the net balance of changed income and expense.
It is just as important to recognize that, during the crisis, not all crops were capable of producing windfall gains. Figure 1 shows the wide disparity of price changes of various agricultural commodities against an index of farmers' costs between January 1997 and September 1999.3 At one extreme is the case of pepper, whose price soared to four times the farmers' cost index between March and July 1998, before descending and staying level at approximately two times the index through September 1999. At the other extreme, the price of rubber rose only slightly above the index between January and September 1998, and then dropped below the index through September 1999, reflecting a downward trend in global rubber prices. Most of the other export commodities fall between these two extremes. The well-being of farmers would logically be greatly determined by which among these various crops (and others not shown in Figure 1) they produced.
Figure 1. Commodity price index in terms of index of farmer costs, January 1997–September 1999.
These widely differing opportunities and constraints translate into diverging land-clearing incentives. On one hand farmers, experiencing a large windfall might have not only the incentive (high-commodity prices), but also the means (increased capital for inputs and labor) to clear more land for agriculture. Conversely, those experiencing no windfall and dramatically increased costs of living may lack the means to clear land and to expand production, though they may have the incentive to do so (i.e., subsistence needs make them compensate for lost income through expanded production).
and climatic conditions. With the collapse of Suharto's rule many repressive aspects of his regime receded. One consequence was that restrictions on access to protected forest areas were relaxed. Some clearing of forest land might, therefore, be motivated not just by increased agricultural prices, but also by the desire to lay claim to newly-available land. The El Niño Southern Oscillation (ENSO) phenomenon between mid-1997 and mid-1998 (essentially the first year of the economic crisis) led to massive droughts and fires in various parts of Indonesia that affected agricultural incomes and land management incentives.
Against this theoretical background we tested three hypotheses, two with respect to the well-being outcome and one with respect to the forest clearing outcome:
(a) Most forest villagers would be worse off during the crisis than before in spite of having access to export income. This hypothesis emerged from observations made during preparatory visits to the research sites (see Angelsen & Resosudarmo, 1999). People interviewed during those visits said increased costs of living and of agricultural inputs had exceeded increases in agricultural income.
(b) In order to compensate for lost income, some villagers would increase their reliance on forest resources. This hypothesis was based on knowing that in the midst of Cameroon's economic crisis dating from 1986, a growing number of villagers made use of nontimber forest products (Ndoye, Ruíz-Pérez, & Eyebe, 1999).
(c) Those with a high level of export commodity income (ECI) would tend to clear more land than before, whereas low ECI households—although showing a wide diversity of land-clearing responses—would on the whole clear less land than high ECI households. For lack of any prior research on this subject, this hypothesis was based largely on theory. There were numerous media reports on forest clearing related to the increased price of particular export commodities. Notable among these were articles on the clearing of coastal mangrove forests for the establishment of shrimp aquaculture, as well as articles on increased interest in the cultivation of cocoa, coffee and pepper.4
3. Methodology
In this section, we first discuss the sample frame and selection of field research sites, then proceed to a description of the research approach, and close with information on the modes of data analysis used.
(a). Sample frame and field research sites
and diversity of experience with respect to the 1997–98 drought and fires (relatively light in Riau/Jambi and heavy in East Kalimantan and Lampung). We believe the sample data give a fairly representative picture of the situation in forest communities, although the villages were not randomly selected within each province.
The 30 forest villages were selected deliberately rather than randomly as there was no database of forest villages to draw on. The forest villages were selected according to six criteria: (i) minimum forest cover, to avoid villages where deforestation is so far advanced that agricultural expansion would be barely noticeable with respect to forest cover change; (ii) minimum proportion of farmers engaged in regular or intermittent forest clearing practices, also to assure that there would be a measurable impact with respect to forest cover; (iii) contact with the market economy, to assure that village inhabitants would have experienced some effect (whether positive or negative) from the crisis; (iv) village size (40–200 households); (v) avoidance of extreme devastation by drought and fires and (vi) dispersion so as to reflect socioeconomic and bioregional diversity.
(b). Research approach
A quantitative household survey, conducted from June to August 1999, was administered to the head of household and the spouse. Information was gathered on: the economic activities of all household members; changes in perceived levels of living in the course of three reference periods (see specification below) and changes in agricultural practices, forest-clearing practices, and degree of reliance on forest resources in the course of the three reference periods.
The survey approach relied to a great extent on the ability of respondents to recall household information in each of three clearly-specified reference periods. In this way, household status prior to and during the crisis could be compared. These three periods are:
Period 1. 1 July 1996–30 June 1997, the one-year period directly before the onset of the economic crisis;
Period 2. 1 July 1997–30 June 1998, the first year of the economic crisis, and also the span of time in which the worst effects of the drought and forest fires occurred;
Period 3. 1 July 1998–30 June 1999, the second year of the economic crisis, and the 12-month period before the date of the household survey interview.
Much of the analysis comparing pre-crisis and crisis conditions focused on the contrast between periods 1 and 3, rather than periods 1 and 2, in order to control for the effects of the drought and fires experienced in period 2.
study village continuously over the three study periods and that were ―farmers‖ in the sense of having control over their own land use decisions (i.e., were not farm laborers).
A qualitative survey was conducted in September–October 1999 in each of the 30 study villages with 8–16 key informants. The aim was to corroborate and deepen insights gained from the quantitative household survey. A survey of migration was conducted on those households that had migrated to the study villages after the onset of the crisis.7
(c). Modes of analysis
In addition to bivariate analyses, two logistic regression analyses were performed to address the overarching research questions on well-being outcomes and forest clearing practices. The logistic regression analysis on well-being outcomes used the following binary dependent variable: (i) respondent perceives household well-being as worse in period 3 than in period 1 and (ii) respondent perceives household well-being as better in period 3 than in period 1. Note that this excludes respondents perceiving no change in household well-being. The independent variables were: ―cleared land during the crisis (yes/no);‖ ―gender of head of household;‖ ―age of head of household (years);‖ ―number of household members;‖ ―got government aid during the crisis? (yes/no);‖ ―got cash income from forest during the crisis (yes/no);‖and ―main income-producing crop is (rubber, cocoa, coffee, pepper, oil palm, wet rice, dry rice, corn) (yes/no).‖
The logistic regression analysis on forest clearing practices applied the dependent variable: cleared land during the crisis (i.e., periods 2 or 3) or did not clear land during the crisis. The independent variables were the same as in the regression analysis on well-being outcomes, with the exception that ―cleared land during the crisis (yes/no)‖ was replaced by the well-being dummy variables ―worse off in period 3 than in period 1?‖ and ―better off in period 3 than in period 1?‖.
4. Findings
Before presenting the findings concerning the two research questions, we first report on the distribution of main crops, defined as the largest cash income-producing crop in period 3 in a given household. By far the most important main crop is rubber, accounting for 276 (32%) of the 870 households for which data were available. In second and third places, respectively, are coffee (161 households, 19%) and cocoa (139 households, 16%). These three export crops are 66% of the total, and all export crop types (including these three and pepper, oil palm and cinnamon) comprise 683 households or 79% of the total.
The distribution of main crops differs greatly among the study provinces. The study households of Riau/Jambi and West Kalimantan are overwhelmingly dominated by rubber, and rubber is not found in the other three provinces. The study households of Lampung are dominated by coffee production. East Kalimantan shows a relatively equal distribution among four main export crops (cocoa, coffee, oil palm and pepper). Cocoa is the main cash crop in the Central Sulawesi study households, but various kinds of food crops are also produced.
(i). Main findings
The findings strongly support the hypothesis that most respondents would be worse off during the crisis in spite of having access to export income. The survey respondents were asked to rate the well-being of their household in period 3 as compared to period 1. Six-hundred and fifty-six respondents (63%) said they were worse off; 187 (18%) said their situation was the same; 199 (19%) said they were better off and 4 (0%) did not know (Figure 2).
Figure 2. View of respondents on their status in period 3 (1998–99) as compared to period 1 (1996–97).
The well-being outcomes were strongly related to the main crop of the households. The main crops were crossclassified with the well-being outcomes and ranked, left to right, from most to least successful (Figure 3). The most successful is pepper, with almost three-quarters of those reliant on this crop reporting improved household well-being during the crisis. Oil palm is a distant second, with about a third reporting a ―better off‖ status. The worst is chili pepper, with approximately 5% experiencing improved well-being. Note that the numbers of producers in each crop category has important implications. The fact that rubber producers fared poorly is important because it represents about a third of study households. Conversely, the good performance of coconut is relatively insignificant because the number of producers among study households is so small (20 or about 2% of the total).
Figure 3. Classification of study households according to perceived crisis experience and main income-producing crop in 1998–99.
lockstep relationship between the ranking of the crops by well-being outcome and the price movements. For example, crude palm oil ranks second in the well-being outcome and well above cocoa and coffee ( Figure 3), yet the price movements of cocoa and coffee are substantially more favorable than that of crude palm oil ( Figure 1).
How do we explain that two-thirds of the study respondents had a ―worse off‖ well-being outcome (Figure 2) in spite of having access to income from export crops? In part, as explained above, it is because certain export crops (notably rubber) had a net downward price movement ( Figure 1). Another important reason, as made clear in the qualitative interviews, is that the nominal costs of agricultural inputs and of consumption goods were rising faster than nominal income during the crisis. This finding is corroborated by quantitative data showing that the proportion of households declaring that nominal expenditure is higher in period 3 than in period 1 (93.7%) is higher than the proportion of households declaring that nominal income is higher in period 3 than in period 1 (80.2%).
It is important to note that many farmers faced two crises affecting their well-being in period 2, that is, the emerging effects of economic destabilization and also serious production declines related to the ENSO phenomenon. For some, the effect of production declines was less serious than it could have been because of increased agricultural prices. There was great variation among the study provinces. We asked households experiencing negative effects from both the economic crisis and also the drought and fires to compare the two experiences. At one extreme, 79.7% of respondents in West Kalimantan said the economic crisis was worse than the drought and fires; at the other extreme only 6.4% of respondents in East Kalimantan said the economic crisis was worse than the drought and fires.
(ii). How farmers responded to crisis
The 656 respondents (63% of total) who perceived themselves as worse off in period 3 than in period 1 were asked how they responded to the challenges posed by the crisis (see Figure 4). More than half of these respondents adjusted to the negative effects of the crisis by working harder or working longer hours. About a third adjusted by reducing household expenditures, by finding a new or additional source of income, or by increasing the area of land cultivated. About a quarter adjusted by cultivating an additional crop or crops, or by depending on and in some cases exhausting their savings. The answers are disaggregated by high and low dependence on export commodity income in period 3. The low ECI households have a higher rate of response than high ECI households in all of the response categories.
The 199 respondents (19% of the total) who perceived themselves as better off in period 3 than in period 1 were asked how they used their extra income (see Figure 5). More than half of these respondents were able to increase their savings or establish savings if they did not have savings before. Somewhat less than half were able to buy more household goods. A third were able to build a house or make housing improvements. About one sixth were able to buy land, buy higher quality food, and increase their leisure time. Disaggregation of the responses by high and low ECI households in period 3 shows that low-ECI households tend to have a higher response rate than high-ECI households. An exception is that high-ECI households have a somewhat higher tendency to increase their savings.
Figure 5. What did households perceiving themselves as better off do with their extra income?
As one would expect, the ability to save is strongly related to well-being outcomes. The 508 households that were able to save money at some point in the history of the household were asked if they were able to save more money at the time of the interview than they could during the year before the onset of the crisis. The great majority (89.5%) of those who claimed they were worse off said they were unable to save as much during the crisis. The majority (74.8%) of those who claimed they were better off said they were able to save more money during the crisis.
Similarly, there is a relationship between receipt of government aid during the crisis and well-being outcomes. In the study, government aid was defined as agricultural credit and subsidies for rice, fertilizers, or insecticide. Of these four types of aid, agricultural credit and rice subsidies were by far the most important: 75 respondents received an average of almost 900,000 rupiah in agricultural credit in period 3; 599 respondents received an average of almost 100,000 rupiah in rice subsidies in period 3. Government aid was obtained by: 70.3% of respondents perceiving themselves as worse off during the crisis; by 59.6% of those perceiving their status as unchanged and by 56.8% of those perceiving themselves as better off. Is it appropriate that those perceiving themselves as better off got government aid during the crisis? Conceivably so. It is possible that obtainment of government aid ameliorated the crisis experience for some households, allowing them to change their perceived status from ―worse off‖ to ―same‖ or even ―better off.‖
(iii). Logistic regression results
Figure 6 shows the results of the logistic regression analysis on variables predicting well-being outcomes (perceived ―worse off‖ or ―better off‖ status). In the regression equation, the independent variables correctly classify 80.03% of the applicable cases in terms of their well-being outcomes. The significant independent variables (at the 0.05 level) ranked from highest to lowest B coefficient are: ―main crop is pepper (yes/no)‖ and ―main crop is oil palm (yes/no).‖ These results are understandable given that pepper and oil palm rank first and second (respectively) in the bivariate measure of well-being outcomes (Figure 3). It is noteworthy that the following are not among the statistically significant predictors of well-being outcomes: ―Cleared land during crisis? (yes/no);‖ ―Got government aid during the crisis? (yes/no)‖ and ―Got income from forest during crisis? (yes/no).‖
Figure 6. Logistic regression analysis of well-being outcome of crisis (worse off or better off in period 3 than in period 1).
(b). Clearing of land
(i). Basic findings
A farmer intending to clear forest land has three main options: plant only swidden crops (domestic food crops) for one to two years and then leave the land to fallow; plant only sedentary (export) tree crops; or a combination of the first two options, whereby food crops are produced for one to two years and then followed by tree crops. Figure 7 shows data on the number and purposes of clearings made by those 714 respondents (68% of the total) who cleared land in the three study periods.8 There are two important results. First, the number of clearings increased moderately from period 1 to period 2, and then increased dramatically from period 2 to period 3.9 Second, the number of clearings for ―swidden cultivation only‖ declines only slightly across the periods, whereas the number of clearings for both ―swidden cultivation and sedentary agriculture‖ and for ―sedentary agriculture only‖ increases moderately from period 1 to period 2, and then dramatically from period 2 to period 3.
Disaggregated to the provincial level, these results show considerable variation. The proportions of all households clearing land during the crisis (periods 2 and 3) were: 92.9% in West Kalimantan; 76.2% in Riau/Jambi; 74.8% in East Kalimantan; 45.2% in Central Sulawesi and 30.5% in Lampung. The high rates of land clearing in West Kalimantan and Riau/Jambi are partly explained by the prevalence of rubber and the interest in clearing more land for rubber. (This issue is discussed in greater detail below.) The low rate of land clearing in Lampung is explained partly by the relative unavailability of forest land to clear in that province. The average area of land cleared per household during the crisis also shows considerable variation among study provinces: 2.35 ha in West Kalimantan; 1.60 ha in East Kalimantan; 1.48 ha in Riau/Jambi; 1.12 ha in Central Sulawesi and 0.95 ha in Lampung. The rankings (from high to low) of total land area cleared by study households during the crisis is as follows: 460 ha in West Kalimantan; 256 ha in East Kalimantan; 248 ha in Riau/Jambi; 107 ha in Central Sulawesi and 60 ha in Lampung.
(ii). Forest clearing and ECI
The hypothesis saying that farmers with a high level of ECI would tend to clear more land than those with a low level of ECI was unsupported. 64.3% (284 of 442) of high ECI households and 62.6% (341 of 545) of low ECI households cleared land during the crisis and there is no statistically significant difference between these two proportions. Of the households that cleared land during the crisis, high ECI households cleared on average 1.60 ha and low ECI households cleared on average 1.70 ha; there is no statistically significant difference between these averages.
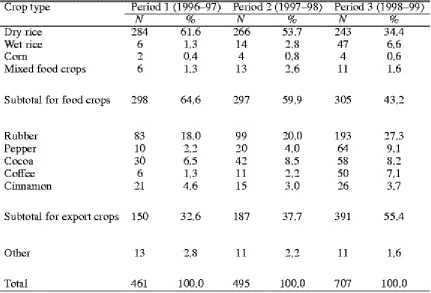
Although the high-ECI/low ECI distinction had no significant bearing on the proportion of respondents clearing land or the average area cleared, the intent of expanding the area of export crops clearly played a strong role in the expansion of land clearing during the crisis, as implied in Figure 7. Table 1, which classifies the land clearings by the primary intended crop over the lifetime of the parcel cleared, provides more specific documentation of the declining attractiveness of food crops, and the increasing attractiveness of export crops during the crisis. Observe that the proportion of clearings intended primarily for food crops declined from almost two-thirds of the total to less than half from period 1 to period 3. Observe also that the proportion of clearings intended primarily for export crops increased from about a third to more than half the total from period 1 to period 3. Note in particular the rapid growth of rubber, with clearings ultimately intended for the production of this crop (over the lifetime of the parcel) increasing from 83 in period 1 to 193 in period 3.
(iii). Logistic regression results
Figure 8 shows the results of the logistic regression analysis on variables predicting land clearing (yes/no) during the crisis. In the regression equation, the independent variables correctly classify 72.1% of the applicable cases in terms of whether or not land was cleared during the crisis. The significant independent variables (at the 0.05 level) ranked from highest to lowest B coefficient are: ―main crop is rubber? (yes/no)‖' (positive relation to land clearing); ―got cash income from forest during the crisis? (yes/no)‖ (positive); ―main crop is oil palm? (yes/no)‖ (negative); ―main crop is pepper? (yes/no)‖ (positive) and ―got government aid during the crisis? (yes/no)‖ (negative). The results require a detailed explanation as some are apparently paradoxical.
Why should land clearing for rubber be so pronounced during the crisis—in fact, the leading reason for land clearing—given that the price of this commodity declined relative to the food price index during the crisis (see Figure 1)? One important reason is that clearing land for rubber production is almost invariably preceded by establishment of food crops on the cleared parcel, and food crop production is an entirely logical aim in the midst of economic destabilization.
It remains to be known, however, why there is a pronounced increase in farmer interest in rubber as a subsequent, long-term crop (see Table 1) on the same parcel. Our conclusion is that many farmers were induced by the shock of the crisis to give greater attention to the ―safety net‖ characteristics of rubber. There are four characteristics of this commodity that make it attractive in the midst of the economic crisis. First, the costs in time and agricultural inputs for establishing and maintaining a rubber stand are low compared to other commodities. Second, latex production is limited more meaningfully by labor expenditure than by the number of tappable trees; latex output can be increased by tapping existing trees more frequently and more vigorously. 10 Third, unlike many other crops, rubber can be harvested throughout the year (with the exception of the heavy period of the rainy season), meaning that cash income can be gotten when the need arises rather than when the timing of the harvest dictates. Fourth, rubber is a nonperishable crop, meaning it has easier marketing requirements than other crops, in particular oil palm.
There are three additional factors that induced rubber expansion. First, in villages near protection forests, forest access controls had recently decreased. Second, by mid-1998, at about the time when forests were cleared for new crops, the rubber price had increased somewhat in real terms (Figure 1), and nominal farm gate prices for rubber were two to three times higher than their pre-crisis level. Third, in the lowland peneplains of Sumatra and West Kalimantan, there are few or no cash crop alternatives to rubber, so it is not surprising that farmers increased their attention to a proven source of income.11
Among the possible reasons for the positive association between land clearing and cash income from the forest are the following. First, forest income can provide the means (capital) for forest clearing. Second, most of this cash income is from timber, and timber can be harvested in the course of land clearing.
The negative association between land clearing and the production of oil palm requires explanation. If oil palm is one of the crops that best supports well-being outcomes, as is the case for pepper (Figure 3), then why did oil palm producers tend not to clear land during the crisis? We believe this can be explained by the mode of oil palm production: small oil palm producers tend not to plant independently because they rely on neighboring oil palm enterprises for capital, inputs, marketing and processing; during the crisis there was a shortage of oil palm seedlings and the costs of seedlings and fertilizer were high and during the crisis some small producers preferred rubber over oil palm because it was considered less risky.12
the short gestation period for pepper in comparison to other tree crops (nine months) makes it even more attractive. It should be noted, however, that some farmers were inhibited from establishing pepper, in spite of the high potential benefits, because of the relatively high costs of establishment in terms of both capital and labor.
The reason for the negative association between receipt of government aid and land clearing is not known. It can be surmised however, that, for some respondents, aid was received in sufficient quantity to lessen or even nullify the need to clear land for extra income. It is noteworthy that the proportion of aid recipients who cleared land during the crisis (415 of 692 = 60.0%) is significantly lower than the proportion of nonrecipients (256 of 358 = 71.5%) who cleared land. It is noteworthy as well that the average area of land cleared by 414 aid recipients (1.39 ha) is significantly lower than the average area of land cleared by 256 nonrecipients (2.11 ha).
(c). Discussion
The findings lead us to ask: why did farmers in the midst of the crisis, at a time of pressing income constraints, start making investments that would not yield for many months, if not years in the future? There are two reasons. First, income instability and short-term windfall gains drew attention to the importance of having a good stock of perennial tree crops as a safety net and cash income earner. Second, in some areas, reduced forest policing enabled increased planting of tree crops.
The findings on declining well-being, increased dependence on forest resources, and growth of land clearing for export crops during the crisis also illustrate the perils of overreliance on few income sources at the level of the household. Households whose well-being declined were those that were locked into dependence on one or few crops that provided level or decreasing nominal income in the face of drastically increased costs of living. One frequent observation made by key respondents in the qualitative interviews was that villagers wanted to diversify their crops and other income sources so that, in the face of future abrupt price changes, they could minimize their risks and maximize their gains. The research results reveal spontaneous movement in this direction. Households faced with drastic real income decline and unable to wait for additional income from agricultural production increased their dependence on nearby forest resources, which by happenstance were more available because of decreased forest policing.
Some farmers established tree crops (whether rubber or nonrubber crops) not just to generate income, but to serve as property markers that would ward off competing land claims by neighboring farmers or immigrants. This is important especially in newly-colonized forests. Although such ―land races‖ are not a new phenomenon (Angelsen, 1995), we believe the reduced forest policing following the political crisis made this even more important.
Limited income options presented dangers not only for farmer well-being but for forest cover as well. The data show substantially increased forest clearing related to sudden income instability. One might be tempted to conclude that the forest clearing changes observed are potentially positive for forest cover in the long term, rather than negative, in as much as sedentary tree crop production involves no use of fallow land and for some crops implies greater use of forest cover for shade. For two reasons, however, this might be a facile conclusion. First, we note that by and large new sedentary tree crop production is additional rather than substituting for swidden food crop production (Figure 7). Second, there is no information available showing whether this burst of forest clearing activity is temporary or long-lasting.
Comparison with the effects of economic crisis on Cameroon's tropical forest cover is instructive. Similar to Indonesia's situation, Cameroon's 1986 economic crisis led to a significant increase in forest clearing by forest villagers (Mertens et al., 2000). There is, however, an important contrast between the two events. In Indonesia, the currency depreciation tended—at least in the short run—to make export crops more valuable and food crops relatively less valuable. In Cameroon, overvaluation of the national currency (prior to a 1994 devaluation), a 50% government reduction of the producer price of cocoa and coffee, and reduction of government subsidies for these crops made export crops instantly unattractive and food crops comparatively profitable. Considerable land clearing for food crop production (mainly plantain) followed. Comparison of the Indonesian and Cameroonian experiences suggests it is not the direction of relative price changes between and food and export crops, but rather income instability, in and of itself, that leads to abrupt farming system changes and corresponding forest cover loss.
5. Summary and conclusion
Three policy lessons can be drawn from the research findings. First, policymakers should take note of the fact that farmer income diversification potentially assists both the goal of improving welfare and of minimizing natural forest conversion. With a wider variety of crops at a time of price instability, farmers can emphasize attention to those crops that optimize household income while holding others in abeyance. If income-optimizing crops are under production at the onset of price instability, this potentially alleviates the need or desire to clear land for reasons motivated by risk aversion or opportunism.
Second, policymakers should bear in mind that provision of government aid also can further welfare and resource conservation goals. The research results demonstrate that access to aid not only lessens the negative economic impact of the crisis, but also reduces the propensity to clear land, and the average amount of land cleared.
Finally, policymakers would do well to observe that sudden macroeconomic change, whether unplanned as in the case of economic crises, or planned as in the case of structural adjustment programs, can have profound effects not only on the well-being of farmers but also on their land management practices. The research results provide yet another indication that the most important causes of excessive forest cover loss originate outside of forest policy, so solutions to forest conservation and management must be sought in a multisectoral framework.
References
1. Angelsen, A., 1995. Shifting cultivation and deforestation: a study from Indonesia. World Development 23 10, pp. 1713–1729.
2. Angelsen, A., & Resosudarmo, I.A.P. (1999). Krismon, farmers and forests: the effects of the economic crisis on farmers' livelihoods and forest use in the outer islands of Indonesia. Unpublished manuscript, May 14.
3. Booth, A. (1999). The impact of the crisis on poverty and equity. In H. W. Arndt, & H. Hill (Eds.), Southeast Asia's economic crisis: origins, lessons, and the way forward (pp. 128–141). Melbourne: Allen & Unwin.
4. BPS. (1998). Nilai tukar petani Jawa Madura (1983=100) dan Sepuluh Provinsi Luar Jawa (1987=100) 1994–1997. Jakarta: Badan Pusat Statistik.
5. BPS Statistics Indonesia. (2000). Farmer terms of trade of four provinces in Jawa and ten provinces outside Jawa 1996–1999. Jakarta: BPS-Statistics Indonesia.
6. EIU. (1999). Country report: Indonesia. Third quarter, 1999. London: The Economist Intelligence Unit.
7. Evans, K., 1998. Survey of recent developments. Bulletin of Indonesian Economic Studies 34 3, pp. 5–36.
11.Mertens, B., et al. (2000). Impact of macroeconomic change on deforestation in South Cameroon: Integration of household and remotely-sensed data. World Development 28(6), 983–999.
12.Ndoye, O., Ruíz-Pérez, M., & Eyebe, A. (1999). Non-wood forests product markets and potential degradation of theforest resource in Central Africa: the role of research in providing abalance between welfare improvement and forest conservation. In T. C. Sunderland, L. E. Clark, & P. Vantomme (Eds.), Non-wood forest products of Central Africa. Current research issues and prospects for conservation and development (pp. 183–206). Rome: FAO.
13.Poppele, J., Sumarto, S., & Pritchett, L. (1999). Social impacts of the indonesian economic crisis: new data and policy implications. Jakarta: SMERU (Social Monitoring and Early Response Unit).
14.Sunderlin, W.D., & Resosudarmo, I.A.P. (1996). Rates and causes of deforestation in Indonesia: towards a resolution of the ambiguities. CIFOR Occasional Paper No. 9. Bogor, Indonesia: Center for International Forestry Research.
15.Tomich, T. P., et al. (1998). Alternatives to slash and burn in Indonesia: summary report synthesis of phase II. Bogor, Indonesia: International Centre for Research in Agroforestry, South East Asia.
16.van Noordwijk, M. et al. (1995). Alternatives to slash and burn in Indonesia: summary report of phase I. Bogor, Indonesia: International Centre for Research in Agroforestry, South East Asia.
17.World Bank. (1998). Indonesia in crisis: a macroeconomic update. Pre-publication draft, Washington, DC.
1 Data on farmers' terms of trade (FTT) are compiled by Indonesia's BPS Statistics Indonesia on the basis of monthly survey data in 14 of the country's 27 provinces. The FTT consists of an index of farmer producer prices (i.e., food crop and estate crop prices) divided by an index of farmer costs (i.e., costs of household consumption, agricultural inputs, and capital goods).
2 Fraser, 1998, pp. 143–145, for example, says that most of the estimated one million ha annual loss of forest cover in Indonesia is explained by growth in the population of small farmers living in forested areas. Although small farmers are clearly an important cause of deforestation in Indonesia, their role in forest destruction may have been overestimated ( Sunderlin & Resosudarmo, 1996).
4 For example, see: ―Shrimp ponds sweep away SE Sulawesi Mangrove Forests.‖ The
Jakarta Post. June 8, 1999, p. 7; ―Ratusan hektare hutan bakau berubah fungsi,‖ Banjarmasin Post, August 26, 1998, (online); ―Masa keemasan kakao di tengah krisis,‖ Kompas, January 17, 1998, p. 9; ―Coffee business perks up in Central Aceh,‖ Jakarta Post, February 19, 1998, p. 7; ―Lampung pepper pickers profit from Rupiah's demise,‖ The Indonesian Observer, August 4, 1998, p. 8.
5 Almost all of Indonesia's natural forests are located in Sumatra, Kalimantan, Sulawesi, and Irian Jaya, which are in the so-called outer islands outside of Java and Bali.
6 Because of their relatively small area Riau and Jambi were considered one ―province,‖ with three study villages in each of Riau and Jambi.
7 The results are not reported here because such households proved to be few and did not influence significantly the hypotheses being investigated.
8
We use the term clearing of ―land‖ rather than ―forest‖ to be inclusive and accurate. More than 90% of the land cleared, however, was primary or secondary natural forest.
9 Note that the number of clearings exceeds the number of households because some households cleared more than one parcel of land in a given period.
10 Personal communication with Meine van Noordwijk, January 10, 2000. 11 Personal communication with Meine van Noordwijk, January 10, 2000.