Summary Root systems of 6-month-old, cold-hardened, container-grown black spruce seedlings (Picea mariana (Mill.) B.S.P.) were exposed to 0, −5, −10, −15, −20, or −22.5 °C. Freezing-induced damage to fine roots, coarse roots and the whole root system was assessed by various viability tests including leakage of electrolytes, leakage of phenolic com-pounds, water loss, root and shoot water potentials, and live root dry mass. To assess the long-term effects of freezing-in-duced root damage, seedling survival and regrowth were meas-ured. Leakage of both electrolytes and phenolic compounds differed among fine roots, coarse roots, and whole root sys-tems. In coarse roots and the whole root system, but not in fine roots, leakage of electrolytes, leakage of phenolic compounds, water loss, and root and shoot water potentials were correlated with percentage of live root dry mass which, in turn, was highly correlated with seedling survival and regrowth. Compared with live root dry mass, electrolyte and phenolic leakage, water loss, and root and shoot water potentials were less well correlated with seedling survival and regrowth. Among the viability tests, electrolyte leakage of the whole root system correlated most closely with seedling survival and regrowth. Under freezing conditions that destroyed less than 50% of each seedling’s root system, about 70% of the seedlings survived and subsequent growth was little affected, whereas under freezing conditions that destroyed 70% of each seedling’s root system, only about 30% of the seedlings survived and subsequent growth was reduced compared with that of undamaged plants.
Keywords: electrolyte leakage, phenolic leakage, Picea mari-ana, water loss, water potential.
Introduction
Frost damage to root systems, which frequently occurs during production of conifer seedlings in containers or during storage of bare-root seedlings (Lindström 1986a, Simpson 1993), has a negative impact on seedling survival and regrowth (Lind-ström 1986b, Bigras and Margolis 1996). Therefore, a cheap, rapid and accurate procedure is needed to identify frost-dam-aged seedlings before they are shipped to plantation sites.
Various methods have been developed to estimate root dam-age after frost events. Rapid methods include measurements of leakage of electrolytes, leakage of ninhydrin-reactive or
phe-nolic compounds, triphenyl tetrazolium chloride reduction, sugar content, root respiration, shoot and root water potentials, water loss and resistance to electric current. Tests that require an incubation period are root growth capacity, visual examina-tion of tissue browning, and measurement of fresh mass or dry mass of undamaged roots. Although many methods have been used to estimate root damage, few attempts have been made to compare the results of the various tests with seedling survival and growth (Bigras and Calmé 1994).
The objective of this research was to identify seedling vi-ability tests that are highly correlated with seedling survival and subsequent growth. Specifically, we subjected root sys-tems of black spruce seedlings to a range of freezing tempera-tures to: (i) compare different root viability tests among different root diameter classes; (ii) evaluate the impact of frost damage on seedling survival and regrowth; and (iii) correlate the results of the viability tests with seedling survival and regrowth characteristics.
Materials and methods
Plant material
Black spruce seedlings (Picea mariana (Mill.) B.S.P.) (prove-nance 47°45′ N, 70°05′ W) were grown in unheated polyeth-ylene-covered greenhouses at a commercial forest nursery (Centre de production de plants forestiers de Québec Inc., Sainte-Anne-de-Beaupré, PQ) in a peat moss/vermiculite mix-ture (2/1, v/v). On May 20, 1992, three to four seeds were sown per cavity (110 cm3) in container trays (45 cavities) and thinned to one seedling per cavity 30 days later. Seedlings were fertilized with liquid fertilizer from June 21 until Septem-ber 13, and received a total of 6.5 mg N, 5.0 mg P, and 5.8 mg K per cavity. Seedlings were placed outside on October 14 (mean height, 6.5 cm; stem diameter, 0.98 mm; shoot dry mass, 117 mg; and root dry mass, 71 mg). On November 9, seedlings were shipped to the Laurentian Forestry Centre, Sainte-Foy, PQ (Canadian Forest Service) and placed in a greenhouse at a day/night temperature of 10/6 °C in a natural photoperiod. The seedlings were watered to saturation and no fertilizer was added.
Root cold tolerance of black spruce seedlings: viability tests in relation
to survival and regrowth
F. J. BIGRAS
Natural Resources Canada, Canadian Forest Service, Laurentian Forestry Centre, P.O. Box 3800, Sainte-Foy, Québec G1V 4C7, Canada
Received March 25, 1996
Freezing tests
Before freezing, root systems were washed under running water to completely remove substrate. The root system of each seedling was inserted in a 16-mm test tube and the tubes were immersed in a cooling bath (Model 2325, Forma Scientific Inc., Mariatta, OH) with a programmable temperature control-ler (Models 512 and 519, Powers Process Control, Oakton, IL) and exposed to temperatures of 0 (control), −5, −10, −15, −20, and −22.5 °C. Temperature was lowered at a rate of 2.5 °C h−1 and then held constant for 30 min after each 5 °C drop in temperature (2.5 °C drop, for sampling at −22.5 °C). Tempera-tures in the test tubes were recorded during the freezing tests with thermistor probes (Type 107, Campbell Scientific, Logan, UT). The cooling bath had a polystyrene cover under which the shoots were exposed to air in the dark. Air temperature in the box was about 22 °C. After freezing, tubes were kept at 2 °C until the roots thawed.
Viability tests
After thawing, viability tests were performed and percent live root dry mass was evaluated.
Experiment 1----electrolyte and phenolic leakage
The entire root systems of some seedlings were cut with a razor blade into 10-mm segments; roots of other seedlings were first divided into fine (< 0.3 mm) and coarse (≥ 0.3 mm) roots, before being cut into 10-mm segments. Between 75 and 200 mg of roots was placed in a 10-mm test tube containing 10 ml of distilled water. Test tubes were agitated for 16 h (Model 6010, Eberbach Corporation, Ann Arbor, MI) at room temperature and electrical conductivity of the water measured (Model CDM 83 Conductivity Meter, Radiometer, Copenha-gen, Denmark). To estimate phenolic compounds, 1-ml aliquots were taken from the tubes and absorbance was meas-ured at 260 nm (Spectronic 1002, Bausch and Lomb, Milton Roy Co., Rochester, NY). Tissues were killed by autoclaving the tubes at 121 °C for 30 min, after which the tubes were agitated for 1 h and then reanalyzed for electrolyte (EL) and phenolic leakage (PL). Leakage was expressed as the ratio (leakage of live tissues/leakage of dead tissues) × 100. These methods slightly overestimate leakage for a given degree of damage because solutes were dissolved in 10 ml of water before autoclaving, but only 9 ml after autoclaving.
Experiment 2----water loss, shoot and root water potential Seedlings were placed in water at room temperature for 1 h to allow saturation (Ritchie 1990). Root systems were excised 1 cm above the uppermost lateral roots, dried with a paper towel and inserted in a pressure chamber (PMS Instruments Co., Corvallis, OR). Pressure was increased to 0.15 MPa and the xylem sap expressed during the following 10 min was collected on preweighed filter paper which was then reweighed. For other seedlings, root and shoot water potentials were measured with a pressure chamber.
Percent live root dry mass
After thawing, one group of seedlings from each experiment was placed in a plastic bag in the dark at 4 °C for 15 days before
separating dead roots from live ones. Dead roots were identi-fied by brown discoloration of the cambial zone and cortex. Live and dead roots were dried separately for 24 h at 85 °C and weighed; live root dry mass was evaluated as a percentage of total root dry mass.
Regrowth characteristics
In both experiments, seven seedlings per treatment tempera-ture were held at 2 °C in the dark for 60 days to break bud dormancy. Seedlings were then repotted in individual contain-ers (4 × 13.5 cm, 115 cm3
) in a 4/1 (v/v) peat moss/vermiculite mixture and placed in a greenhouse for 6 months at 20 °C (minimum 16.5 °C; maximum 26.8 °C) in an 18-h photoperiod extended with high-pressure sodium lamps providing a photon flux of 300 µmol m−2 s−1 (PPFD) at seedling height. Seedlings were fertilized with 20,20,20 N,P,K at a concentration of 2 g l−1. After 6 months, seedling survival was evaluated. A seedling was considered dead and was discarded when all needles were yellow. Stem diameter, total live-root dry mass, and terminal- and lateral-shoot dry mass, and terminal shoot growth were measured on the remaining seedlings. Stem di-ameter was measured about 1 cm above substrate level. Root regrowth was evaluated as total live-root dry mass. Live roots were identified, separated from dead roots, dried for 24 h at 85 °C and weighed. New terminal and lateral shoots were dried and weighed. New terminal shoot length was measured to the nearest millimeter.
Experimental design, sampling, and statistical analyses
Cor-relations between transformed variables were established based on data from dead and live seedlings for the variables describing regrowth characteristics.
Results
Experiment 1----electrolyte and phenolic leakage
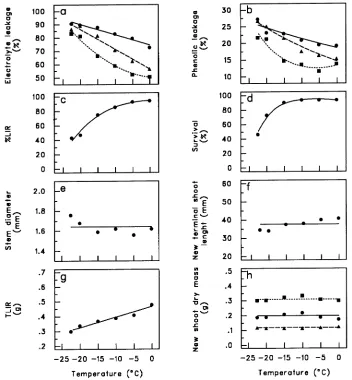
Electrolyte leakage (EL) and phenolic leakage (PL) increased with decreasing temperatures (T) in a way that differed be-tween root parts (R) (P = 0.0046 and 0.0179 for the interaction between T and R for EL and PL, respectively) (Figure 1a for EL, Figure 1b for PL and Table 1). Fine roots had the highest amount of leakage and whole root systems had the lowest amount of leakage; coarse roots showed intermediate values. Percent live root dry mass decreased quadratically with de-creasing temperatures (P = 0.0129 for T quadratic) (Figure 1c) (Table 1) with about 50% of the root system being destroyed at −20 °C.
After 6 months, more than 90% of the seedlings survived exposure of their root systems to 0 to −15 °C, but percent survival decreased to 70 and 45% for seedlings whose roots
had been exposed to temperatures of −20 and −25 °C, respec-tively (P ≤ 0.0001 for T quadratic) (Figure 1d) (Table 1). The temperature treatments had no effect on stem diameter (P = 0.3547) (Figure 1e), new terminal shoot length (P = 0.7570) (Figure 1f), lateral (P = 0.5053) (Figure 1h), terminal (P = 0.9790) (Figure 1h) or total (terminal + lateral) shoot dry mass (P = 0.4920) (Figure 1h) of the surviving seedlings (Table 1). Total live root dry mass decreased linearly with temperature (P≤ 0.0001) (Figure 1g) (Table 1).
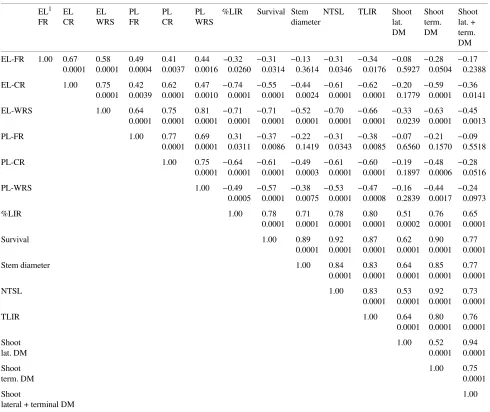
Correlations between the viability tests and seedling sur-vival and regrowth characteristics are presented in Table 2. Both electrolyte and phenolic leakage of coarse roots and whole root systems were negatively correlated with percent live root dry mass (r = −0.49 to −0.74), whereas the corre-sponding correlations were weak for fine roots (r = −0.31, −0.32). The viability tests were less strongly correlated with root regrowth (total live root dry mass, TLIR) than with percent live root dry mass (r = −0.34 to −0.66). Electrolyte leakage and phenolic leakage of coarse roots and whole root systems and percent live root dry mass were all correlated with seedling survival (r = 0.55 to 0.78) and new terminal shoot length (r = 0.53 to 0.78).
Figure 1. Relationship be-tween freezing temperatures and (a) electrolyte leakage of fine roots (d), coarse roots
(m), and whole root system
(j), 2 SE = 7.22; (b) phenolic
leakage of fine roots (d),
coarse roots (m), and whole
root system (j), 2 SE = 2.22;
(c) %LIR, percent live root dry mass, 2 SE = 0.13; (d) seedling survival, 2 SE = 2.56; (e) stem diameter, 2 SE = 0.16 to 1.36; (f ) new terminal shoot length, 2 SE = 8.18 to 9.26; (g) TLIR, total live root dry mass, 2 SE = 0.048 to 0.052; (h) dry mass of new lateral (d), 2 SE = 0.048 to 0.56,
ter-minal (m), 2 SE = 0.028 to
0.030, and total (j) shoots,
Experiment 2----water loss, shoot and root water potential
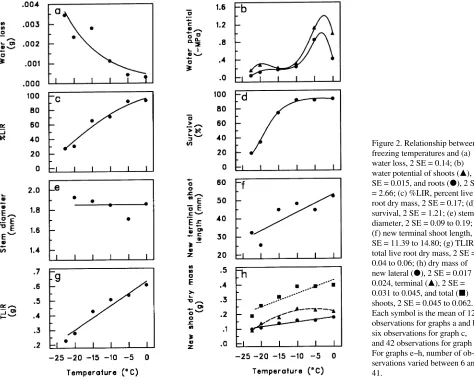
Water loss increased quadratically with decreasing tempera-tures (P = 0.0275 for T quadratic) (Figure 2a) (Table 3). More than 0.002 g of water was lost when temperatures decreased from −15 to −22.5 °C compared with 0.001 g or less in the 0 to −10 °C range. Although shoot and root water potentials at 0 °C were lower than at −5 °C and decreased rapidly from −5 to −10 °C, they remained quite stable at temperatures below −10 °C (P = 0.0113 and 0.0117 for T quartic for shoots and roots, respectively) (Figure 2b) (Table 3). Percent live root dry mass decreased quadratically with decreasing temperatures (P = 0.0155 for T quadratic) (Figure 2c) (Table 3), and about 70% of the root systems were destroyed by the −20 and −22.5 °C treatments.
After 6 months, survival was about 90% for seedlings ex-posed to temperatures ranging between 0 and −10 °C; it de-creased to 75% at −15 °C and reached 35 and 20% at −20 and −22.5 °C, respectively (P = 0.0007 for T quadratic) (Figure 2d) (Table 3). The temperature treatments had no effect on stem diameter of surviving seedlings (P = 0.6309) (Figure 2e) (Ta-ble 3). New terminal shoot length (P = 0.0452 for T linear) (Figure 2f), lateral (P = 0.0010 for T linear) (Figure 2h), terminal (P = 0.0514 for T quadratic) (Figure 2h) and total shoot dry mass (P = 0.0003 for T linear) (Figure 2h) decreased with decreasing temperature (Table 3). Total live root dry mass decreased linearly with decreasing temperature (P≤ 0.0001 for T linear) (Figure 2g) (Table 3).
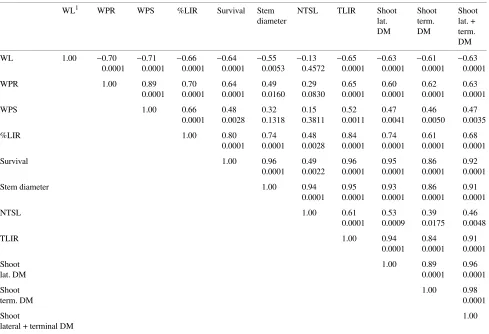
Water loss and shoot and root water potentials were corre-lated with percent live root dry mass (r = 0.66 to 0.70), and, as in Experiment 1, the correlations were lower for total root dry mass (r = 0.52 to 0.65) (Table 4). Although water loss, shoot and root water potentials and percent live root dry mass were all correlated with survival (r = 0.48 to 0.80), they were not correlated with regrowth characteristics such as new terminal shoot length (r = 0.13 to 0.48).
Discussion
Electrolyte and phenolic leakage
Percent live root dry mass provides a direct estimate of root damage, whereas both electrolyte and phenolic leakage pro-vide indirect estimates. Correlations between the direct and indirect viability tests showed that electrolyte leakage of coarse roots and whole root systems as well as phenolic leak-age of coarse roots were highly correlated with percent live root dry mass. However, because of recovery of the root system over time, the same tests were less closely correlated with total live root dry mass measured after 6 months. Similarly, Bigras and Calmé (1994) showed that both electrolyte and phenolic leakage were strongly correlated with total live-root dry mass measured 94 days after the freezing tests but less well corre-lated with total live-root dry mass at Day 204. Lindström and Nyström (1987) found that triphenyl tetrazolium chloride re-duction was closely correlated with root growth capacity of Table 1. Observed significance (P > F) associated with the analysis of variance of variables of Experiment 1----electrolyte and phenolic leakage.
df1 EL2 PL %LIR Survival Stem NTSL Dry mass
diameter
dfn dfd TLIR Shoot Shoot Shoot
lat. term. lat. + term.
Fixed effects (P > F)
Temperature (T) 5 35 ≤ 0.0001 ≤ 0.0001 ≤ 0.0001 ≤ 0.0001 0.3547 0.7570 ≤ 0.0001 0.5053 0.9790 0.4920 T linear 1 35 ≤ 0.0001 ≤ 0.0001 ≤ 0.0001 ≤ 0.0001 ≤ 0.0001
T quadratic 1 35 0.0107 0.0129 ≤ 0.0001
Root parts (R)3 2 84 ≤ 0.0001 ≤ 0.0001 WRS versus FR 1 84 ≤ 0.0001 ≤ 0.0001 WRS versus CR 1 84 ≤ 0.0001 ≤ 0.0001
T × R 10 84 0.0046 0.0179
FR: T linear 1 84 ≤ 0.0001 0.0002 CR: T linear 1 84 ≤ 0.0001 ≤ 0.0001 WRS: T linear 1 84 ≤ 0.0001 ≤ 0.0001 WRS: T quadratic 1 84 0.0186 0.0003
Random effects (P > |Z|)4
Block (B) 0.0854 0.0778 0.4159 0.2755 0.2421 0.2995 0.2226 0.1203 0.1429 0.0857 B × T 0.9179 0.0396 ≤ 0.0001 ≤ 0.0001 0.2018 0.0918 0.0023 0.0825 0.0374 0.3502 Seedlings (B T) ≤ 0.0001 ≤ 0.0001 ≤ 0.0001 ≤ 0.0001 ≤ 0.0001 ≤ 0.0001 ≤ 0.0001 ≤ 0.0001
1 df, degrees of freedom; dfn, degrees of freedom of the numerator; dfd, degrees of freedom of the denominator. 2
EL, electrolyte leakage; PL, phenolic leakage; %LIR, percent live root dry mass; NTSL, new terminal shoot length; TLIR, total live root dry mass; lat., lateral; term., terminal.
3 FR, fine roots; CR, coarse roots; WRS, whole root system.
4 The multiplication sign indicates an interaction; parentheses either enclose a symbol for an effect or indicate embedding of the source of variation
Scots pine (Pinus sylvestris L.), Norway spruce (Picea abies (L.) Karst), and lodgepole pine (Pinus contorta Dougl. ex. Loud.). Lindström and Mattsson (1994) showed that reduced root growth capacity of frost-damaged roots was correlated with increased root electrolyte leakage.
Although both electrolyte and phenolic leakage of whole root systems and coarse roots were correlated with survival, percent live root dry mass showed the highest correlation with survival. These results contrast with those of Palta et al. (1977) who concluded that conductivity of effusate after thawing (electrolyte leakage) can be used to evaluate final injury but not to predict survival. Both electrolyte and phenolic leakage of fine roots were less well correlated with seedling survival than electrolyte and phenolic leakage from the whole root system or coarse roots. In contrast, McKay and Mason (1991) reported
a highly negative correlation between rates of electrolyte leak-age of fine roots and survival of Sitka spruce (Picea sitchensis (Bong.) Carr.) and Douglas-fir (Pseudotsuga menziesii (Mirb.) Franco) seedlings after storage at 1 °C, indicating that the observed differences among root classes may be species spe-cific.
Water loss, and shoot and root water potentials
Water loss and shoot and root water potentials, all of which increased with decreasing temperatures and increasing root damage, were correlated with percent live root dry mass (cf. Bigras and Calmé 1994). Although water loss and root water potential were also correlated with survival, percent live root dry mass was more strongly correlated with this parameter. Water loss values of 0.001 g or less were related to a percent Table 2. Correlation coefficients (r) and levels of probability (second line) among the viability tests, survival and morphological characteristics measured during Experiment 1----electrolyte and phenolic leakage.
EL1 EL EL PL PL PL %LIR Survival Stem NTSL TLIR Shoot Shoot Shoot
FR CR WRS FR CR WRS diameter lat. term. lat. +
DM DM term.
DM
EL-FR 1.00 0.67 0.58 0.49 0.41 0.44 --0.32 −0.31 −0.13 −0.31 −0.34 −0.08 −0.28 −0.17 0.0001 0.0001 0.0004 0.0037 0.0016 0.0260 0.0314 0.3614 0.0346 0.0176 0.5927 0.0504 0.2388
EL-CR 1.00 0.75 0.42 0.62 0.47 −0.74 −0.55 −0.44 −0.61 −0.62 −0.20 −0.59 −0.36 0.0001 0.0039 0.0001 0.0010 0.0001 0.0001 0.0024 0.0001 0.0001 0.1779 0.0001 0.0141
EL-WRS 1.00 0.64 0.75 0.81 −0.71 −0.71 −0.52 −0.70 −0.66 −0.33 −0.63 −0.45 0.0001 0.0001 0.0001 0.0001 0.0001 0.0001 0.0001 0.0001 0.0239 0.0001 0.0013
PL-FR 1.00 0.77 0.69 0.31 −0.37 −0.22 −0.31 −0.38 −0.07 −0.21 −0.09
0.0001 0.0001 0.0311 0.0086 0.1419 0.0343 0.0085 0.6560 0.1570 0.5518
PL-CR 1.00 0.75 −0.64 −0.61 −0.49 −0.61 −0.60 −0.19 −0.48 −0.28
0.0001 0.0001 0.0001 0.0003 0.0001 0.0001 0.1897 0.0006 0.0516
PL-WRS 1.00 −0.49 −0.57 −0.38 −0.53 −0.47 −0.16 −0.44 −0.24
0.0005 0.0001 0.0075 0.0001 0.0008 0.2839 0.0017 0.0973
%LIR 1.00 0.78 0.71 0.78 0.80 0.51 0.76 0.65
0.0001 0.0001 0.0001 0.0001 0.0002 0.0001 0.0001
Survival 1.00 0.89 0.92 0.87 0.62 0.90 0.77
0.0001 0.0001 0.0001 0.0001 0.0001 0.0001
Stem diameter 1.00 0.84 0.83 0.64 0.85 0.77
0.0001 0.0001 0.0001 0.0001 0.0001
NTSL 1.00 0.83 0.53 0.92 0.73
0.0001 0.0001 0.0001 0.0001
TLIR 1.00 0.64 0.80 0.76
0.0001 0.0001 0.0001
Shoot 1.00 0.52 0.94
lat. DM 0.0001 0.0001
Shoot 1.00 0.75
term. DM 0.0001
Shoot 1.00
lateral + terminal DM
1 DM, dry mass; EL, electrolyte leakage; FR, fine roots; lat., lateral; %LIR, percent live root dry mass; CR, coarse roots; NTSL, new terminal
Figure 2. Relationship between freezing temperatures and (a) water loss, 2 SE = 0.14; (b) water potential of shoots (m), 2
SE = 0.015, and roots (d), 2 SE
= 2.66; (c) %LIR, percent live root dry mass, 2 SE = 0.17; (d) survival, 2 SE = 1.21; (e) stem diameter, 2 SE = 0.09 to 0.19; (f) new terminal shoot length, 2 SE = 11.39 to 14.80; (g) TLIR, total live root dry mass, 2 SE = 0.04 to 0.06; (h) dry mass of new lateral (d), 2 SE = 0.017 to
0.024, terminal (m), 2 SE =
0.031 to 0.045, and total (j)
shoots, 2 SE = 0.045 to 0.062. Each symbol is the mean of 12 observations for graphs a and b, six observations for graph c, and 42 observations for graph d. For graphs e--h, number of ob-servations varied between 6 and 41.
Table 3. Observed significance (P > F) associated with the analysis of variance of variables of Experiment 2----water loss, shoot and root water potential.
df1 Water Water Live Survival Stem New Dry mass3 loss potential root DM diam.2 terminal
shoot
dfn dfd Root Shoot Total Shoot Shoot Shoot
length live root lat. term. lat. + term.
Fixed effects (P > F)
Temperature (T) 5 25 ≤ 0.0001 ≤ 0.0001 ≤ 0.0001 ≤ 0.0001 ≤ 0.0001 0.6309 0.3117 ≤ 0.0001 0.0331 0.0300 0.0122 T linear 1 25 ≤ 0.0001 ≤ 0.0001 ≤ 0.0001 ≤ 0.0001 ≤ 0.0001 0.0452 ≤ 0.0001 0.0010 0.0014 0.0003
T quadratic 1 25 0.0275 0.0325 0.0155 0.0007 0.0514
T quartic 1 25 0.0117 0.0113
Random effects (P > |Z|)4
Block (B) 0.2043 0.9657 0.2014 0.5788 0.3127 0.1601 0.2618 0.2401 0.2568 0.2176 B × T 0.3417 0.1927 0.0073 0.0004 0.0004 0.1824 0.2433 0.2366 0.0362 0.3852 0.1530 Seedlings (B T) ≤ 0.0001 ≤ 0.0001 ≤ 0.0001 ≤ 0.0001 ≤ 0.0001 ≤ 0.0001 ≤ 0.0001 ≤ 0.0001 ≤ 0.0001
1
df, degrees of freedom; dfn, degrees of freedom of the numerator; dfd, degrees of freedom of the denominator; DM, dry mass; diam., diameter. 2
15 degrees of freedom of the denominator because of missing values for blocks 2 and 4. 3 lat., lateral; term., terminal.
4 The multiplication sign indicates an interaction; parentheses either enclose a symbol for an effect or indicate embedding of the source of variation
live root dry mass of 70% or more and to a survival rate of around 90%. Comparable threshold values for water potential could not be defined because the water potential values were similar in the −10 to −22.5 °C temperature treatments. McCreary (1984) and Brown et al. (1977) concluded that xylem water potential was related to survival in Douglas-fir, black locust (Robinia pseudoacacia L.) and western hemlock (Tsuga heterophylla (Raf.) Sarg.) seedlings; however, Delisle and D’Aoust (1994) could not find any significant relationship between morphophysiological characteristics of Picea abies, P. glauca (Moench) Voss., and P. mariana seedlings, including xylem water potential and root growth capacity, and their survival in the field.
Long-term effects of freezing-induced root damage
In Experiment 1, seedling survival was ≥ 90% when no more than 30% of the root system was destroyed but survival dropped to between 45 and 70% when about 50% of the root system was destroyed by frost and decreased to 20--30% when about 70% of the root system was destroyed. Destruction of about 50% of a seedling’s root system had no measurable effect on stem diameter, new terminal shoot length or shoot dry
mass after 6 months of regrowth in a greenhouse on a well-ir-rigated substrate. In contrast, Lindström (1986b, 1987) found that exposing root systems of Norway spruce to −16 °C caused a 50% reduction in root growth capacity and a 40% reduction in shoot growth.
Compared with Experiment 1, which showed destruction of 50% of the root dry mass at −20 and −22.5 °C, 70% of the root system was destroyed by the same temperature treatments in Experiment 2, indicating that the seedlings were less cold hardy. Of the surviving seedlings, destruction of 70% of the root system caused significant decreases in new terminal shoot length and total shoot dry mass (lateral plus terminal). Simi-larly, Bigras and Margolis (1997) showed that destruction of about 50% of the root systems of Pinus banksiana Lamb. seedlings resulted in decreased shoot growth and stem diame-ter. Langerud et al. (1991) destroyed half of the root systems of Norway spruce by boiling and showed that shoot growth was lower than in control plants after 20 days in a growth chamber.
Of the tests examined, we conclude that percent live root dry mass provides the most accurate measure of freezing-induced root damage; unfortunately, this test is time consuming. Elec-Table 4. Correlation coefficients (r) and levels of probability (second line) among the viability tests, survival and morphological characteristics measured during Experiment 2----water loss, shoot and root water potential.
WL1 WPR WPS %LIR Survival Stem NTSL TLIR Shoot Shoot Shoot
diameter lat. term. lat. +
DM DM term.
DM
WL 1.00 −0.70 −0.71 −0.66 −0.64 −0.55 −0.13 −0.65 −0.63 −0.61 −0.63 0.0001 0.0001 0.0001 0.0001 0.0053 0.4572 0.0001 0.0001 0.0001 0.0001
WPR 1.00 0.89 0.70 0.64 0.49 0.29 0.65 0.60 0.62 0.63
0.0001 0.0001 0.0001 0.0160 0.0830 0.0001 0.0001 0.0001 0.0001
WPS 1.00 0.66 0.48 0.32 0.15 0.52 0.47 0.46 0.47
0.0001 0.0028 0.1318 0.3811 0.0011 0.0041 0.0050 0.0035
%LIR 1.00 0.80 0.74 0.48 0.84 0.74 0.61 0.68
0.0001 0.0001 0.0028 0.0001 0.0001 0.0001 0.0001
Survival 1.00 0.96 0.49 0.96 0.95 0.86 0.92
0.0001 0.0022 0.0001 0.0001 0.0001 0.0001
Stem diameter 1.00 0.94 0.95 0.93 0.86 0.91
0.0001 0.0001 0.0001 0.0001 0.0001
NTSL 1.00 0.61 0.53 0.39 0.46
0.0001 0.0009 0.0175 0.0048
TLIR 1.00 0.94 0.84 0.91
0.0001 0.0001 0.0001
Shoot 1.00 0.89 0.96
lat. DM 0.0001 0.0001
Shoot 1.00 0.98
term. DM 0.0001
Shoot 1.00
lateral + terminal DM
1 DM, dry mass; lat., lateral; %LIR, percent live root dry mass; NTSL, new terminal shoot length; term., terminal; TLIR, total live root dry mass;
trolyte leakage of the whole root system was ranked the second most reliable test and may be useful for monitoring large samples in the nursery; however, this test must be applied immediately after a frost event, otherwise its reliability is compromised.
Acknowledgments
The author expresses her gratitude to Eric Leclerc, technician, for his collaboration during the project, Carole Hébert for statistical analyses and Michèle Bernier-Cardou for statistical supervision. The author also thanks Richard Gohier and Rosaire Tremblay from the Centre de production de plants forestiers de Québec for their continuing collabo-ration. She also thanks Drs. André D’Aoust from the Canadian Forest Service, Laurentian Forestry Centre, and Carole Coursolle from Uni-versité Laval for revision of the first draft.
References
Bigras, F.J. and S. Calmé. 1994. Viability tests for estimating root cold tolerance of black spruce seedlings. Can. J. For. Res. 24:1039--1048.
Bigras, F.J. and H.A. Margolis. 1997. Shoot and root sensitivity of containerized black spruce, white spruce and jack pine seedlings to late fall freezing. New For. In press.
Brown, G.N., J.A. Bixby, P.K. Melcarek, T.M. Hinckley and R. Ro-gers. 1977. Xylem pressure potential and chlorophyll fluorescence as indicators of freezing survival in black locust and western hem-lock seedlings. Cryobiology 14:94--99.
Cox, D.R. 1970. The analysis of binary data. Methuen’s statistical monographs. Methuen & Co. Ltd., London, 142 p.
Delisle, C. and A.L. D’Aoust. 1994. The relationship between the morpho-physiological characteristics of containerized spruce seed-lings and their field performance. In Making the Grade: An Interna-tional Symposium on Planting Stock Performance and Quality Assessment, Sault Ste. Marie, Ontario. Eds. D.S. Maki, T.M. McDonough and T.L. Noland. Ontario Forest Research Institute. 72 p.
Langerud, B.R., P. Puttonen and E. Troeng. 1991. Viability of Picea abies seedlings with damaged roots and shoots. Scand. J. For. Res. 6:59--72.
Lindström, A. 1986a. Outdoor winter storage of container stock on raised pallets----effects on root zone temperature and seedling growth. Scand. J. For. Res. 1:37--47.
Lindström, A. 1986b. Freezing temperature in the root zone----effects on growth of containerized Pinus sylvestris and Picea abies seed-lings. Scand. J. For. Res. 1:371--378.
Lindström, A. 1987. Winter storage and root hardiness of container-ized conifer seedlings. Doctoral Thesis, Swedish Univ. of Agric. Sci., Dept. Forest Yield Res., Garpenberg, Sweden.
Lindström, A. and C. Nyström. 1987. Seasonal variation in root hardiness of container-grown Scots pine, Norway spruce, and lodgepole pine seedlings. Can. J. For. Res. 17:787--793.
Lindström, A. and A. Mattsson. 1994. Cultivation of containerized seedlings in Sweden----systems for frost protection and methods to detect root injuries. Acta Hortic. (Wageningen) 361:429--440. McCreary, D.D. 1984. Using a pressure chamber to detect damage to
seedlings accidentally frozen during cold storage. In The Challenge of Producing Native Plants for the Intermountain Area. Proceed-ings, Intermountain Nurseryman’s Association Conference, Las Vegas, NV. Ed. P.M. Murphy. USDA For. Serv. Gen. Tech. Rep. INT-168, pp 58--60.
McKay, H.M. and W.L. Mason. 1991. Physiological indicators of tolerance to cold storage in Sitka spruce and Douglas-fir seedlings. Can. J. For. Res. 21:890--901.
Palta, J.P., J. Levitt and E.J. Stadelman. 1977. Freezing injury in onion bud cells. II. Post thawing injury or recovery. Plant Physiol. 60:398--401.
Ritchie, G.A. 1990. A rapid method for detecting cold injury in conifer seedling root systems. Can. J. For. Res. 20:26--30.