THE RELATIONSHIP BETWEEN ENVIRONMENTAL RISK MANAGEMENT AND COST OF CAPITAL
(Study on Indonesia Companies listed in Indonesia Stock Exchange 2009-2011)
By: Akira Aula Afif NIM: 109081100017
DEPARTMENT OF MANAGEMENT INTERNATIONAL CLASS PROGRAM FACULTY OF ECONOMICS AND BUSINESS
SYARIF HIDAYATULLAH STATE ISLAMIC UNIVERSITY JAKARTA
ii
THE RELATIONSHIP BETWEEN ENVIRONMENTAL RISK MANAGEMENT AND COST OF CAPITAL
(Study on Indonesia Companies listed in Indonesia Stock Exchange 2009-2011)
Undergraduate Thesis
Submitted to the Faculty of Economics and Business As Partial Fulfillment of Requirement
For Acquiring Bachelor Degree of Economics
By: Akira Aula Afif NIM: 109081100017
Under Supervision of:
Supervisor I Supervisor II
Prof. Dr. Margareth Gfrerer Dr. Arief Mufraini, LC., M.Si ID. 19770122 200312 1 001
DEPARTMENT OF MANAGEMENT INTERNATIONAL CLASS PROGRAM FACULTY OF ECONOMICS AND BUSINESS
SYARIF HIDAYATULLAH STATE ISLAMIC UNIVERSITY JAKARTA
iii
CERTIFICATION OF COMPREHENSIVE EXAM SHEET
Today is Thursday April 25, 2013 has been conducted on the student comprehensive examination:
1. Name : Akira Aula Afif 2. Studen Number : 109081100017
3. Department : Management (International Class)
4. Thesis title : Relationship Between Environmental Risk Management and The Cost of Capital (Study on Indonesia Companies Listed in Indonesia Stock Exchange 2009-2011)
After cereful observation and attention to appearence and capabilities relevant for comprehensive examination process, it was decided that the above student passed for the comprehensive examination was accepted as one of requirements to obtain a Bachelor of Economics in The Faculty of Economics and Business Syarif Hidayatullah State Islamic University Jakarta.
Jakarta, April 25, 2013
Prof. Dr. Abdul Hamid, MS (_____________________)
ID: 19570617 198503 1 002 Examiner I
Ade Suherlan, MBA, MM. (_____________________)
ID: 19800525 2009 12 1 001 Examiner II
iv
CERTIFICATION OF THESIS EXAM SHEET
Today is Wednesday September 25th, 2013 has been conducted on the student thesis examination:
1. Name : Akira Aula Afif 2. Student Number : 109081100017 3. Department : Management
4. Thesis Title : The Relationship Between Environmental Risk Management nd Cost Of Capital ( Study on Indonesian Companies Listed in Indonesia Stock Exchange 2009-2011)
vi
CURRICULUM VITAE
Personal Detail
Full Name : Akira Aula Afif Nickname : Akira
Address : Jl. Bondol Block C No. 21, Jakamulya, Bekasi Selatan, 17146 Mobile Number : 081511538797 Competence and Personality :
Formal Education
School Year
Elementary Uplands School Penang 2000 – 2001
SD Tunas Jakasampurna Bekasi
2001 – 2004
Junior High School Jabriya Indian School Kuwait
2004 – 2005
New Kuwait Phillipines International School
2005 – 2007
Senior High School SMA Tunas Jakasampurna Bekasi
2007 – 2009
University State Islamic University Syarif Hidayatullah Jakarta. Major : Management International
vii
Informal Education
Spanish Course (2013 – present)
Working Experience
Internship at Yamaha (2012)
Organization Experience
Member of Tunas Patriot Bekasi Club (2007 – 2009)
Member of Persipasi Bekasi U – 15 (2007)
Member of PMII (2009 – 2010)
Conference Participation
Seminar about Insurance in globalization era ( 20 May 2010 )
Seminar about the Gulen Model of Education ( 20 October 2010 )
Seminar about war of smartphone operating system ( 4 May 2011 )
Conference of Model United Nations ( 22 – 23 December 2012 )
World Export Development Forum ( 15 – 17 October 2012 )
Seminar about Marketing Politics ( 30 May 2013 )
Activity of Co-curricular
Company visit to Perum Peruri ( 2010 )
viii Abstract
Relationship between Evironmental Risk Management and Cost of Capital
The purpose of this research is to find the relationship between environmental risk management and the cost of capital. The research uses simple regression approach as a statistical method. Environmental risk management variable is measured by the environment indicators stated in the sustainability report of Indonesian companies listed in Indonesia Stock Exchange in the year of 2009 until 2011. The cost of capital is measured by cost of equity, cost of debt, and the overall average cost of capital (WACC). Based on purposive sampling method and established criteria, there are 14 companies from various sectors selected as sample. So there are 42 sample units. The result of this study shows that environmental risk management have a significant negative relationship with the cost of capital of the company.
ix Abstrak
Relationship between Evironmental Risk Management and Cost of Capital
Penelitian ini bertujuan untuk mencari hubungan antara manajemen risiko lingkungan dan biaya modal perusahaan. Metode statistic yang digunakan dalam penelitian ini adalah analisis kuantitatif dan regresi sederhana. Variable environmental risk management diukur dengan indicator lingkungan pada laporan keberlanjutan perusahaan Indonesia yang terdaftar di Indonesia Stock Exchange dari tahun 2009 sampai 2011. Biaya modal diukur dengan cost of equity, cost of debt, dan rata-rata keseluruhan biaya modal (WACC). Berdasarkan purposive sampling dan criteria yang sudah ditetapkan, maka terdapat 14 perusahaan dari berbagai sector yang terpilih menjadi sampel penelitian. Sehingga terdapat 42 unit sampel. Hasil penelitian menunjukan bahwa environmental risk management berpengaruh negative significan terhadap keseluruhan biaya modal perusahaan.
x Foreword
Assalamuu‘alaikum Wr. Wb.
All praise to Allah SWT as the hearer, the seer and above all an abundance of grace, Taufiq, as well as his guidance. So, because Allah SWT I can finish this research on time. And shalawat always gives to our beloved Prophet Muhammad SAW and all his families and friends who always helped him in establishing Dinullah in this earth.
With the strength, intelligence, patience, and strong desire from Allah SWT, I am able to finish this mini thesis as graduation pre requirement for bachelor degree. I believe there is an invisible hand which has helped me going through this process.
My special thanks for my Mom, Dian Sudirman, who has been helping and supporting her son to finish the thesis. You are the embodiment of angle in human form. So, I want to make you always smile because your smile is the efficacious magic that can boost my spirit to reach my dream and face the world. Thank you for every struggle that you made for your family. Thanks mom, even a
thousand of word can‘t explain how really happy I am to be your son.
xi
have done. Thank you for every support that you give to me. For my siblings, Akiko Nada Atsmara, Azka Aulia Rizqi, and Afifah Hanaa Nuralaf, who always support, and give the input regarding this thesis. Thank you because very much for helping me achieving the bachelor degree.
I believe I am nothing without each one of you who has helped me in finishing this mini thesis. Thus, in this very special moment, let me say many thanks to all of them have been helping me in the process of this thesis, including:
1. Prof. Dr. H. Abdul Hamid. MS as Dean of the Faculty of Economics and Business who helped me in completing this mini thesis and received Bachelor Degree.
2. Ahmad Dumyathi Bashori, MA as Head of International Program. 3. Prof. Dr. Margareth Greferer as the first thesis supervisor. Thank you
for the guidance and gave directions to me so I can finish this great thesis.
4. Dr. M. Arief Mufraeni, Lc., Msi as the second supervisor that gave me a lot of inputs, advice, and also gave solutions regarding the problems
I‘ve faced in doing this thesis.
5. All lectures who have thought patiently, may what they have given are recorded in Allah SWT almighty.
6. Thanks to Mr. Sugi for processing all of my academic administrations in this university.
xii
8. My Grandmother and the ampera crew for giving me the place and time to focus on my thesis.
9. All my friends in management international batch 2009.
Riski,surya,ali,ari,yaser,angga and other members in d‘kosan ―you guys are insane‖. Andre, pian, oji, haris, lukman, Gerry, firaz for having a great time during our studies and playing.
10.Seniors and juniors of management and Accounting international who motivates me and give me spirit.
11. Special thanks to my girlfriend Innez for working and helping together to finish our thesis. I also thank for the support that you‘ve given to me all time.
I realize that this thesis is still far from perfection, thus suggestions and constructive criticism from all parties are welcome, in order to improve my thesis. Finally, only Allah SWT will return all and I hope this thesis will be useful to all parties, especially for writers and readers in general, may Allah SWT bless us and recorded as the worship of Allah‘s hand. Amin.
Wassalamualaikum Wr. Wb
Jakarta,September 2013
xiii
TABLE OF CONTENTS
INFORMATION PAGE
Cover ... i
Certification from Supervisor ... ii
Certification of Comprehensive Exam Sheet ... iii
Certification of Thesis Exam Sheet ... iv
Sheet Statement Authenticity Scientific Work ... v
Curriculum Vitae ... vi
Abstract ... viii
Abstrak ... ix
Foreword ... x
Table of Content ... xiii
List of Table ... xvii
xiv CHAPTER I : INTRODUCTION
A. Background of Study ... 1
B. Problem Definition ... 5
C. Objectives of study ... 5
D. Significance of study ... 6
CHAPTER II : LITERATURE REVIEW A. Theory Development ... 7
1. Introduction ... 7
2. Company Risks……… 7
3. Definition of Risk Management ... 8
a. Environmental Risk Management ... 10
b. Difference Between Risk Management and Risk Assessment ... 11
4. Definition of Cost of Capital ... 11
a. Definition of Cost of Equity ... 13
b. Definition of Cost of Debt ... 14
5. Relationship between Environmental Risk Management and Cost of Capital ... 15
B. Previous Research ... 17
C. Logical Framework ... 19
xv
CHAPTER III : RESEARCH METHODOLOGY
A. Scope of Research ... 21
B. Sampling Methods ... 22
C. Data Collection Methods ... 23
D. Analysis Method ... 23
1. Descriptive Analysis ... 23
2. Normality Test ... 24
a. Graph Analysis ... 24
b. Statistical Test ... 24
3. Hypothesis Test ... 25
a. Coefficient of Determination Test ... 25
b. Partial Regression Test (T-test) ... 26
E. Variable Operation ... 26
1. Independent Variable ... 26
2. Dependent Variable ... 26
CHAPTER IV : FINDING AND ANALYSIS A. General description of research object ... 30
1. Overview of selected companies ... 30
2. Overview of business development of selected companies ... 31
xvi
1. Descriptive Statistics ……….. 32
a. Independent variable ... 32
b. Dependent variable ... 37
1. Cost of equity (COE) ... 37
2. Cost of debt (COD)………...… 40
3. Cost of Capital (WACC)…………..…… 44
2. Normality Test ... 48
a. Normality Test for Cost of Equity ... 48
b. Normality Test for Cost of Debt ... 50
c. Normality Test for WACC ... 52
3. Hypothesis Test ... 54
a. Coefficient Determination Test ... 54
b. Partial Test ... 56
CHAPTER V : CONCLUSION AND RECOMMENDATION A. Conclusion ... 62
B. Recommendation ... 63
REFERENCES ... 65
xvii
LIST OF TABLES
No. Description Page
1.1 Real cases of company wastes ... 3
3.1 Operational Variable ... 27
3.2 List of environment indicators in sustainability report ... 28
4.1 Environmental Index ... 32
4.2 Descriptive statistics for environment index………. 33
4.3 COE Ratio ... 37
4.4 Descriptive statistics for COE ratio………..………. 38
4.5 COD Ratio ... 40
4.6 Descriptive statistics for COD ratio………..………. 41 4.7 WACC Ratio ... 44
4.8 Descriptive statistics for WACC ratio………..………. 45
4.9 Kolmogorov-smirnov test of COE ... 49
4.10 Kolmogorov-smirnov test of COD ... 51
4.11 Kolmogorov-smirnov test of WACC ... 53
xviii
4.13 Coefficient Determination Test for COD ... 55
4.14 Coefficient Determination Test for WACC ... 55
4.15 Result T-Test for COE ... 57
4.16 Result T-Test for COD ... 58
xix
LIST OF FIGURES
No. Description Page
4.1 Environment index 2009 ... 34
4.2 Environment index 2010 ... 35
4.3 Environment index 2011 ... 36
4.4 COE ratio in 2009 ... 38
4.5 COE ratio in 2010 ... 39
4.6. COE ratio in 2011 ... 39
4.7. COD ratio in 2009 ... 42
4.8 COD ratio in 2010 ... 43
4.9 COD ratio in 2011 ... 43
4.10 WACC ratio in 2009 ... 46
4.11 WACC ratio in 2010 ... 46
4.12 WACC ratio in 2011 ... 47
4.13 Histogram graphic of COE………... 48
4.14 Normal P-Plot graphic for COE………... 49
xx
4.16 Normal P-Plot graphic for COD………... 51
4.17 Histogram graphic of WACC……….. 52
1 CHAPTER I INTRODUCTION
A. Background of the Study
To produce goods ready for consumption, the company needs materials and other supporting factors, such as raw materials, auxiliary materials, equipment and labor. The company is a technical entity that aims to produce goods or services. The company is also called the venue for the production process that combines factors of production to produce goods and services. Nowadays, there are still many companies who just think about themselves, how they get profit, and how they survive in the market. But what about their environment? As we can see now, usually the environment of companies in Jakarta are already polluted by the waste of the companies. They throw their waste anywhere like in rivers and subsequently the sea. Their waste causes diseases which harm the lives around the firms.
The idea that a firm‘s environmental (―green‖) performance and overall economic
2
In their theoretical perspectives, previous authors have argued that if the firm makes
―greener‖ (i.e., more efficient) use of its resources it will be more economically effective.
Such ―greener‖ use can come from for example generating less pollution and waste from the resources employed or by using fewer resources. While there have been some dissenting voices along the way ( Chen and Metcalf 1980; Mahapatra 1984), when researchers find a positive relationship between environmental and economic performance, they generally credit it to such improved resource utilization which in turn leads to overall increases in organizational effectiveness.
Some authors assume that environmental protection mainly causes costs to a company whereas others believe that environmental protection generally pays off and thus improves
the firm‘s bottom line (Cohen et al., 1995). The relationship between environment and
3 Table 1.1
Some real cases of company wastes No Name of Company Type of Activity Elements
Palm Oil Liquid Waste Batu-Batu
river Aceh
2 PT Nagamas Mulya Palm Oil Liquid Waste Citalas river
Riau
3 PT. Surabaya Agung
Kertas
Pulp and Paper Liquid Waste Surabaya river
4 PT Bintang Tri Putratex,
PT Kesmatex,
CV Ezritex
Tekstil dan Batik Liquid Waste Banger
Pekalongan
Liquid Waste Muncar river
Banyuwangi
6 PT. Tonikotex Textiles Liquid Waste Tangerang
river
7 PT. DKB, PT Daya
Radar Utama, PT. Bayu Bahari, PT. Wayata Kencana
Shipyard Industry Solid waste/sand blasting
Tanjung Priok Sea
8 PT. Jace Oktavia Mandiri
waste treatment Ferrosand waste
(steel slag)
Batu Aji Batam
Source: www.indowarta.co
4
Most research on the environmental-economic performance relationship has been predicated on the idea that (internal) strategic environmental investments result in improved
resource efficiency (Bansal and Roth, 2000; Branzei et al., 2004; Buysse and Verbeke,
2003). While the effects of such strategic choices are often clear even to the financial markets, internal financing is not the only phenomena that drive organizational performance. Institutional and other external factors also have a profound effect on the performance
(survival) of firms (Singh, Tucker, and House, 1986).
Institutional and other external factors also have a profound effect on the performance (survival) of firms (Singh, Tucker and House 1986). While several researchers have examined how the stock market reacts to improved environmental performance through market returns (Dowell et al. 2000; Gottsman and Kessler 1998; Mahapatra 1984; Nina Febriana 2012) little attention has been paid to such external influences on the environmental-economic performance relationship itself.
There are also researches which are in contrast. Christmann (2000) finds out that an environment profile of a firm could lead to a heavy cost incurred by the company. Stephanus (2012) proved that there is no influence of the corporate social responsibility to the cost of equity. From the results of the researches tells us that there is a gap that appear regarding the topic of environment and economic performance of the company.
5 B. Problem Definition
The improved environmental risk management improves the market‘s risk perception of
the firm. There is evidence in the literature that investors and analysts take account of
improvement in environmental risk factors when making investment decisions and recommendations (Heinkel, Kraus, and Zechner, 2001; Mackey, Mackey, and Barney,
2007). This perception should, in turn, cause the financial market allow low risk premiums
on equity, or allow the firm to get higher levels of leverage, which can cause a lower cost of
capital for the firm. To examine the relationship between environmental risk management and cost of capital, this research underlays these following questions:
1. Does the environmental risk management has a relationship with the firm‘s cost of equity?
2. Does the environmental risk management has a relationship with the firm‘s cost of debt?
3. Does the environmental risk management has a relationship with the firm‘s overall cost of capital?
C. Objectives of the Study
To be more specific, the study was undertaken in order to:
1. To know whether the environmental risk management is related to the firm‘s cost of capital in Indonesia.
6 D. Significance of the Study
The results of this study are significant in various aspects.
Firstly, on the basis of the findings of the study, the report has identified the reasons behind the relationship between environmental risk management and the cost of capital
Secondly As consideration for the company in making decision towards the influence of environmental risk management to the cost of capital.
7 CHAPTER II
LITERATURE REVIEW
A. Theory Development
1. Introduction
The review will start with the understanding of company risks, risk management, environmental risk management, and the cost of capital. In the next step this literature intends to elaborate a critical evaluation of the relationship between the environmental risk management and the cost of capital.
2. Company Risks
According Taswan (2006), business is sharing the risk, not only sharing profit. The more a company discloses its risk, the more the ability to avoid such risks. Amran et al (2009) mentions some risks in a company as follows:
a. Financial risk are risks associated with financial instruments like market risk, credit, liquidity and interest rate.
b. Operational risk are risks associated with customer satisfaction, product development, sourcing, product failure, and the environment.
c. Technology and information processing risk are risks associated with access, availability, and technology and information infrastructure of the company.
8
e. Risk strategy are risks associated with environmental monitoring, industrial, business portfolio, competitors, regulatory, and political power.
Muslich (2007) stated that companies which are aware of the risks and conduct risk management are capable to survive because they could handle the current risk and ready to face future incoming risks.
3. Definition of Risk Management
The word 'risk' has two distinct meanings. It can mean in one context a hazard or a danger, that is, an exposure to mischance or peril. In the other context, risk is interpreted more narrowly to mean the probability or chance of suffering an adverse consequence, or of encountering some loss. Because the word 'risk' can be used in these different ways the term has led to some confusion.
Vaughan (1978) raised several definitions of risk as follows:
Risk is the chance of loss
Chance of loss is associated with an exposure to the possibility of losses. In the case of 100% chance of loss, the loss is a certainty so that there is no risk.
Risk is the possibility of loss
9
Risk is uncertainty
Uncertainty is an individual assessment of the risk situation based on knowledge and attitude of the individual concerned.
Risk is the dispersion of actual from expected results
Statisticians defines risk as the degree of deviation of a value around a central position or around the point on average.
Risk is the probability of any outcome different from the one expected
Risk is not the probability of a single event, but the probability of several outcomes which might be different from the one expected.
One of the most general definitions of risk was defined by the International Organization for Standardization in the ISO 31000 standard. According to this standard, risk is defined as the effect of uncertainty on objectives (ISO, 2009).
According to Smith (1990) risk management is defined as the identification, measurement, and control of financial risks that threaten an asset and the income of a company or project that may cause damage or loss to the company.
Amran et al (2009) expresses that risk management is very beneficial for the company in managing the risk-owned. Risk management is conducted by company to manage the risks and opportunities that relate to the achievement of corporate goals.
10 a. Environmental Risk Management
Environmental management is a mixture of science, policy, and socio economic applications. It focuses on the solution of the practical problems that humans encounter in cohabitation with nature, exploitation of resources, and production of waste (McGraw-Hill, P.831).
Investors and companies have become more and more conscious of the many ways that environmental issues affect their businesses, presenting not only challenges but also opportunities. Environmental issues generate business risks that have to be carefully handled. Regulations related to businesses and the environment constantly improve and almost often create uncertainties for companies bringing significant implications for their
financial performance. Consumer‘s reactions and other environmentally motivated actions
create serious non-regulatory risks that may reduce a company‘s markets or affects its financial strength(Fall, 2001).
Case (1999) stated that many business leaders realized that environment factors can lead to economic growth around the world and agrees that environmental management can improve the bottom line performance of the company. Cost savings have been identified through:
Reduce the usage of raw materials through more efficient production techniques
Reuse or recycle wastes
Reducing the amount of energy used, such as gas and electricity
Cutting water consumptions
11
b. Difference Between Risk Management and Risk Assessment
According to the Environmental Protection Agency, a risk assessment is ―the evaluation
of scientific information on the hazardous properties of environmental agents, the
dose-response relationship, and the extent of human exposure to those agents‖ (EPA Glossary of
IRIS Terms).
Once risk has been assessed and characterized, ―political, social, economic and
engineering implications together with risk-related information‖ are gathered ―in order to develop, analyze and compare management options and select the appropriate managerial
response to a potential chronic health hazard‖ (EPA Glossary of IRIS Terms). This process
is called risk management. Together these steps comprise the scientific approach to risk (Stern, 2007).
According to Pritchard (2012), risk assessment is defined as risk estimation and risk evaluation or can be said as risk analysis, while risk management is the process of implementing decisions on managing risks. Risk management involves identifying, analyzing, and taking steps to reduce or eliminate the loss faced by an organization or individual.
4. Definition of Cost of Capital
12
Cost of capital is the expected rate of return that the market participants require in order to attract funds to a particular investment. In economic terms, the cost of capital for a particular investment is an opportunity cost—the cost of forgoing the next best alternative investment. In this sense, it relates to the economic principle of substitution—that is, an investor will not invest in a particular asset if there is a more attractive substitute (Pratt and Grabowski 2010).
The cost of capital usually is expressed in percentage terms, that is, the annual amount of dollars that the investor requires or expects to realize, expressed as a percentage of the dollar amount invested (Pratt and Grabowski 2010).
According to Sharfman and Fernando (2007), cost of capital is the rate that investors
use to discount a firm‘s future cash flow. The higher the cost of capital, the lower the present
value of the firm‘s future cash flow. Firms lower cost of capital will be more highly valued
than firms with higher cost of capital and therefore more attractive to investors.
Ogier, Rugman, and Spicer (2004) stated that cost of capital is a financial resource given to an enterprise or a project which is paid back in a period of time. The cost of capital increases with risk. The riskier an investment, the higher the reward needed to attract investors.
According to Lee (1990) and Brigham (1994), the cost of capital is important because:
In the capital budgeting decision, requires the estimation of cost of capital
Business decisions such as issuing bonds, choose of leasing or purchase of
13
Financial managers aim to maximize firm value by minimizing costs
including cost of capital.
According to Iramani and Hidalgo (2005), the practice of financing or funding of the company is acquired from various sources. Thus the real cost borne by the company's is the overall cost of all financing sources are used. According to Damodaran (2001) calculating
the firm‘s overall cost of capital is by the weighted average cost of capital (WACC). The
firm‘s after-tax weighted average cost of capital (Modigliani and Miller 1958)
��� = + � + + �
Where
E = market value of firm‘s equity; D = market value of firm‘s debt;
rE = the firm‘s cost of equity capital;
rD= the firm‘s cost of debt capital.
a. Definition of Cost of equity capital
Damodaran (2001) defines equity as a financial instrument that has a residual claim on
the firm, does not provide tax advantages from the firm‘s cash outflow, has an infinitive age,
and providing management control to its owner.
14
line with the definition by Damodaran (2001) which defines the cost of equity as the expected return of investors that includes the risk premium of equity or the required rate of return by the investor on the investment in the equity.
Cost of equity capital is the cost which is taken out to fund the source of financing (Modigliani and Miller 1958). Mardiyah (2002) stated that cost of equity capital can be identified as the minimum level of return which is required by investors.
According to Riyanto (1996), the cost of equity capital is the part that should be issued by the company to give satisfaction to the investors on a particular level of risk. Stated that companies have the duty to reveal reports regarding the company which have an impact on the costs incurred. Therefore, the cost of equity is the cost incurred by the company to provide information to the public (shareholders, investors, and the society in general).
According to Chancera (2011), the cost of equity capital measurements are influenced by valuation models used by company. One of the valuation models is Capital Asset Pricing Model (CAPM) (Sharpe 1964; Littner 1965)
� = � +� (�� − � )
Where
rF = the risk free rate;
rM = the return on the market portfolio; β= the firm‘s systematic risk.
b. Definition of cost of debt
15
bankruptcy. The company has the option to conduct debt financing in the form of bank loans, bonds, and leasing.
Young and O‘byrne (2001) confess that cost of debt is the interest rate that must be paid
by the company if they obtain funds or capital by way of loans from the lenders or creditors. By borrowing from outside the company, then it will raise a debt interest which became costs for the company.
Fabozzi (2007) define the cost of debt as the desired rate of return by the lender at time when they provide funding to the company. Pittman and Fortin (2004) measures the cost of debt as interest expense paid by the company during the year divided by the average number of long-term and short-term loans during the year.
According to Brigham (1994) and Lee (1990) the relevant cost of debt is the cost of issuing new debt (after taxes) or interest paid by the company to new bondholders. Cost of debt can be calculated as follow:
After-Tax cost of debt = Rd (1-tc)
Where
Rd = Interest rate of debt tc = corporate tax rate
5. Relationship between Environmental Risk Management and Cost of Capital
16
hazards bring uncertain level of financial impact. By reducing potential hazards the firm reduces number of potential claimants through fines, settlements or other compliance and
therefore firms‘ economic resources can be directed to dividends to stockholders, debt
payments, internal investments or acquisitions. This strategy improved risk perception of the company by the market (King and Shaver 2001).
Sharfman and Fernando (2007) stated that doing environmental risk management activities by improving environmental performance can reduce the possibility that firms will face extreme environmental events (Union Carbide‘s Bhopal disaster or the Exxon Valdez oil spill) that can require heavy cash outflows arise from compensation and clean-up costs, and thereby brings firm closer to bankruptcy.
Environmental risk management investments are usually long term and cannot be easily
reversed. Perhaps such stability makes more credible from the view of the firm‘s future debt
holders (Chidambaran, Fernando, and Spindt 2001).
In summary the literature shows that the environment is directly affecting the bottom line, often with very different consequences for companies even within the same sector. In many industries, environmental issues have implications that can significantly affect
17 B. Previous Research
This literature review tries to find out the research already conducted in this field and to what this thesis could contribute. The following researches have already been conducted in this field:
1. Environmental Risk Management and the Cost of Capital (Study on publicly-held US firms ) (Sharfman and Fernando, 2007) :
This research is about a study of 267 U.S. firms shows that improved environmental risk management is associated with a lower cost of capital. These findings provide an alternative perspective on the environmental – economic performance relationship, which has been dominated by the view that improvements in economic performance stem from better resource utilization. Firms also benefit from improved environmental risk management through a reduction in their cost of equity capital, a shift from equity to debt financing, and higher tax benefits associated with the ability to add debt. These findings help build better theory regarding the outcomes of strategic improvements in environmental risk management.
2. Environmental Externalities and Cost of Capital (Chava, 2010)
18
to firms with these environmental concerns. These provide evidence that environmental profile of a firm is not simply a proxy for an omitted component of its default risk. Further, firms with these environmental concerns have lower institutional ownership and fewer banks participate in their loan syndicate than firms without such environmental concerns. These results suggest that exclusionary socially responsible investing and environmentally sensitive lending and the consequent increase in the cost of equity and debt capital has the potential to prompt firms to internalize their environmental externalities.
3. Corporate Environmental Management and Credit Risk (Bauer and Hann, 2010):
19 C. Logical Framework
Independent Variable Dependent Variable
Environment Risk Management Cost Of Capital (WACC)
Environment Indicator Rasio from Sustainibility report
WACC, Cost of Equity, and Cost of Debt
Hypothesis Test:
Simple Regression
Analysis
20 D. Hypothesis
From the explanation concern with this research, hypothesis that can be formulated as follows:
H1 : The higher the level of environmental risk management the lower the cost of
equity capital.
H2 : The higher the level of environmental risk management the lower the firm‘s cost
of debt capital for a given level of debt.
H3 : The higher the level of environmental risk management the lower the firm‘s
21
CHAPTER III
RESEARCH METHODOLOGY
A. Scope of Research
This research is empirical study of hypothesis testing to prove the relationship between environmental risk management and the cost of capital. Where in this study, which act as the independent variable is the environmental risk management measured by environment indicators in the sustainability reports. Meanwhile, the dependent variable is the cost of capital (WACC), debt capital, and equity capital.
The environment risk management data is using the environment indicators in the sustainability report. Kytle and Ruggie (2005) expresses that company‘s risk can be reduced and managed through better CSR programs.
22 B. Sampling Method
Sampling method is a research method which the data is taken from the population. Sample is a part of population which is taken for the purpose of research. Sample consist of member of population. The sample in this research is the selected Indonesian companies listed in the Indonesia Stock Exchange in the period within 2009 – 2011.
This research will conduct a purposive sampling. Regarding to the population in this research must meet the following criteria:
1. The Emitent has published their sustainiblity reports on an annual basis within 2009-2011.
2. The Emitent applies GRI cross index as the guidance for the sustainability report.
3. The Emitent has published their sustainability report on the company‘s website.
4. The companies used for sample are the listed companies in Indonesia Stock Exchange in the period 2009-2011
23 C. Data Collection Method
This research is using secondary source data. The data are obtained from the company‘s
website, which consist of company‘s sustainability report and annual report.
The data collection method in this research is using regression panel data. According to Farah (2011) panel data analysis is method of learning a particular topic from multiple sites and periodically observed within the prescribed period. Data panel is a technique which combines time series data and cross-section data. The combination of the data enhances the quality and quantity of the data.
D. Analysis Method
This research will use the method of content analysis. Each type of information of environment indicators in the sustainability report will be scored by using numbers. Zero numbers for no disclosure of environment indicators in sustainability report and 1 for the revealed disclosure of environment indicators in sustainability report.
The variables in this research will be tested through the method of descriptive analysis and hypothesis testing, as follow as:
1. Descriptive Analysis
24 2. Normality Test
Normality test is used to determine the distributed data is normal or not. There are two ways to test, i.e. the graph analysis and statistical tests (Ghozali, 2011).
Graph Analysis
When using graph analysis, normality test can be done by looking at the spread of the data (dots) on the diagonal axis of the graph or by looking at the histogram from the residual.
(1) If the dots spread around the diagonal line and follow the direction of the diagonal line, the regression model meets the normality assumption.
(2) If the dots spread away from diagonal lines and / or do not follow the direction of the diagonal line, the regression model does not meet the normality assumption.
Statistical test
Kolmogorov-Smirnov Z (1 - Sample KS) uses for making decision regarding the normality test.
(1) If the value Asymp. Sig. (2-tailed) less than 0.05, it means that the data are not normally distributed
25 3. Hypothesis Testing
This research uses 1 independent variable and 3 dependent variables. The analysis method use for the hypothesis testing is simple regression method .
Simple regression analysis is a method to measure a linear relationship between one independent variable(X) and the dependent variable (Y). This analysis is to determine the direction of the relationship whether it is positive or negative relation between the two variables. For testing the hypothesis is used model as follow by:
Y1=α + β Env Y2= α + β Env Y3= α + β Env
Description:
Y1 = Cost of Equity Y2 = Cost of debt Y3 = Cost of Capital α = constant
β Env = Beta environment
a. Coefficient Determination (R2)
26
R2 get near to 1, it means that the regression model is precise or the independent variable can elaborate dependent variable.
b. Partial Regression Test (T-Test)
The T-Test is used to determine whether the independent variable (X) in the regression model partially has a significant effect on the dependent variable (Y). If the significant T is more than 0,05 so H1,H2, or H3 is rejected. While if significant T is less than 0,05 so H1,H2, or H3 is accepted. If H1,H2, and H3 are accepted means that there is a significant relationship between independent and dependent variables.
E. Variable Operation
1. Independent Variable
There is only one independent variable in this research. The independent variable is economic indicator in the sustainability report. In the sustainability repot, there are 30 environmental indicators (table 3.2). The environment index for testing the compliance of sustainability reporting by follow as formulation:
Environment Index = n
k x 100%
Description :
n : the environment indicators performed by company k : total of environment indicators in sustainability report
2. Dependent Variable
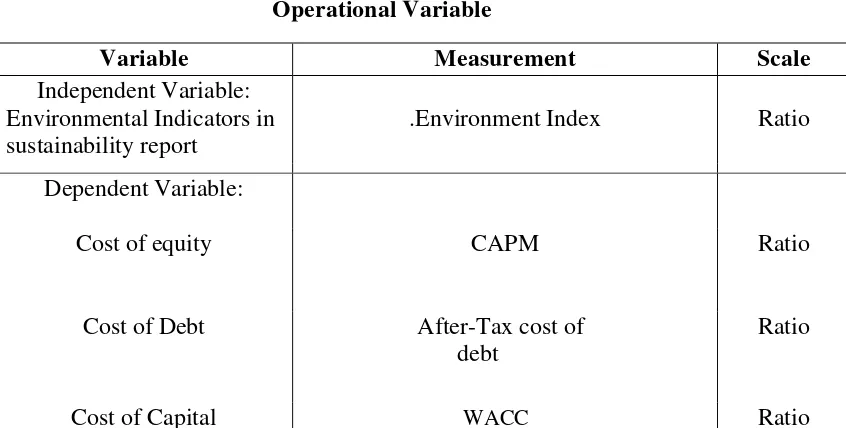
27 a. Cost of Equity
Cost of equity shows the return that the stockholders require for their investment
in a company. A firm‘s cost of equity represents the compensation that the market
demands in exchange for owning the asset and bearing the risk of ownership.
b. Cost of Debt
Cost of debt is a part of the company‘s capital structure. The debt consists of
various bonds, loans and other forms of debt. This is a measure to determine the overall rate being paid by the company to use debt financing.
c. Cost of Capital (WACC)
WACC consists of cost of equity and cost of debt. WACC determines how a company can raise money as its source of funding.
Table 3.1 Operational Variable
Variable Measurement Scale
28
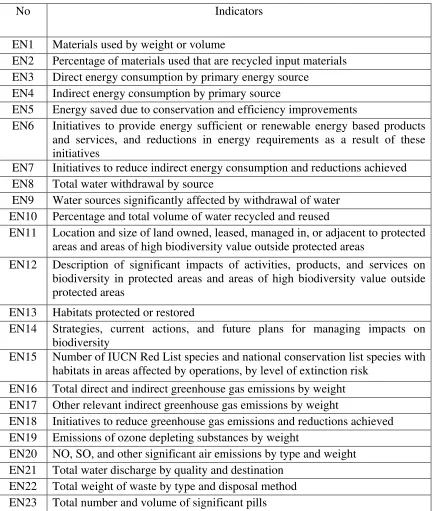
The environment risk management data are taken from the sustainability reports of the company from 2009-2011. The following table presents the environment indicators of the sustainability report.
Table 3.2
List of environmental indicators in Sustainability report
No Indicators
EN1 Materials used by weight or volume
EN2 Percentage of materials used that are recycled input materials EN3 Direct energy consumption by primary energy source
EN4 Indirect energy consumption by primary source
EN5 Energy saved due to conservation and efficiency improvements
EN6 Initiatives to provide energy sufficient or renewable energy based products and services, and reductions in energy requirements as a result of these initiatives
EN7 Initiatives to reduce indirect energy consumption and reductions achieved EN8 Total water withdrawal by source
EN9 Water sources significantly affected by withdrawal of water EN10 Percentage and total volume of water recycled and reused
EN11 Location and size of land owned, leased, managed in, or adjacent to protected areas and areas of high biodiversity value outside protected areas
EN12 Description of significant impacts of activities, products, and services on biodiversity in protected areas and areas of high biodiversity value outside protected areas
EN13 Habitats protected or restored
EN14 Strategies, current actions, and future plans for managing impacts on biodiversity
EN15 Number of IUCN Red List species and national conservation list species with habitats in areas affected by operations, by level of extinction risk
EN16 Total direct and indirect greenhouse gas emissions by weight EN17 Other relevant indirect greenhouse gas emissions by weight
EN18 Initiatives to reduce greenhouse gas emissions and reductions achieved EN19 Emissions of ozone depleting substances by weight
EN20 NO, SO, and other significant air emissions by type and weight EN21 Total water discharge by quality and destination
29
No Indicators
EN24 Weight of transported, imported, exported, or treated waste deemed hazardous under the terms of the Basel Convention Annex I, II, III, and VIII, and percentage of transported waste shipped internationally
EN25 Identity, size, protected status, and biodiversity value of water bodies and
related habitats significantly affected by the reporting organization‘s
discharges of water and runoff
EN26 Initiatives to mitigate environmental impacts of products and services, and extent of impact mitigation
EN27 Percentage of products sold and their packaging materials that are reclaimed by category
EN28 Monetary value of significant fines and total number of non-monetary sanctions for non compliance with environmental laws and regulations
EN29 Significant environmental impacts of transporting products and other goods
and materials used for the organization‘s operations, and transporting
members of the workforce
EN30 Total environmental protection expenditures and investments by type
30 CHAPTER IV
FINDING AND ANALYSIS
A. General description of Research Object
This chapter presents and discusses the finding of the research conducted. The research is a descriptive study of environmental indicators in 42 sustainability reports which are compliant with GRI G3. The cost of capital of the selected companies was compiled from the data from the annual reports of the companies listed in Indonesia Stock Exchange in the year of 2009-2011. The period 2009-2011 is choosen in order to fulfill the requirements of the research method. The hypothesis is tested by the simple regression method. The selection of the sample is chosen by criteria of population that have been explained in research methodology in the previous chapter.
1. Overview of selected companies
In 2009-2011, the companies that are listed in Indonesia Stock Exchange are 451 companies. The purposive sampling is used for choosing the samples. From the 451 companies listed, there are only 14 companies which fulfill the criteria in the time series of 3 years. Therefore, in total there are 42 sustainability reports and 42 annual reports of the companies.
The reports are taken from the company‘s website. As an independent variable,
31
Table of 14 selected companies
Name of Company Sector
PT. Adaro Energy Energy
PT. Antam Mining
PT. Astra Agro Lestari Agriculture
PT. Astra International Automotive
PT. Holcim Indonesia Cement
PT. Bumi Resource Mining
PT. Petrosea Mining
PT. Bukit Asam Mining
PT. Telekomunikasi Indonesia Telecommunication
PT. Timah Mining
PT. Bakrie Sumatra Plantations Agriculture
PT. Bank Negara Indonesia Bank
PT. Perusahaan Gas Negara Energy
PT. United Tractors Machinery and mining
2. Overview of business development 14 selected companies
32 B. Analysis and Discussion
1. Descriptive analysis
The independent variable in this research is the environment risk management. From the indicators in the sustainability report, only the environment indicator is used in this research result the environment index.
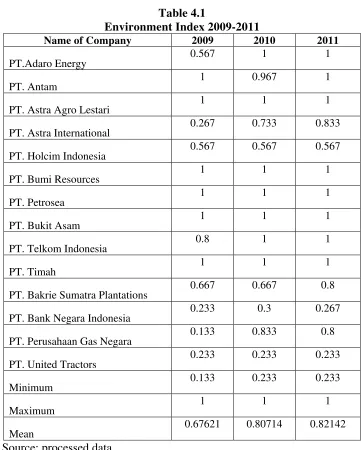
a. Independent Variable ( Environment Risk Management) Table 4.1
PT. Astra International 0.267 0.733 0.833
PT. Holcim Indonesia 0.567 0.567 0.567
PT. Bakrie Sumatra Plantations 0.667 0.667 0.8
PT. Bank Negara Indonesia 0.233 0.3 0.267
33
Table 4.1 is the preview of the environment index of the 14 selected companies annually from 2009-2011. Environment index score 1 signify that the companies performed all
environment indicators in the company‘s sustainability report based on GRI G3. The following
table presents the descriptive statistics of environment index in 3 years: Table 4.2
Descriptive statistics for environment index
Minimum 0.133
Maximum 1
Mean 0.768262
Standard Deviation 0.297707
Kurtosis -0.59251
Skewness -0.96017
Source: processed data
The table above shows the descriptive data of the selected companies. As can be seen that in every year, there are companies scoring 1 as maximum score. The average value increases from 2009-2011 indicate that more companies perform the environment indicators. The Kurtosis and skewness value in all year are below < 2 which has the meaning that data of environment index is normal.
34 Figure 4.1
Environment Index in 2009
Source: processed data
As seen on table 4.1, The average of environment index in 2009 is 0.676. There are 7 companies which are below the average. They are PT. Adaro Energy, PT. Astra International, PT. Holcim, PT. Bakrie Sumatra Plantations, PT. Bank Negara Indonesia, PT. Perusahaan Gas Negara and PT. United tractor. The lowest score is 0.133 or 13% by PT. Perusahaan Gas Negara. The other 7 companies are PT. Antam, PT. Astra Agro Lestari, PT. Bumi resource, PT. Petrosea, PT. Bukit Asam, PT. Telkom and PT. Timah above the average value. The maximum value is 1 or 100% meaning that they reveal all of the environment indicators.
0 0.2 0.4 0.6 0.8 1 1.2
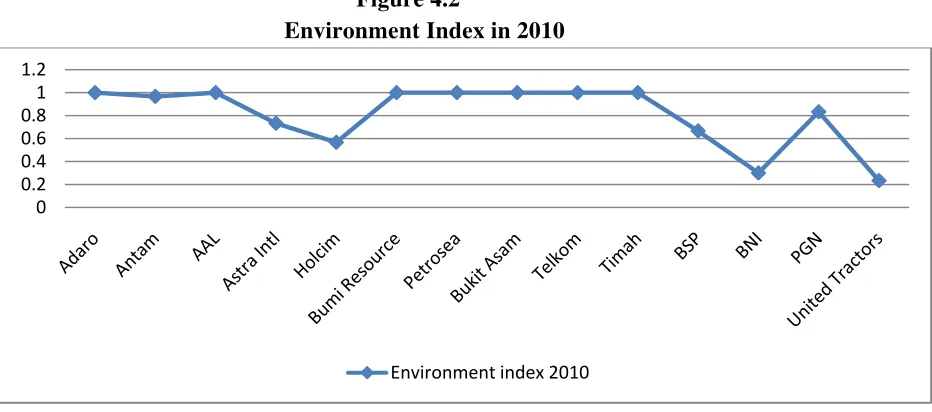
35 Figure 4.2
Environment Index in 2010
Source: processed data
The average value of environment index in 2010 is 0.807. The average value in 2010 is larger than 2009. The number of companies that performed all environment indicator in the sustainability report also increase becoming 7 companies. There are 5 companies with value below the average value. PT. United Tractor has the lowest value of 0.233 or 23%. The remaining 9 companies have value above the mean. PT. Antam has the value 0.967 or 96% with missing 1 from the 30 environment indicator and PT. Perusahaan Gas Negara have not conduct 5 out of 30 environment indicators.
0 0.2 0.4 0.6 0.8 1 1.2
36
Figure 4.3
Environment Index in 2011
Source: processed data
The average of Environment Index in 2011 is the highest than the other average value in the last two previous years. With the average value of 0.82 or 82%, the number of companies performing every environment indicator is 8 companies. PT. Holcim, PT. Bakrie Sumatra Plantations, PT. Bank Negara Indonesia, PT. Perusahaan Gas Negara, and PT. United Tractors. PT. United Tractors is consistent with value of 0.233 or 23% and become the lowest value among the other companies with value.
From 2009-2011, the figure shows that the number companies that have done all environment performance is increasing and it indicates an increase in the 14 selected company‘s environment risk management
0 0.2 0.4 0.6 0.8 1 1.2
37 b. Dependent Variable
The dependent variable in this research consists of cost of equity(COE), cost of debt(COD), and cost of capital(WACC).
1. Cost of equity
The following table shows the cost of equity ratio from 2009-2011. Table 4.3
Cost of Equity Ratio 2009-2011
Name of Company COE 2009 COE 2010 COE 2011
PT.Adaro Energy 6.6728 4.378937 -1.29433
PT. Antam
6.161303 1.583543 -0.68651
PT. Astra Agro Lestari 6.949012 4.980465 -0.0512
PT. Astra International 5.725663 1.566888 0.144076
PT. Holcim Indonesia 5.938021 3.75417 -0.01915
PT. Bumi Resources 4.832035 2.699358 -2.87698
PT. Petrosea 9.850063 3.978115 1.768514
PT. Bukit Asam 6.070888 2.984112 -0.62156
PT. Telkom Indonesia 6.646029 4.48573 3.440077
PT. Timah 5.85624 -0.48406 0.195002
PT. Bakrie Sumatra Plantations 5.071009 1.204888 -1.45309
PT. Bank Negara Indonesia 4.952185 4.128326 -1.33749
PT. Perusahaan Gas Negara 6.163609 5.569604 -0.32976
PT. United Tractors 5.803819 4.076227 -0.54708
Minimum 4.832035 -0.48406 -2.87698
Maximum 9.850063 5.569604 3.440077
Mean 6.192334 3.207593 -0.26211
Source: processed data
38
As seen in table 4.2, there are various numbers of COE ratio from 2009-2011. From 2009-2011, the value decrease indicates that the 14 companies performed well in minimalizing the cost of equity. The following table presents the descriptive statistics of cost of equity ratio:
Table 4.4
Descriptive statistics of cost of equity ratio
Minimum -2.87698 Kurtosis and Skweness value, it can be seen that the COE data in the 3 year period is normal. The graphic of the COE ratio of the selected companies are presented as follow
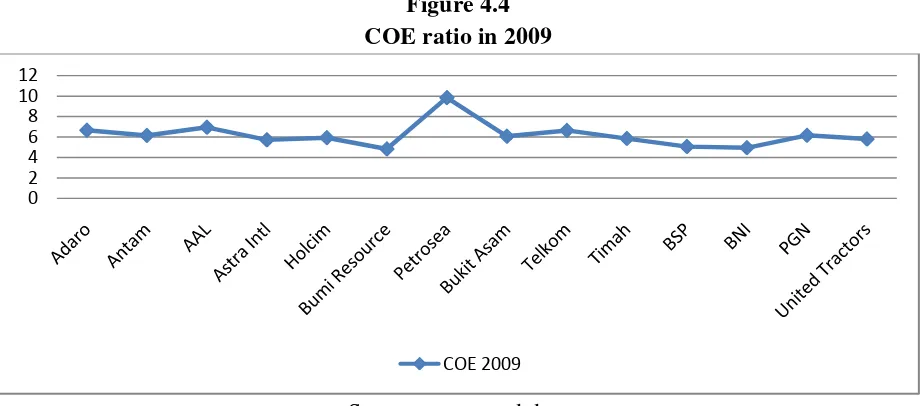
Figure 4.4 COE ratio in 2009
Source: processed data
The average value of COE in 2009 is 6.19%(table 4.2). PT. Adaro, PT. Astra Agro Lestari, PT. Petrosea and PT. Telkom has value above the mean with PT. Petrosea as the highest
39
value of 9.85%. The other 10 companies COE ratio are below the average and PT. Bumi resources is the lowest value of 4.83%.
Figure 4.5 COE Ratio in 2010
Source: processed data
In 2010, the average value of COE decrease to the level of 3.21% (table 4.2). As seen on figure 4.5, there are 8 companies with value higher than in average value and 6 companies below the mean. The highest value in 2010 belongs to PT. Perusahaan Gas Negara with 5.57% and the lowest value among the 14 companies is PT. Timah with -0.48%.
40
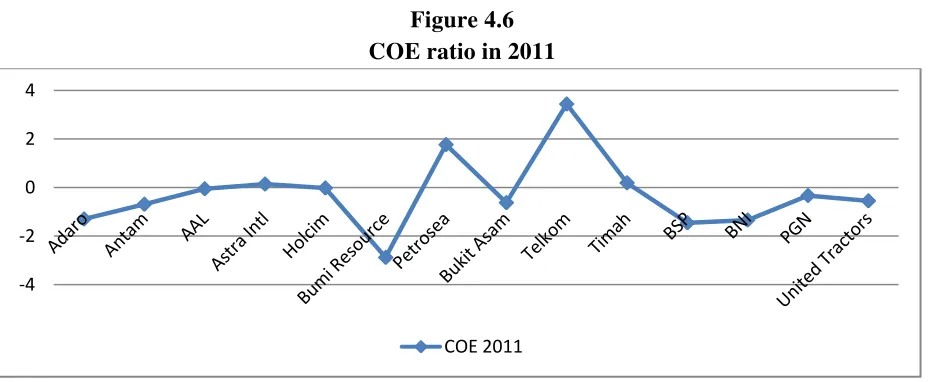
The average value of the selected companies decrease in the time frame of 3 years from 2009-2011(as seen in table 4.2). The average COE in 2011 is -0.02% the lowest among the previous 2 years. It can also be seen on figure 4.6 that the COE ratio of all companies rapidly decreases. Most companies have a negative value. This happens because the return market in 2011 is lower that the risk free. As explained in the previous chapter, in the formula of COE, return market(rm) needs to be minus by risk free(rf). This case generates a minus score of COE.
There are 4 companies with the COE ratio above the average while the remaining 10 were below the average. The maximum value is 3.44% by PT. Telkom Indonesia and minimum is -2.87% by PT. Bumi Resources.
2. Cost of debt
The second dependent variable in this research is the cost of debt (COD). The following table shows the equity ratio:
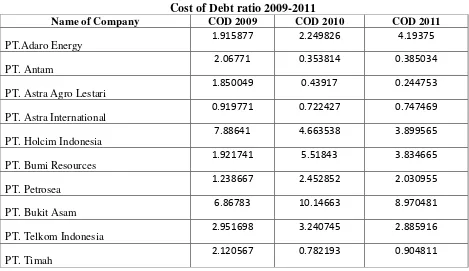
Table 4.5
Cost of Debt ratio 2009-2011
Name of Company COD 2009 COD 2010 COD 2011
PT.Adaro Energy
1.915877 2.249826 4.19375
PT. Antam
2.06771 0.353814 0.385034
PT. Astra Agro Lestari
1.850049 0.43917 0.244753
PT. Astra International
0.919771 0.722427 0.747469
PT. Holcim Indonesia
7.88641 4.663538 3.899565
PT. Bumi Resources
1.921741 5.51843 3.834665
PT. Petrosea
1.238667 2.452852 2.030955
PT. Bukit Asam
6.86783 10.14663 8.970481
PT. Telkom Indonesia
2.951698 3.240745 2.885916
PT. Timah
41
Name of Company COD 2009 COD 2010 COD 2011
PT. Bank Negara Indonesia
2.874778 2.471034 2.233871
PT. Perusahaan Gas Negara
2.739946 1.753738 1.413748
PT. United Tractors
1.274831 1.171521 1.071151
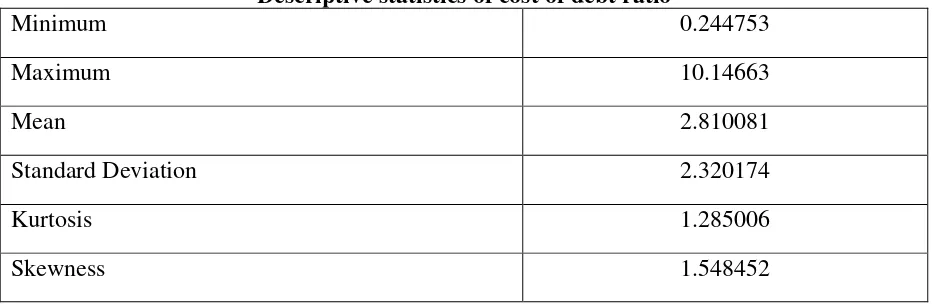
Minimum 0.919771 0.353814 0.244753
Maximum 7.88641 10.14663 8.970481
Mean 3.01096 2.788565 2.630718
Source: processed data
Note: COE ratio served in percentage
In table 4.3, the average cost of debt incurred by the selected 14 companies decrease from 2009-2011. It is a good performance and minimalizing costs is what companies expected to occur. The following table presents the descriptive statistics of cost of debt ratio:
Table 4.6
Descriptive statistics of cost of debt ratio
42
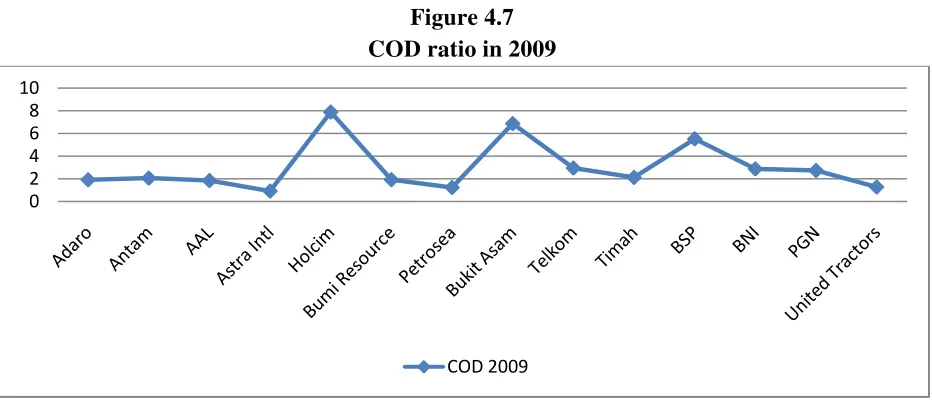
The graphic of the COD of the 14 companies are presented as follow: Figure 4.7
COD ratio in 2009
Source: processed data
The average value of cost of debt in 2009 is 3%. The three peaks as seen on figure 4.7 belongs to PT. Holcim with 7.88%, PT. Bukit Asam with 6.87% and PT. Bakrie Sumatra Plantations with 5.52%. PT. Holcim‘s value is the maximum. The other 11 companies have this value below the average value. They are PT. Adaro 1.91%, PT.Antam 2.07%, PT. Astra Agro Lestari 1.85%, PT. Astra International 0.92%, PT. Bumi Resources 1.92%, PT. Petrosea 1.24%, PT. Telkom 2.95%, PT. Timah 2.12%, PT. Bank Negara Indonesia 2.87%, PT. Perusahaan Gas Negara 2.74% and PT. United Tractors 1.27%. PT. Astra International is set for having the lowest cost of debt in 2009.
0 2 4 6 8 10
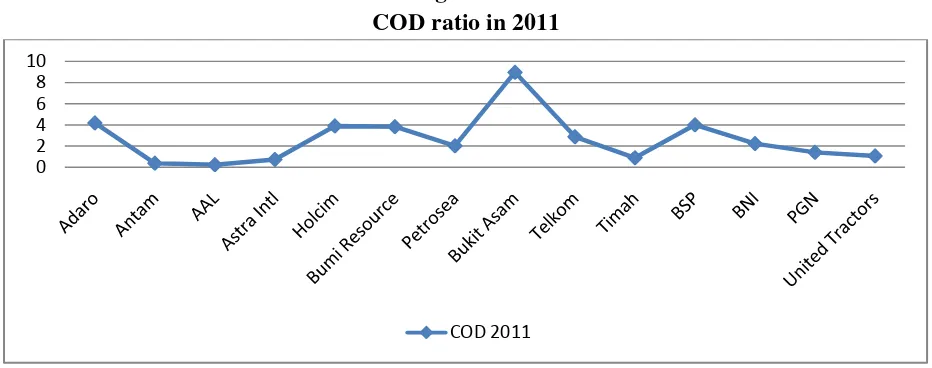
43 Figure 4.8 COD ratio in 2010
Source: processed data
In 2010, the mean is 2.79%, lower than in 2009. PT Holcim, PT. Bumi resource, PT. Bukit Asam, PT. Telkom, and PT. Bakrie Sumatra Plantations has value above the average. PT. Bukit Asam has the highest value of 10.15%. The other 9 companies are below the average value and PT. Antam has the least cost of debt among the 14 companies with value of 0.35%.
Figure 4.9 COD ratio in 2011
Source: processed data
44
Besides PT. Bukit Asam, PT. Antam 4.19%, PT. Holcim 3.89%, PT. Bumi Resources 3.83%, PT. Telkom 2.88%, and PT. Bakrie Plantations 4.01% are the companies having COD value above the mean. The minimum value of COD in 2011 shows PT. Astra Agro Lestari which has a value of 0.24%
3. Cost of Capital (WACC)
The third dependent variable is the overall cost of capital (WACC). The following table shows the WACC ratio:
Table 4.7
WACC Ratio 2009-2011
Name of Company WACC 2009 WACC 2010 WACC 2011
PT.Adaro Energy
3.882407 3.226812 1.979165
PT. Antam
5.441370 1.312849 -0.37429
PT. Astra Agro Lestari
6.178057 4.291124 0.000372
PT. Astra International
3.564060 1.161447 0.449398
PT. Holcim Indonesia
7.002154 4.068808 1.20588
PT. Bumi Resources
2.308872 4.990902 2.763075
PT. Petrosea
7.322246 3.280048 1.920196
PT. Bukit Asam
6.297063 4.857493 2.164337
PT. Telkom Indonesia
4.819720 3.944812 3.213834
PT. Timah
4.759658 -0.12276 0.40806
PT. Bakrie Sumatra Plantations
5.285258 2.210546 1.366218
PT. Bank Negara Indonesia
3.049871 2.692042 1.781949
PT. Perusahaan Gas Negara
4.265800 3.549557 0.446509
PT. United Tractors
3.863838 2.752474 0.112759
45
Maximum 7.322246 4.990902 3.213834
Mean 4.860027 3.015439 1.245533
Source: processed data
Note: WACC ratio served in percentage
In Table 4.4, the average WACC decrease from 2009-2011. This output is in line with the trend of average score of COE and COD. The following table presents the descriptive statistics of WACC ratio:
Table 4.8
Descriptive statistics of WACC ratio
Minimum -0.37429
Maximum 7.322247
Mean 3.040333
Standard Deviation 2.001626
Kurtosis -0.62428
Skewness 0.17821
Source: processed data
46
The graphic of WACC ratio of the selected companies are presented as follow Figure 4.10
WACC ratio in 2009
As can be seen in figure 4.10, the average value of WACC in 2009 is 4.86%. PT. Antam , PT. Astra Agro Lestari, PT. Holcim, PT. Petrosea, PT. Bukit Asam and PT. Bakrie Sumatra Plantations are the companies score above the average. 7.32% is the maximum score by PT. Petrosea. While PT. Adaro , Astra International, PT. Bumi Resources, PT. Telkom, PT. Timah, PT. Bank Negara Indonesia, PT. Perusahaan Gas Negara, and PT. United Tractors are below the average value. 2.3% by PT. Bumi Resources is the minimum WACC value in 2009.
47
48 2. Normality Test
a) Normality Test for Cost of Equity
Normality test can be done with the analysis chart. Based on Figure 4.13 shows that the histogram graph display can be concluded that the histogram graph gives a normal distribution pattern. While the normal graph plots shown in Figure 4.14 shows that the points spread around the diagonal line, and follow the direction of the line diagonal spread. This suggests that the residual values are normally distributed.
Figure 4.13 Histogram Graphic
49 Figure 4.14
Normal Probability Plot Graphic
Source : processed data
The result of graphic analysis above could raise doubts as more subjective in its decision-making. To strengthen the analysis of the graphic above, the statistical analysis used the Kolmogorov-Smirnov Z. The results of the Kolmogorov-Smirnov Z can be seen in table 4.5.
Table 4.9
Normal Parametersa,b Mean 0E-7
Std. Deviation .03121840
Asymp. Sig. (2-tailed) .582
a. Test distribution is Normal.
b. Calculated from data.
50
Based on the above table shows that the value asymptonic significance of 0.582. Because asymptonic significance value greater than 0.05, it can be concluded that the model has a
residual value of normal distribution.
b) Normality Test for Cost of Debt
Normality test for COD conducted with histogram graphic analysis can be seen in figure 4.15. Based on the histogram display, it can be concluded that the histogram graph gives a normal distribution pattern. Test for normality using normal graphics plot can be seen in Figure 4.16. Based on the images can be seen that the points spread around the diagonal line, and its distribution following the direction of the diagonal line. This shows that the model has a residual value of normal distribution.
Figure 4.15 Histogram Graphic
51 Figure 4.16 Normal Probability Plot
Source : processed data
Normality test results using the above graph analysis supported by statistical analysis using the
Kolmogorov-Smirnov test Z. The results of the Kolmogorov-Smirnov Z of COD can be seen in table 4.6
below.
Normal Parametersa,b Mean 0E-7
Std. Deviation .04466766
Asymp. Sig. (2-tailed) .095
a. Test distribution is Normal.
b. Calculated from data. Source: processed data
52
Based on the table above shows that the value asymptonic significance of 0.095. Because asymptonic significance value greater than 0.05, it can be concluded that the model has a residual value of normal distribution.
c) Normality test for WACC
Normality test model for WACC has the same result with the two previous models. Normality test with histogram graph analysis can be seen in Figure 4.17. Based on the histogram display can be concluded that the histogram graph has a normal distribution. While the test for normality using normal graphics plot can be seen in Figure 4.18. Based on the graph shows that the points spread around the diagonal line, and its distribution following the direction of the diagonal line. This shows that the model has a residual value of normal distribution.
Figure 4.17 Histogram Graphic
53 Figure 4.18 Normal Probability Plot
Source : Processed data
Normality test results using graph analysis is supported by the normality test using the statistical analysis of the Kolmogorov-Smirnov Z. While the results of the Kolmogorov-Smirnov Z can be seen in table 4.7 below.
Table 4.11
Result Kolmogorov Smirnov Z test
One-Sample Kolmogorov-Smirnov Test
Unstandardized
Residual
N 42
Normal Parametersa,b Mean 0E-7
Std. Deviation .04446278
Asymp. Sig. (2-tailed) .155
a. Test distribution is Normal. b. Calculated from data. Source: processed data