Real-Time Solution Quality Control System
Based on Photonic Crystal Sensor
1M. Rahmat, 2H.Alatas, 3H. Mayditia, 4A.S. Yuwono, 5F. Rinaldi, 6K.B. Seminar
Email : [email protected], [email protected], [email protected], 4[email protected], 5[email protected] , 6[email protected]
1Agricultural Engineering Study Program, Graduate School, Bogor Agricultural University
Darmaga Bogor 16880, Indonesia
2Theoretical Physics Division, Department of Physics, Bogor Agricultural University Darmaga
Bogor 16880, Indonesia
3Graduate School of Electrical Engineering University of Indonesia Depok -IndonesiaGraduate
School of Electrical Engineering University of Indonesia
4Civil and Environment Eng. Department, Bogor Agricultural University, Bogor,Indonesia 5Department of Physics,Bogor Agricultural University, Darmaga Bogor 16880, Indonesia 6Ergonomics and Electronics Lab,Bogor Agricultural University, Bogor 16880, Indonesia
ABSTRACT
We consider the previous successful fabrication of a prototype of photonic crystal (PC) sensor by means of electron beam evaporation equipment in a sample chamber at pressure of 10-3 Pa with BK-7 glass substrate at temperature 573 K. In this study we use the sensor to detect the concentration of liquid product that flows in continuous production system as a quality control system. The optical sensor measures the change of light intensity at photo detector which is correlated to the concentration of solution. The change of solution refractive index is converted into digital electrical signals using electronic circuits. The result shows the capability of the corresponding sensor to be used as a real-time mode quality measurement system in agroindustry with liquid form product.
Keywords : photonic crystal, sensor, realtime, liquid
Introduction
Sensor applications of photonic crystals (PC) have drawn much attention because of high sensitivity and suitability for μ-TAS(Total Analysis System)s with a great capability of PCs for Refractive-Index-Sensor(Index-Sensor) and Bio- Sensor applications. PC are periodic dielectric structures which can prohibit light propagation over a continuous range of frequencies, irrespective of the direction of propagation.The possibility of achieving photon localization and photonic band gaps (PBG) has been a driving force behind the synthesis of these
microstructures. This, in turn, has provided a compelling starting point for research of both fundamental and technological importance. [1]. PC biosensors represent a new class of label-free optical biosensors that are capable of detecting biomolecules and cells with high resolution.[2]
the basic physical mechanism responsible for that purpose. Specifically, the one dimensional (1D) PC in the form of stack optical grating system, which is actually the simplest structure of PC, have also demonstrated can be applied for many practical application such as optical filter as well as sensor. In the previous study, it has been shown that the introduction of material or structural defects could lead to the creation of the so called photonic pass band (PPB) that allows the existence of states inside the PBG of the corresponding 1-D PC which is in the structure without defect forbids light to propagate. [3]
The previous theoretical study have shown that for the case of 1-D PC with two defects, the peak tranmittance of PPB can be varied with respect to the refractive index change of one of the defects. This feature can then be used for new sensing platform [1]. Physically, coupling between the two defect is responsible for this interesting characteristics. Recently, we have succeded in fabricating this structure by means of electron beam evaporation method and the result showed a good agreement with theoretical prediction. And we showed our previous experiment on making the optical sensor device based on of this 1-D PC along with the instrumentation system. By measuring the concentration of sugar in sugar solution, the device have shown its potential application as optical sensor. In this paper, we report a progress research to develop a real time measurement system to control solution quality in a continuous production system.
Theoretical Backgrounds
A. One-Dimensional Photonic Crystal with Two Defects Configuration
The early step of this work was done by simulating the corresponding structure by means of the well known transfer matrix method (TMM). The structure considered, illustrated in Fig. 1, consists of two defect sandwiched by three regular grating with cell number M, N, L satisfying the condition N = M + L. In the design considered we choose first defect made from high index material with its thickness twice the regular hig index layer, while the second defect is left empty and to be filled with the sample solution.
B. Experiment Information
Analysis was conducted to study the relationship between the light intensity displayed in the photo detector (V) display versus the sugar solution concentration (g/L). The result is in very good agreement with the data from simulation and sensing test during the early step of the testing process so that the results can be regarded as consistent. The measurement curve in Fig. 2 shows that the photonic crystal sensing test result that is designed with a configuration of 462. For this configuration, the sensitivity of PC is 8.2 mV/(g/L) with a determination coefficient of 98.50% within the 100 - 500 g/L. [4]
Fig. 2. Plot of Intensity light (V) vs concentration of sugar solution (g/L) for
photonic configuration of 462 .
Design of the Device A. Sensing Mechanism
For a sensor application, the photonic crystals can be optimized in order to produce a narrow resonance mode with a very sensitive response with respect to the modulation induced by the deposition of material on the biochemical defect layer. The sensor consists of a transparent material that has a periodic layered structure that coated by thin low and high refractive
index materials. Solution flow is through the photonic crystal as second defect layer that show in Fig 3.
Fig. 3. Illustration of sensing mechanism of photonic crystal sensor
The intensity of light coming from the light source through a photonic crystal system is then received by the photo-detector that translate the change of intensity into
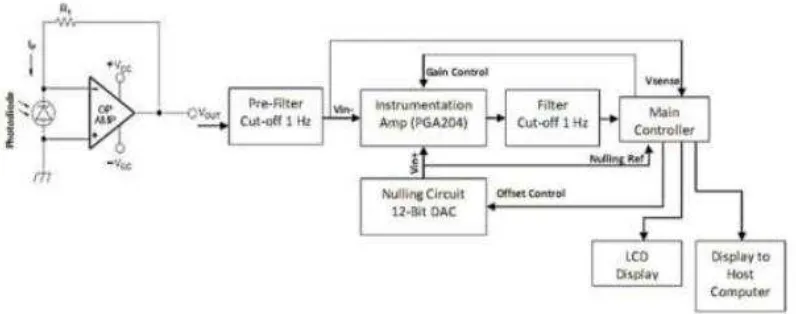
electric signal. The resulted electric signal is further amplified by the electronic circuits before the measurements are taken using a LCD and Graphic User Interface (GUI). The results of voltage measurements are related to the change of the refractive index of the material defects. It is found that refrative index of solution is in line with its concentration. Therefore the concentration of solution can be measured precisely by in situ and real time mode. We can see the design in Fig. 4. Signal processor is built by using micro controller ATMEGA 16, Instrumentation Amplifier PGA204, Nulling Circuit 12-Bit DAC as we can see in Fig. 5. And Graphic Use Interface is developed by using Visual Basic Programing.
Fig. 4. Design of PC sensor for real time quality control measurement system
Fig 5. Illustration of signal processor for detecting the concentration of solution
B. Component Selection
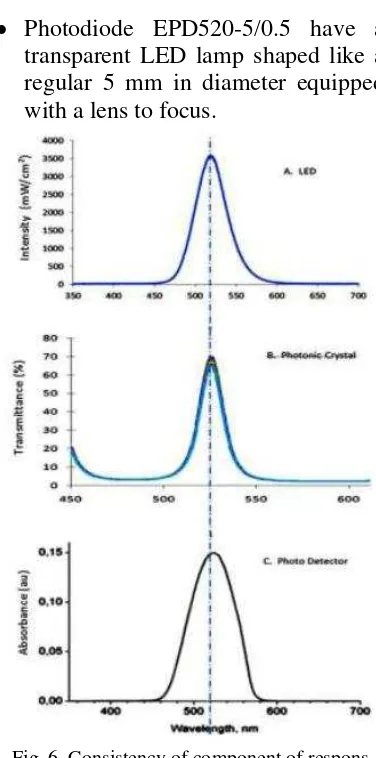
In Fig. 6B, we can see that from the results of the characterization of photonic crystals used have a passband with a sensitivity peak at 525 nm, with a wide band-gap band at 500 nm wavelength intervals up to 550 nm. Based on the results of previous research, the value of the transmittance of the pass band is very dependent on the refractive index of the material that fills the second defect layer, in this case is the solution flow.
Photo detector system is used as a transducer to detect changes in the intensity of the transmitted passband by photonic crystals, when there is a change in refractive index in the solution flow. From the photo detector so that the criteria should be used to obtain good measurement results and the high sensitivity of the index of refraction solution flow is through a narrow selection of the measurement bandwidth (narrow bandwidth) with a frequency equal or close to the top of the peak sensitivity of the passband. In addition, proper selection of photo detector can avoid the measurement of the influence of optical noise. Therefore :
Light source, we have to use green LED with light spectra between 450
nm and 600 with peak of spectra at 525 nm.
Photo detector that used is a selective photodiode for the green wavelength interval with a peak sensitivity at 525 nm, as shown in Fig 6C. From the profile of this photo diode measurements, can be seen that the transducer is very appropriate for use with photonic crystals because of it have a peak sensitivity at 525 nm, the same or close to the peak wavelength of the pass band.
Having a measurement range of the wavelength of the narrow (narrow), with a FWHM of 490 sd 560 nm. The value of this interval was in the band gap, so it can certainly bring photo diode will only measuring pass band transmitted by photonic crystals.
Photodiode EPD520-5/0.5 have a transparent LED lamp shaped like a regular 5 mm in diameter equipped with a lens to focus.
Fig. 6. Consistency of component of respons spectra. A. LED’s light spectra, B. PC
transmittance spectra and C.
Photo Detector’s respons spectra. All of them
have peakof spectra at 525+ 5 nm.
Experiment
A.Photonic Crystal Fabrication
During the fabrication process, the 1-D PC is deposited on a BK-7 glass substrate with a refractive index 1.52 by means of electron beam evaporation with preasurre of 10-3 Pa dan temperature of 573 K. This method generates the electron beam using filament with electric current generated from JEOL JST-10F EB Power Supply dan controlled by the JEOL CONTROLLER, whereas the vacuum condition is controlled by Vacuum Gauge Controller INFICON VGC 403
dan Vacuum Chamber Controller INFICON VCC 500. On the other hand, the optical thickness is controlled by HOM2-P Lamp Power Supply and HOM2-D1 Data Processor for High Precision Optical Monitor, while for the physical thickness and the deposition speed we used crystalic sensor of INFICON XTC/35 Deposition Controller.
This process was carried out by using electron beam evaporation method in the Optorun Gener - 1300 machine. The pressure of the vacuum room = 1.0x10⁻³ Pa and the temperature = 300 oC (573 K).
Furthermore, the coating process was performed in two steps. First, coating 14 layers from layer-1 until layer-14 before the second defect. In this first process, the first defect in layer-5 was already included. This process was implemented in substrate-1 that was in the form of glass BK-7 (refractive index = 1.52). Second, coating 5 layers from layer-20 until layer-16, meanwhile layer-15 was emptied to place the sugar solution that will be further analyzed. This process was implemented in substrate-2 that was also in form of glass BK-7 (refractive index = 1.52).
The resulting fabricated 1-D PC is in the form of a circular disk with a diameter of 10 mm. The device is constructed by setting a light source above the photonic crystal system and the photo detector below, so that light will pass through the photonic crystal before received by the photo detector. Sugar solution is inserted with a spacer interval of l - 2 mm which allow easy and continuous flow.
B. Optical Characterization and Sensing Test
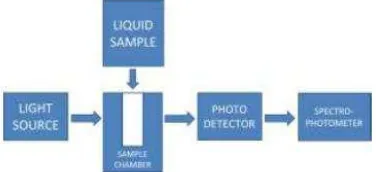
Optical characterization and sensing performance is performed on the photonic crystal from the fabrication process before manufactured in the form of optical sensor device using a spacer with interval of 2 mm for sugar solution filling inside the photonic crystal system. Measurement is conducted using the Ocean Optics Spectrophotometer UV Vis USB 2000. The sugar cane solution that is prepared for the characterization are content pure sugar that assume as 100% sugar content, then diluted by distillated water up 30% of sugar content . The schematic of optical characterization and sensing test for the photonic crystal is presented in Fig. 7.
Fig. 7. Schematic of optical characterisation and sensing test for the photonic crystal sensor
Measurement result shows that a photonic pass band inside the photonic band gap occur very similar with the theoretical calculations with an operation length that is also inagreement with numerical study (Fig. 7). If the transmittance peak is plotted on the sugar solution concentration, an approximate linier curve is obtained.
C. Calibration Techniques
This PC sensor system can be used to determine the type and concentration of material, such as fluid (liquid or gas) in certain circumstances. The variation of refractive index of a
material depends on the density of fluid (congestion) in materials and environmental conditions of temperature, so as to know the concentration of a substance in the environment accurately, need to do the calibration. In photonic crystals sensor system version 1 (no idea his name type: OI-001) was used in-situ method of calibration, ie calibration process carried out at the time and place of measurement will be done. In this method requires at least three measuring point as the reference value. Stages percent for three-point calibration measurements which will be used at the time of measurement in place are as follows:
a. Air. By allowing the probe sensor OI-001 in the air for some time and do the sampling (note: make sure there is no any inhibitory cavity probes). These reference values are stored as refractive index of air (n = 1) b. Distilled water. By allowing the
probe sensor OI-001 in distilled water for some time and do the sampling (note: make sure the probe cavity completely filled with air). This reference value is stored as an index of refraction of water (n = 1:33) or the value of 0% solution concentration c. Solution of known
device is switched off or the next calibration is performed.
With this calibration technique, the influence of the environment, especially ambient temperature measurement device can be resolved. Addition can also reduce the
measured degradation caused by the formation of the dirt (crust) on the surface of the glass in the cavity probe (maintenance / routine cleaning is required).
D. Measurement Techniques
After calibration is completed, real-time measurements can be done via the LCD display and the software Graphical User Interface (GUI) that has been provided.
a. Through the LCD Display. By using the keypad and follow the instructions listed in the LCD, users can perform continuous measurements (every 1 second) or one-time measurements (single measurement)
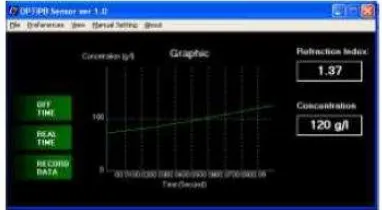
b. Through the GUI software using a PC. Users can monitor the value of real-time measurement and see the dynamic changes using graphics rendered display as shown Fig. 8.
Fig. 8. Graphic User Interface (GUI) that developed using Visual Basic Programing to
display the measurement result
Result and Discussion
To test the performance of these devices we are doing measurements on fresh sugar cane with the assumption that the value of initial sugar content is considered 100%, then diluted gradually to 30% by adding distilled water up to the value of the expected concentration. This sugar concentration is then measured simultaneously using two measuring devices: (1) a spectrophotometer Ocean Optics USB 2000 and (2) a set of photonic crystal sensors. Output measurements are recorded in % absorbance spectrophotometer, whereas the measured with sensors in photonic crystal refractive index. The results of this measurement as a comparison of photonic crystal sensor performance compared with the spectroscopy measurements. The results we can see in Fig. 9 and Fig. 10.
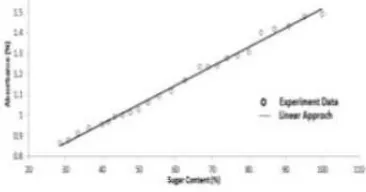
In Fig. 9. We can see a fairly linear curve of absorbance against the concentration of sugar solution or sugar content canes. With the approach of the linear curve obtained
determination coefficient of 99.25%.
Fig. 9. Correlation of absorbance against the concentration of cane sugar content measured
using a spectrophotometer.
The measurement results with the photonic crystal is a bit different, the results of the approach with a linear curve only reaches the coefficient of determination equal to 97.56%, but if done with the approach of the logarithmic equation obtained coefficient of determination up to
99.89%. This result is actually more consistent logarithmic if associated with previous theoretical results. [5].
Thus, in measuring the linear curve would approach a logarithmic curve can be used as a calibration curve which is inputted in the data processing of micro controller ATMEGA 16 to convert the measurement of refractive index to concentration such as g / L.
Fig 10. Correlation of refractive index to changes in cane sugar solution concentration measurements with photonic crystal sensors.
After the calibration curve is put in the micro controller, then we can conduct simulations to measure the solution quality in real time mode. Figure 11 displays changes in concentrations of 80 g / L to 120 g / L with the addition of concentration gradually.
Fig. 11. Measurement result of the oncentration of sugar solution by adding concentration slowly with a more concentrated solution.
Furthermore, it is simulated with the database to be read by the GUI if there are significant changes in depicting the true conditions in case of a production process, then the fluctuations in concentration can be seen as depicted in Fig. 12. which shows simulated concentration changes in the measurement process in real time (in this case do capture data every one second).
The simulation results give a illustration of production in the process of continuously flowing solution, then this measurement system can be utilized for the development of automatic Statistical Process Control (SPC), and the measurement data can be stored in the database with the timeframe can be determined and adjusted to the current processes and quality policies is applied.
Conlusion monitored in real-time, thus increasing the efficiency of production system.
Future work
This research focuses on instrumentation design and fabrication by using a computerized controllable instrument will be developed for more practical use. In the future work, we will use online network technology to control and share data to all stake holder that related to the production system Refering to the experimental results and sugar content measurement, the potential application of the invented sensor system can be specifically directed to support a precision monitoring and control for agroproduct processing such as sugar production, canned fruit production, and bottled tea production. And it will be very beneficial for beverage and agro-industry applications at large.
Acknowledgment
This research has been supported
by “Penelitian Unggulan IPB” Grant
under contract No. 8/I3.24.4/SPK/BG-PSN/2009.
References
Alatas, H. et al. 2006. Single frequency refractive index sensing based on finite one-dimensional photonic crystal with two defect, Jpn J. of Appl. Phys. 45, 8B 6754.
Björn Maes, Peter Bienstman, and Roel Baets. 2005. Bloch modes and self-localized waveguides in nonlinear photonic crystals. J. Opt. Soc. Am. B. 22 3.
Charles J. Choi and Brian T. Cunningham. 2007. A 96-well microplate incorporating a replica molded microfluidic networkintegrated with photonic crystal biosensors for high throughput kinetic biomolecular interaction analysis. Lab Chip, 7, 550–556.
Deych, L.I. 2005. One-dimensional photonic crystalsbased on periodic multiple quantum well structures. Phys. stat. sol. C 2, 2 805.
Hasek, T. 2006. Photonic crystals for fluid sensing in the subterahertz range. American Institute of Physics. Appl. Phys. Lett. 89 173508.
Kim et al. 2002. Quality factors in single-defect photonic-crystal lasers with asymmetric cladding layers. J. Opt. Soc. Am. B 19 8. Loncar, M. etal. 2004. Planar photonic
crystal nanolsers (I) : Porous cavity lasers. IEIECE Trans. Elect, E87-C 3.
Lucia Florescu, et al. 2004. Theory of a one-atom laser in a photonic band-gap microchip. Physical Review A 69, 013816. The American Physical Society.
Mingaleev, Sergei F. 2004. Tunable photonic crystal circuits: concepts and designs based on single-pore infiltration . Opt. Lett. 29 24. Nakagawa, Wataru. et.al. 2002.
Wide-field-of-view narrow-band spectral filters based on photonic crystal nanocavities. Opt. Lett. 27 3.
Nasilowski, Tomazs. 2006. Metrological application of
photonic crystal fibres. Proceedings of the Symposium on Photonics Technologies for 7th Framework Program Wroclaw. Belgium.
Özbay, E. and B. Temelkuran. 1996. Reflection properties and defect formation in photonic crystals. Appl. Phys. Lett., 69 6.
Özbay, E. etal. 2004. Physics and applications of photonic crystals. Photonics and Nanostructures – Fundamentals and Applications 2 (2004) 87–95.
Painter, Oskar and Kartik Srinivasan.2002. Polarization properties of dipolelike defect modes in photonic crystal nanocavities .Optical Society of America Opt. Lett.27 5
Rahmat M. etal. 2009. Real-Time Optical Sensor Based on One-Dimensional Photonic Crystals with Defects. ICICI-BME.2009.5417268.