i
THE DEVELOPMENT OF 3D VISUALIZATION AND WIRELESS NETWORK
MUHAMMAD ‘AMMAR BIN AKOP
This Report Is Submitted In Partial Fulfillment of Requirements for the Bachelor Degree of Electronic Engineering (Telecommunication)
Fakulti Kejuruteraan Elektronik dan Kejuruteraan Komputer Universiti Teknikal Malaysia Melaka
v
“
FOR MY PARENTS AND FAMILYAND FOR THE PERSON
WHO ALWAYS STAND BY ME
NO MATTER HOW HARD THE LIFE IS
vi
ACKNOWLEDGEMENT
Praised be to Allah for his blessings and giving me the strength along the challenging journey to completing the project as well as this thesis writing, for without it, I would not have been able to come this far.
First and foremost, I would like to express my sincere gratitude to my supervisor, Mr Hamzah Asyrani Bin Sulaiman for the continuous support for my PSM, for his patience, motivation, enthusiasm, and immense knowledge. His guidance helped me in all the time of research, developing and writing of this thesis.
vii
ABSTRACT
viii
ABSTRAK
ix
1.6 Significance of the Study
1
2.3 Potential Uses of Platform
x
2.5 Computer Visualization
2.6 Wireless Network Visualization
2.7 HCI Design Factor for Computer
Visualization
4.2 The Upgraded 3D Visualization of Wireless
Network
4.3 Analysis of the Simulation
xi
LIST OF FIGURES
FIGURE NO.
TITLE PAGES
2.1 Screenshot form demo of Unreal 3 3D graphic
tool; source: Epic Games Inc.
6
2.2 3D Visualization of Urban environment by El
Hakim that could represent wireless networking in 3D environment (Sun et al., 2010).
9
2.3 2D Visualization of wireless network using Air
Magnet Software (Source: Air Magnet).
15
3.1 Flow Chart For PSM 1 19
3.2 Flow Chart of Project 22
3.3 PSM Gantt Chart 23
4.1 Environment that are created by plotted coding
using OpenGL programming
24
4.2
4.3
Texture that can be used in simulation to make a friendly user interface
Creating FKEKK environment using Autodesk 3D Max Studio 2012
24
25
4.4 Exporting Wavefront object in Autodesk 3D Max
2012
26
4.5 Setting for Wavefront object in Autodesk 3D Max
2012
26
4.6 Environment that being load into the tools 27
xii
create environment
4.8 Signal propagation coverage 28
4.9 Visualization of wireless network at FKEKK
using Visualization of Wireless Network Tools in 3D
xiii
LIST OF ABBREVIATION
LAN - Local Area Network
PC - Personal Computer
2D - Two Dimensional
3D - Three Dimensional
FPS - Frame per Second
HCI - Human Computer Interaction
LOD - Level of Detail
Wi-Fi - Wide Fidelity
Wi-LAN - Wireless Local Area Network
OpenGL - Open Graphic Library
.obj - Wavefront Object File Format
1
CHAPTER I
INTRODUCTION
1.1 Background
The process of designing the wireless system in closed-area place such as office building and shopping complex still remains the big challenge. The wireless network should be planned carefully before we can place the access point or router in that area. Nevertheless, the prediction of the propagation signal is somewhat quite hard to implement in various type of environments even though it using the same topology of wireless network planning. The eventual objective of the propagation modelling is to find the suitable and fairness of acceptable performance of based on their signal strength. Based on the 3D visualization of the propagation modelling, the simulation can simulate the effective and efficient ways of router or access point placement, and the results will give the accurate info on us to predict how many router is needed in that place. The bad design of wireless network can lead to bad signal strength to entire network and the entire network should be redesign and rebuilt in order to fit the requirement set up by the various constraints.
2
1.2 Problem Background
In general, the fundamental task of propagation modeling is to find the suitable location of router and access point carefully, so it can covered most of the area within the buildings according to user needs. The problem may exists later on after we realize the quantity of routers that needs to be installed inside or outside the building. The longerity of the router life is depend based on cost contraint. Regrettably, the problem is not always traight as it depends on various constraint of the building itself or rather the office management on construction site and equipment used. Given that there is many different parameters that always keep on changing, simplex approximation based on just finding the suitable place and numbers of router are not enough. Modern building are build by different types of materials that later on will be equiped with new office furniture which definitely bring huge impact to wireless network performance. The attenuation, refelections, multipath and other wireless network phenomena will increase the chance of using too much time just to modify the previously installed router.
3
1.3 Research Aim
This project aim is to build software that can simulate the wireless network and visualized it using OpenGL and C++ programming to monitoring the wireless network.
1.4 Research Objective
The objectives for this research study are as follows:
• To develop a real-time visualization of cognitive network coverage
prediction by using 3D graphics tools
• To perform reliability test on the visualization system by using high
performance computer.
• To make a software that can easily use by importing the environment
using third party 3D maker software
1.5 Scope of the Study
4
1.6 Significance of the Study
5
CHAPTER II
LITERATURE REVIEW
2.1 Introduction
The increasing requirement for 3D software has tremendously becoming one of the common interest among researcher to develop a 3D visualization tools in order to provide very efficient monitoring system for either individual or commercial purpose. System such as wireless networking [2], health monitoring system, and other industrial related system that provides us with stunning 3D graphics tools to visualize most objects or environments. These tools helped them to understand better of the current situation without doing much works compared to the past time. In term of efficiency, it could produce one of the alternatives solutions to specific problems.
6
well as increase texture and polygon detail. Many games featured large outdoor environments, vehicles, advanced physics and many more.
Additionally, 3D graphic tool is continue to produce a very realistic object
creation where almost all objects can be destructible based on predefine physics environments. This object can be deform, destroy, and response in physically way just like the real world behavior. This is also brought many researchers to put attention on collision detection between those object. The result of collision of the object will bring the physic response towards the object. Unreal 3 engine which is the most advanced 3D graphic tool for today market has become widely use among commercial use by various company in order to produce their own games. Their software have multiple and lot of functionality in order to create powerful virtual world with less storage requirement.
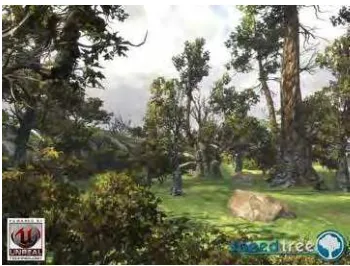
A foretaste of the look of the newest technologies is visible on the Figure 1, where the real-time rendered scene from the Unreal 3 3D graphic tool [figure 2.1] is presented.
Figure. 2.1 Screenshot form demo of Unreal 3 3D graphic tool; source: Epic Games Inc.
7
2.2 Wireless Cognitive Network
The design of wireless system for wide area coverage where it consists at least 3 main points for router placement still remains the open problems for researchers to come out with good solution in terms of performance. Prediction of signal propagation from various sources of wireless router is very essential in order to main good quality of signal strength [4]. Consider there is wireless network install in a very big building where most people will be using wireless signal to surfing to the internet. Most of the users seems does not aware that the system that they are using is sometimes quite slow compare to its true performance of wireless networking [5]. If the management of the building does not carefully planning the allocation of those visitors or users that are currently using their internet access, most router that far from user will be abandon due to users mostly probably seat at the very convenience place to surf to the internet. This increase the problem of too many users accessing one router while other routers is not been use.
8
2.3 Potential Uses of Platform
The research of 3D visualization for signal propagation is to simulate the prediction of the system in virtual environment. Prediction is always the essential task in wireless network planning. We have been divided the application of the system into several areas:
• Pre-design: The process of building a prototype where user be able to see the possible wave propagation before actual system is built;
• Radio planning: Where user is designed and implemented the system; • Optimization: Performed optimization or improvement over the
previous 3D visualization method of wireless cognitive network;
• Evaluation, Analysis of real time data where the data that is received will be investigated its efficiency and reliability.
These areas can become flexible between each other and some areas are quite hard to find the difference. With multiple functions that might have in 3D visualization tool that will be developed, user is able to use them to conduct a research and data collection. For example, user can conduct radio coverage analysis, collect real-time data of signal propagation, check the quality of signal strength within specific areas, check for service availability and compare the measurement of signal prediction. Some extra functions might be implemented in the future or as extra features such as visualization of packet loss, determine the accuracy of triangulating location, and reporting any impact of signal propagation using mobile application.
9
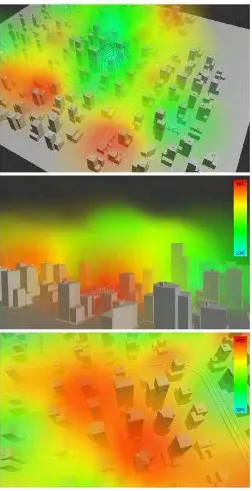
Figure. 2.2 3D Visualization of Urban environment by ElHakim that could represent
10
2.4 Human Computer Interaction
The first term of Human Computer Interaction was started almost few decades ago when it is originally founded by the B. Shackel, an American scholar in 1959. From Shackel, he introduced the very first document that explains the operational of the machine by using a panel of computer. Even though the technology seems to be limited during that time, the evolutionary of computer technology is starting to develop during the era. Later in 1960, Liklider JCK performed a study regarding the Man-Machine Interface Study where he came out with a concept of using a device that is capable to efficiently perform adequate interaction between human and computer.
Later in the early 1980s, HCI development is begin to be considered as newest researches during the era. At least six monographs have been published and the rapid development of HCI theory and practice system has emerged. Since that time, the development of HCI is continue to arise ranging from various area such as cognitive psychology, sociology as well as behavior, and in practice, the human- machine using keyboard to type on the screen for the previous version of Windows, user is able to use mouse to navigate through the screen and click on the application that has been installed on the computer. The introduction of this device has led many companies to start develop an application that capable to empower the user capability to do various important things. Three-Dimensional (3D) modeling, drawing, writing document with specific instruction, and lots more has becoming common among many computer users. Thus, the increasing demand of this software has become an opportunity to create job for people. HCI has lots of benefits from the starting point of its development.
11
2.5 Computer Visualization
The “visualization” term is commonly known as a projection of any diagrams, images, or animations using a certain medium to display on the screen. Back to few decades ago, the visualization of these projections is hardly to accomplish and scientist finding it is quite hard to do the physical experiments without getting into the risks of uncertain effects. Thus, when the computer technology has widely explored by the researchers to comprehend with the scientist researches, the growth of computer visualization has become one of important research area.
In computer visualization, all the data is visualized either in two-dimensional (2D) or three-dimensional (3D) object. For 2D object, it is consisted of at least two points that is connecting to each other and perform a line. A combination of the multiple lines is called 2D shape. 2D visualization has been acceptable among mathematician and scientist to draw graph and few others configuration. For 3D visualization, the combination of various 2D shapes in coordinate space of X, Y, and Z is called 3D object.
From the past two decades, 3D visualization played important roles in determines the successful research simulation and animation. From the animation perspectives, various animated movies already begin to use 3D visualization in order to make the movies more interesting and futuristic. For example, starting from the early 1990, Toy Story 3D animated movies have begun to shape our research interest in 3D visualization. Recently, Tron, Avatar, and 2012 films also implemented the 3D visualization in their movies just to attract the audience to watch beautifully the power of 3D visualization.