SUPERVISOR DECLARATION
“I hereby declared that I have read through this thesis entitle “Energy and Thermal Comfort Analysis for ACMV System in Academic Building” in my opinion this thesis
is sufficient in terms of scope and quality for the award of the degree of Bachelor of Mechanical Engineering (Thermal-Fluid).”
Signature : ……….
Supervisor’s Name : Dr. Tee Boon Tuan
ENERGY AND THERMAL COMFORT ANALYSIS FOR ACMV SYSTEM IN ACADEMIC BUILDING
SITI NORLINA ATASYA BINTI ABDUL RAHIM
This thesis submitted in accordance with requirement of the Universiti Teknikal Malaysia Melaka (UTeM) for the Bachelor Degree of Mechanical Engineering
(Thermal-Fluid) with Honours.
Faculty of Mechanical Engineering Universiti Teknikal Malaysia Melaka
DECLARATION
“I hereby declared that this thesis entitle “Energy and Thermal Comfort Analysis for ACMV System in Academic Building” is the result of my own work except for
summaries and quotations which have been duly acknowledged.”
Signature : ………
Author : Siti Norlina Atasya Binti Abdul Rahim
ACKNOWLEDGEMENT
ABSTRACT
ABSTRAK
TABLE OF CONTENT
CHAPTER PAGE
SUPERVISOR DECLARATION i
DECLARATION iii
DEDICATION iv
ACKNOWLEDGEMENT v
ABSTRACT vi
ABSTRAK vii
TABLE OF CONTENT viii
LIST OF TABLES xiii
LIST OF FIGURES xiv
CHAPTER PAGE
1 INTRODUCTION
1.1 BACKGROUND STUDY 1
1.2 PROBLEM STATEMENT 2
1.3 OBJECTIVES 2
1.4 SCOPES 3
2 LITERATURE REVIEW
2.1 INTRODUCTION TO THERMAL COMFORT
AND ACMV SYSTEM 4
2.2 AIR-CONDITIONING AND MECHANICAL VENTILATION 5
2.3 FACTORS AFFECTING THERMAL COMFORT 6
2.4 METHODS OF THERMAL COMFORT EVALUATION
2.4.1 Predicted Mean Vote 11
2.4.2 Predicted Percentage Dissatisfied 13
2.5 ENERGY CONSUMING AREAS FOR ACMV SYSTEM 13
2.6 METHOD AND TOOLS USED OF THE STUDY
2.6.1 Survey Occupants 15
2.6.2 Measurement of Thermal Comfort 15
2.6.3 Based on Previous Research 16
2.7 REVIEW ON PREVIOUS RESEARCH 18
3 METHODOLOGY
3.1 BUILDING BACKGROUND 20
3.2FLOWCHART 24
3.2.1 Literature review 25
3.2.2 Instrument 25
3.2.3 Analysis 26
3.2.5 Building Cooling Load 27 3.2.5.1Heat Gain through Wall and Roof 27 3.2.5.2 Heat Gain through Window 28
3.2.5.3Internal Load for People 29
3.2.5.4Heat Gain through Lights 30
3.2.5.5 Appliances 30
3 RESULT & DISCUSSION
4.1 BUILDING COOLING LOAD
4.1.1 Wall and Roof 32
4.1.2 Window 33
4.1.3 Internal Load for People 35
4.1.4 Lights 36
4.1.5 Appliances 36
4.1.6 Energy Consumption 37
4.1.7 Electricity Bill 37
4.2 ANALYSIS QUESTIONNAIRE
4.2.1 Question 1: Time Survey Conducted 40 4.2.2 Question 2: Thermal Comfort Level 41 4.2.3 Question 3: Respondents Clothing 42
4.2.5 Question 5: Thermal Discomfort Period 44
4.2.6 Discussion 45
4.3 MEASUREMENT OF THERMAL COMFORT AT FTK BUILDING
4.3.1 Air Temperature 46
4.3.2 Relative Humidity 47
4.3.3 Air Velocity 49
4.3.4 Mean Radiant Temperature 50
4.3.5 Predicted Percentage of Dissatisfied (PPD) and Predicted
Mean Vote (PMV) 51
3.3.5 Discussion 52
3.4 COST SAVING METHOD 4.4.1 Off Hours Control
4.4.1.1 Setback Controls 52
4.4.1.2 Damper Controls 53
4.4.1.3 Zone Isolation 53
5 CONCLUSION
5.1 CONCLUSION 54
5.2 RECOMMENDATION 55
REFERENCES 56
Table 1: Overall Heat Transfer Coefficient U for Glass
Table 2: Shading Coefficient for Glass without or with Interior Shading Devices Table 3: Cooling Load Factor (CLF) for Glass without Interior Shading
Electricity Bill of the Whole Area from February 2014 to January 2015 TNB Pricing & Tariff
LIST OF TABLES
Table Title Page
Table 2.1 Metabolic Rates for Typical Tasks 8
Table 2.2 Clothing Insulation Values for Typical Ensemble
10
Table 2.3 Garment Insulation 10
Table 2.4 ASHRAE Thermal Sensation Scale 12
Table 2.5 The related previous research 19 Table 3.1 Location of each facility and
management offices according to each floor
22
Table 4.1 Total Cost of Electricity in FTK Building
38
Table 4.2 Time Survey Conducted 40
Table 4.3 Thermal Comfort Level 41
Table 4.4 Type of Respondent Clothing 42
Table 4.5 Activity Level 43
LIST OF FIGURES
Figure Title Page
Figure 2.1 The HD32.1 Thermal Microclimate 15
Figure 2.2 Babuc A apparatus 17
Figure 2.3 View of Babuc A and IAQ meter 18
Figure 3.1 Faculty of Engineering Technology (FTK) building
21
Figure 3.2 Level Ground plan for FTK Building 22
Figure 3.3 Level 1 plan for FTK Building 22
Figure 3.4 Level 2 plan for FTK Building 23
Figure 3.5 The flow chart of the overall project 24
Figure 3.6 Thermal Microclimate measurement at FTK Building
26
Figure 4.1 Electricity Bill of the Whole Area Tabulated from February 2014 to
January 2015
Figure 4.2 Location of Lobby 1 and Lobby 2 39
Figure 4.3 Location of Classroom 39
Figure 4.4 Time Survey Conducted 40
Figure 4.5 Thermal Comfort Level in The Building
41
Figure 4.6 Respondent Clothing 42
Figure 4.7 Activity Level among the Respondent 43
Figure 4.8 Thermal Discomfort Period 44
Figure 4.9(a) Air Temperature (with presence of occupants)
46
Figure 4.9(b) Air Temperature (without presence of occupants)
47
Figure 4.10(a) Relative Humidity (with presence of occupants)
48
Figure 4.10(b) Relative Humidity (without presence of occupants)
48
Figure 4.11(a) Air Velocity (with presence of occupants)
49
Figure 4.11(b) Air Velocity (without presence of occupants)
49
Figure 4.12(a) Mean Radiant Temperature (with presence of occupants)
50
Figure 4.12(b): Mean Radiant Temperature (without presence of occupants)
ABBREVIATION
ACMV Air Conditioning and Mechanical Ventilation UTeM Universiti Teknikal Malaysia Melaka
FTK Faculty of Technology Engineering
CHAPTER 1
INTRODUCTION
In this chapter, the purpose of the project will be described generally. Start with a brief explanation about the background of the project. Then, the problem statement that lead to the idea for this project and several objectives that aimed to achieve are established in order to overcome the problem statement. This chapter also explains the scope that will be discussed in the project.
1.1 BACKGROUND STUDY
(ACMV) performance. Energy consumption and thermal comfort is contributed with each other to analyze student’s comfort level in the building. The study is about the quantification of thermal comfort based on ACMV system inside academic building in Universiti Teknikal Malaysia Melaka (UTeM). The study is carried-out in the Industrial Campus of UTeM, inside the Faculty of Technology Engineering (FTK) Academic Building.
1.2 PROBLEM STATEMENT
1.3 OBJECTIVES
The main objective of this project:
• To identify areas where energy is being used efficiently or being wasted in the current air-conditioning and ventilation system.
• To analyze the thermal comfort level based on the ACMV system in the building.
1.4 SCOPES
The main tasks of the project are:
a) Reviewing and evaluating of current energy consumption. b) Evaluating the human thermal comfort level in the building.
c) Identify important physical parameters that may influence the system performance.
CHAPTER 2
LITERATURE REVIEW
This chapter will cover the literature review of the previous research in thermal comfort analysis in a building. Literature review is a part where the critical study and evaluation of the previous research is done. It is a synopsis of the particular area or correlated topic of the previous research and will be summarize in this chapter. The summarize topic include the entire important subject regarding the project that leads to the development and improvement of the project. Review had been made through the journals, articles and also some books to study the theory, basic concept and method of the related aspect. Based on the previous research, the comparison and improvement can be made for this project.
2.1 INTRODUCTION TO THERMAL COMFORT AND ACMV SYSTEM
comfort can be defined as the state of mind which expresses satisfaction with the thermal environment, according to the published standard such as ASHRAE STANDARD-55 and ISO 7730 (Ari et al, 2007). The reference to “mind” is a subjective matter. It is difficult to please everyone because the environment conditions for everyone are not the same. Primary concern should be given to making sure the people inside are pleased and comfortable to stay – the environment inside not too cold or too hot (Daghigh, 2012). ACMV is an initials that stands for “Air Conditioning and Mechanical Ventilation” system. The air-conditioning and mechanical ventilation (ACMV) systems in the Malaysia (tropic) can be very different from those of the
temperate environment (Yau, 2011). Chen, 2012 stated that poorly operated air
conditioning and mechanical ventilation (ACMV) system might cause Sick Building Syndrome (SBS) symptoms and thermal discomfort in the hot and humid atmosphere.
2.2 AIR-CONDITIONING AND MECHANICAL VENTILATION
ACMV stands for “Air Conditioning and Mechanical Ventilation” system. The Air-Conditioning and Mechanical Ventilation (ACMV) system provides conditioned air into the building to keep occupants inside the building comfortable. According to MALAYSIAN STANDARD-1525 (2007), ACMV systems have three basic types:
a) Central Air-distribution System
b) Central Circulating Water Systems
In this type, components like centrifugal, rotary, screw, scroll or reciprocating, compression refrigeration or absorption refrigeration type water-chilling package provides chilled water to a central piping system. Then, the chilled water was supplies using piping system to water-air heat exchangers (terminal units) serving the conditioned space of the building.
c) Multiple Units Systems
In this case, units of ACMV equipment will receiving a supply of electric energy and then it will perform the functions of cooling air for distribution to a space or zone of the building.
2.3 FACTORS AFFECTING THERMAL COMFORT
According to ASHRAE STANDARD-55 (2004), there are six primary factors or that must be followed when addressed about thermal comfort. Four of them are environmental parameters. The four environmental parameters are air temperature, radiant temperature, air speed/velocity and relative humidity. It is a well known fact, that the environmental factors manipulate the performance of an individual (Ismail, 2010). In more detail, the effects of four environment parameters had been described as following:
a) Air Temperature
b) Radiant Temperature
Mean radiant temperature is the average temperature of surfaces that surround a person. Radiant temperature has a bigger influence than air temperature on how people lose or gain heat to the environment. Radiant heat will manipulate people
anywhere there is direct sunlight. Sunlight coming throughout a window will have effect to mean radiant temperature. This may be decreased by simple actions such as the closing of blinds and curtains or the installation of solar film.
c) Air Velocity
Air velocity is an important factor in thermal comfort because people are
sensitive to it. Air velocity is the average speed of the air to which the body is
exposed. Effect of air velocity affects human comfort. Air velocity will provide relief to people in a hot situation, but the higher air velocity will give additional chill to people in a cold situation.
d) Relative Humidity
Humidity is reference to the moisture content of the air. It can be expressed in terms of several thermodynamic variables, including vapor pressure, dew-point temperature, and humidity ratio. Relative humidity is the ratio between the actual amount of water vapour in the air to the maximum amount of water vapour that
the air can hold at the similar temperature and similar pressure. High humidity makes people feel hotter than low humidity. To create comfortable surroundings, relative humidity must be maintained between 40-60% (Shaharon, 2012). Generally, people are much more sensitive to higher temperature than high humidity.
e) Metabolic Rate
Metabolic rate was defined as the rate of change of chemical energy into heat and mechanical work by metabolic activities. Metabolic rate is usually expressed in terms of unit area of the total body surface. Our bodies generate heat. The
more physical work being done, the more heat that being formed by the bodies
(HSE). The more heat being formed, the more heat needs to be lost so the body
does not overheat. Based on ASHRAE STANDARD-55 (2004), metabolic rate
is expressed in met units.
1 met = 58.2 W/m2 (2.1) Where W is the unit watt and m is the unit meter.
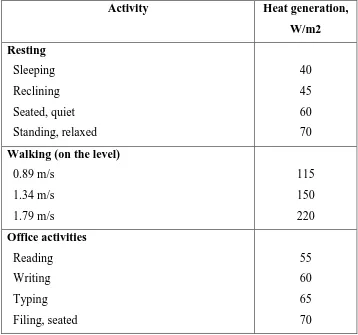
Values of the metabolic rates for various typical tasks are shown in Table 2.1 below: Table 2.1: Metabolic Rates for Typical Tasks
Activity Heat generation, W/m2 Resting Sleeping Reclining Seated, quiet Standing, relaxed 40 45 60 70 Walking (on the level)