DOI: 10.12928/TELKOMNIKA.v13i1.728 193
Data Partition and Communication on Parallel Heuristik
Model Based on Clonal Selection Algorithm
Ayi Purbasari*1, Iping Supriana Suwardi2, Oerip Santoso2, Rila Mandala2
1
Informatics Engineering, Pasundan University
2
School of Electrical Engineering and Informatics, Bandung Institute of Technology
*Corresponding author, e-mail: [email protected], [email protected], [email protected], [email protected]
Abstract
This research conducted experiments on population-based heuristic parallel algorithms, which are inspired by the clonal selection, called Clonal Selection Algorithm (CSA). Course-grained parallelism model applied to improve execution time. Inter-process communication overhead is addressed by adjusting communication frequencies and size of data communicated. Experiments on six parallel computing models represent all possible partitions and communications and using data of NP-Problem, Traveling Salesman Problem (TSP). The algorithm is implemented using model of message passing libraries MPJExpress and ran in a cluster computation environment. Result shows the best parallelism model is achieved by partitioning initial population data at the beginning of communication and the end of generation. Communication frequency can be up to per 1% of a population size generated. Using four dataset from TSPLib, experiments show the effect of communication frequency that increased best cost, from 44.16% to 87.01% for berlin52.tsp; from 9.61% to 53.43% for kroA100.tsp, and from 12.22% to 17.18% for tsp225.tsp. With eight processors, using communication frequency will be reduced execution time e.g 93.07%, 91.60%, 89.60%, 74.74% for burma14.tsp, berlin52.tsp, kroA100.tsp, and tsp225.tsp respectively. We conclude that frequency of communication greatly affects execution time, and also best cost. It improved execution time and best cost.
Keywords: clonal selection algorithm, parallel clonal selection algorithm, parallel heuristic model, data
partition, coarse-grained communication, traveling salesman problem, message passing interface, MPJExpress
1. Introduction
CSA (Clonal Selection Algorithm) is one of the population-based heuristic search algo-rithms. This algorithm has been able to solve combinatorial problems [1],[2], from classical problem the Traveling Salesman Problem (TSP) [2],[3] to particular optimization problems in Iterative Learning Control (ILC) [4]. CSA is part of the Artificial Immune System (AIS), a bio-inspired computing approach to solve complex problems [5],[6]. This approach, like other population approaches, requires significant amount of computation time. Many ideas attempt to address this problem by adopting parallel computation paradigm. As the initiators, Watskin [7] is not specific to the CSA and applied to pattern recognition problems. Hongbing et al. [8] apply the CSA parallelism for protein structure prediction using Open-MPI. Dabrowski and Kobale [9] using the parallel-CSA computation for graph coloring problem.
In this research, parallel computing models will be developed to exploit the available parallelism potential on the clonal selection and CSA. In addition to considering the characteris-tics possessed by the immune system on the clonal selection events, models built refers to the principles and concepts of parallel computation design, taking into account many aspects: partitioning, communication, agglomerations, and mapping [10]
communicated between the whole processes. On the other hand, one of the other drawbacks is the need for inter-processor communication. We need to minimize the effect of this communication overhead.
This research will be focused to search for patterns of relations between parameters of CSA and its relations with parallel computation. The parameters investigated are: size of initial population (whether partitioned or not), size of population data that is communicated between processes, and their relations with computational results (best cost and execution time). This study also makes observations on the communication frequencies on multi-communication models. The models are implemented on parallel computing with multicore and cluster environment using MPJExpress (Java Message Passing Model). MPJExpress is a library that implemented with Message Passing Interface (MPI’s) specification library [12]. MPI could support parallelizing population based algorithm, such us genetic algorithm [13].
The study focuses on the aspects that must be considered in the library application, the resulting computational models, as well as the results of the computation itself. Systematically, this paper contains: Introduction, The Proposed Method/Algorithm, Research Methods, Results and Discussion, and Conclusion.
2. The Proposed Method/Algorithm 2.1. Parallel Clonal Selection Algorithm
Clonal Selection Algorithm (CSA) is an algorithm that inspired by the immune system, especially on the clonal selection events [9]. Clonal selection is an event in the immune re-sponse, whereby an attack of antigen, B-cells as antibody-producing cells would be multiplied if its receptors match with the antigens’ receptor. Cells that do not have matched receptor do not participate in the selection. The match calculation is known as affinity maturation.
CSA is part of Bio-Inspired Algorithm family called Artificial Immune System (AIS) [2],[14],[1]. CSA maps antibodies (an immune component) as a population intended to be a solu-tion, whereas antigen mapped as an issue (problem). In mapping the problem with a solution based on the inspiration of immune system, there is an activity called as immune engineering [6] [3]. In the TSP problem; immune response represents a solution whereas antigen represents the problem; in this case is a collection of node/city where the salesman must visit, the B-cells (antibody) represents a tour that is formed [3]. Details about the CSA can be found in [2] and the principles of this parallel algorithm design can be seen in [10].
Using multicommunication model, which all processes communicate with each other without any master control, we then defined population data partition. Referring to the behavior of the immune system and clonal selection, there are two ideas, e.g. initial population generated by single processor, and each processor independently generating initial population.. Communication between processors is done after clonal selection operation, i.e. selection - cloning - hypermutation - random replacement. The best population in each processor then sent to all processors.
2.2. Parallel Clonal Selection Algorithm for TSP
To apply the clonal selection algorithm into the optimization problem, in this case the TSP problem, we need mapping between problem and a clonal selection algorithm scheme. This mechanism is called immune engineering. In immune engineering, there are two main activities that must be considered, namely representation and affinity maturation. Representation is a problem that mapped into populations in the immune system, which is the expected optimal individual tour TSP. The affinity maturation is cost calculation between the proximity of a tour in each population with the expected best solution. Here's an overview of immune engineering in Table 1.
3. Research Method
Table 1. Immune engineering Clonal Selection
Processes
TSP Problem
Population initialization Set of randomly generated tour. There are (n-1)! possibilities that the tours may be raised. This population is part of the whole tours. The number of tours is generated by the specified population size.
Affinity evaluation Evaluation of affinity checks each tour that has raised, find the cost required to form the tour.
Selection: affinity maturation
Affinity is how close the cost of a tour with the optimal/best cost. The closer, the higher affinity and will be selected.
Cloning Cloning is process to copy selected tour, number of copies are depends on clone factor: Hypermutation Cloned/copied tour will be mutated according to hypermutation probability mutate factor: Edit receptor/elisitation After mutate, we will have the best tours-that will be replacedthe worst tours in the initial
population.The number worst tour replaced will be depends on some random size replacement d.
Stop condition Clonal selection process will be repeated until a stop condition obtained. Stopping criteria could be the number of generations, or numbers of populations (tours) are evaluated, or best cost found.
Processing element communications
Exchange best tours produced by each of the processing elements to other processing elements.
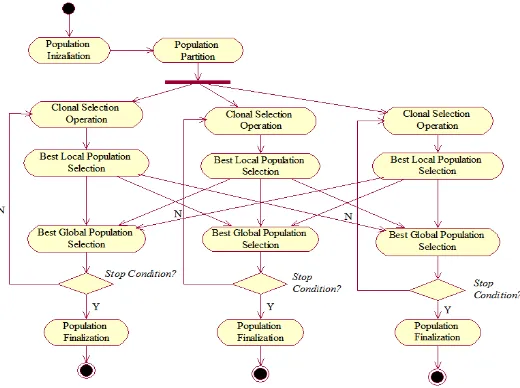
Here the description about research method that used in this research:
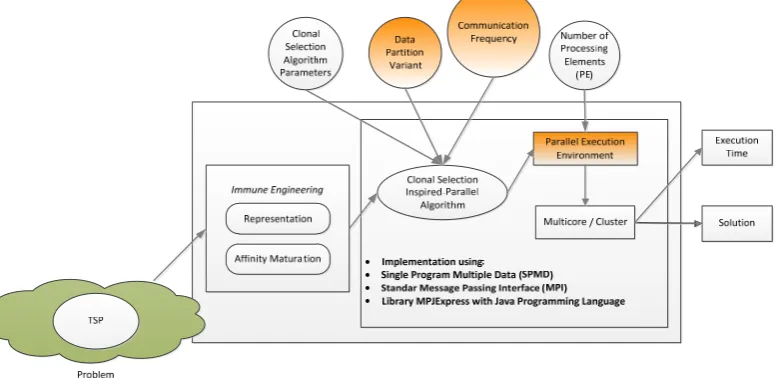
Figure 1. Reseach method
The problems are going to have immune engineered; which are representation and af-finity maturation.There are parallel clonal selection algorithm called clonal selection inspired parallel algorithm (CSI-PA) that has several parameters that has been set. Parameters of the clonal selection consists of the population size (N), the number of selection (n), the number of generations (g), and the number of nodes (non) from TSP Problem. These algorithms are exe-cuted in parallel execution environment, e.g multicore and cluster computer. There are several procesing elements to process.These executions will result solustion, e.g. the best tour with their best cost and time for execution. These algorithms are implemented using single program multiple data model, using message passing interface standard (MPI) and libray named MPJExpres using Java Programming language. The algorithms will be executed using some variant of data partition and communication frequency.
compute-nodes are using CPUs 16x2.70GHz, 15.66GB memory, local disk 142.835GB and Linux 2.6.32-279. Software environments are using Java Message Passing Model, MPJExpress that developed using the IDE Netbean 7.2.1 with Java 1.7.0_13 version. Entirely run on Windows 7 Operating System v6.1.
To execute it, compiled simulation execution can be seen in Table 2 as follows:
Table 2. Experiments scenario
Dataset Name Burma14, Berlin52, KroA100, tsp225
Known Best Cost from TSPLib [16] 3.323,7.542,21.282,3.916
Number of Node 14, 52, 100, 225
Number of Generation 100,000
Parameter Value
N, initial population 50 n, number of selection 10
Size of population data communicated Number of partition- N
Clone factor β 0.1
Mutate factor δ 2.5
Number of processor 2, 4, 8
Processing Environment Multicore, Cluster
Some parameter values have been defined, such as the value of the initial population, the number of selection, clone factor, and mutate factor. Initial population partition was done in Figure 2 as follows:
Figure 2. Population partition
Description:
Number of partition = number of processors (np)
Population size in 1st, 2nd… (np-1)th Partition (pp) = N/np
npth Number of Population in Partition (pp) = N – (np*pp)
Example: N = 50, np = 4. Number of partition = 4, Population size in 1st, 2nd , 3rd partition = 12, population size in 4th partition = 14.
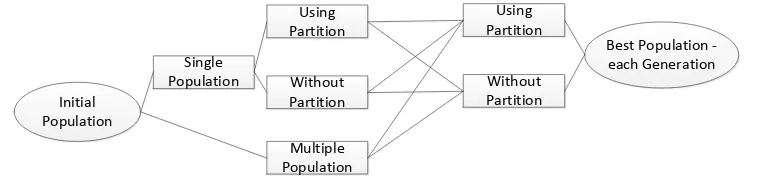
Experiment overview can be resumed in Figure 3. Thus we have six models for experiment. We do several executions for each experiment, and then get the average result from each ex-periment to report in section Result and Discussion. After that, we will check the effect of communication frequency to execution time result and the best cost obtained.
Figure 3. Experiment scenarios
Initial Population
Single Population
Multiple Population
Using Partition
Without Partition
Best Population -each Generation Using
Partition
4. Result and Discussion
Based on the above scenario, conducted experiments on cluster environment with four datasets, e.g., burma14.tsp, berlin52.tsp, kroA100.tsp,and tsp225.tsp. Results logged from main processor (process 0). For the six models, we observed effects of the number of generations and the frequency of communication on the best cost and the execution time. We do with 100.000 number of generation. There are two result experiments, first result will show the effect of partition and the second one is the effect of communication frequency to exe-cution time and best cost obtained. Detail of the result will be presented in the following section.
4.1. Result I
The first experiment was to observe the six models in terms of the number of genera-tions, best cost, and execution time. Table 3 below shows the results for the six experiments based on weight and execution time. Experiments about execution time are summarized in Table 4 below.
Table 3. Best cost for all dataset Number
Average 3.389 3.339 3.327 3.363 3.373 3.353
52
2 17.079 19.226 17.573 17.079 19.226 17.573 4 20.028 20.341 20.325 20.028 20.341 20.325 8 19.353 20.124 19.070 20.856 19.437 19.453 Average 18.820 19.897 18.989 19.321 19.668 19.117
100
2 109.807 124.267 124.241 110.579 114.163 113.407 4 108.539 122.320 122.265 116.127 113.717 121.420 8 127.794 125.157 121.283 119.702 116.325 121.233 Average 115.380 123.915 122.596 115.469 114.735 118.687
225
2 32.309 34.333 32.283 33.411 33.543 34.193 4 34.440 32.047 33.814 33.344 33.883 33.913 8 34.321 33.392 33.823 32.281 34.556 33.731 Average 33.690 33.257 33.307 33.012 33.994 33.946
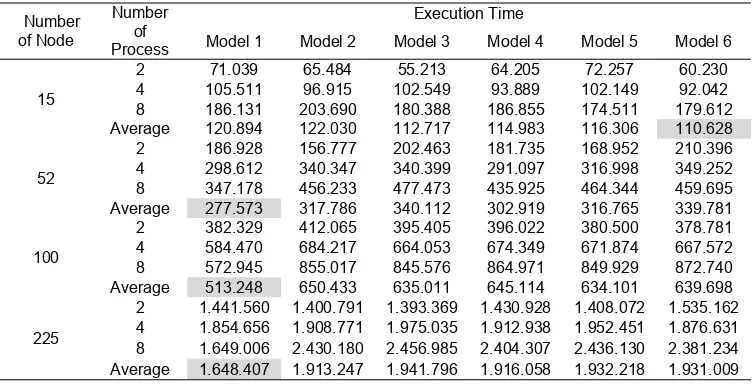
Table 4. Execution time for all dataset Number
2 71.039 65.484 55.213 64.205 72.257 60.230 4 105.511 96.915 102.549 93.889 102.149 92.042 8 186.131 203.690 180.388 186.855 174.511 179.612 Average 120.894 122.030 112.717 114.983 116.306 110.628
52
2 186.928 156.777 202.463 181.735 168.952 210.396 4 298.612 340.347 340.399 291.097 316.998 349.252 8 347.178 456.233 477.473 435.925 464.344 459.695 Average 277.573 317.786 340.112 302.919 316.765 339.781
100
2 382.329 412.065 395.405 396.022 380.500 378.781 4 584.470 684.217 664.053 674.349 671.874 667.572 8 572.945 855.017 845.576 864.971 849.929 872.740 Average 513.248 650.433 635.011 645.114 634.101 639.698
225
2 1.441.560 1.400.791 1.393.369 1.430.928 1.408.072 1.535.162 4 1.854.656 1.908.771 1.975.035 1.912.938 1.952.451 1.876.631 8 1.649.006 2.430.180 2.456.985 2.404.307 2.436.130 2.381.234 Average 1.648.407 1.913.247 1.941.796 1.916.058 1.932.218 1.931.009
was obtained by several models, with 2 and 4 number of processing elements. Their best costs are 3323 which is same as best known best cost from TSPLib for burma14.tsp dataset. But increasing number of node made different results, as we can see model number 1 gained better best cost for dataset berlin52, kroA100, and tsp225 with 2 number of processing elements, close to model number 2 with 4 number of processing element. Table above shows that number of processing elements has no direct impact for best cost obtained for all dataset. It because, best costs obtained are more depend on.cloning and hypermutation mechanism that result random tour. Tabel 4 shows experiment results for execution time. If we use more processing element, then we will need more time to execute. There are communication overheads between processing elements. Except model 1, that if we use 8 number of processing elements, we will have better execution time than if we use 4 number of processing elements. Averagely, model number 1 has better execution time than others for all datasets.
4.2. Result II
In this experiment, we carried out some reductions of the frequency of communication between processors. The ultimate goal is to get the execution time as possible, but does not reduce the quality of the final result, i.e. best cost. Table 5 shows summary of the best cost after we controlled the communication frequency.
Table 5. Best cost for all dataset after controlled communication frequency Number of
Node Number of Process
Execution Time after controlled Comm. Frequency Model 1 Model 2 Model 3 Model 4 Model 5 Model 6
14
2 13.965 13.876 13.101 12.822 13.064 14.593 4 13.695 13.488 14.166 14.059 15.296 15.936 8 12.905 16.469 15.904 13.848 17.521 17.213 Average 13.522 14.611 14.390 13.576 15.294 15.914
52
2 48.347 49.279 48.468 47.233 51.105 47.659 4 48.690 54.209 52.884 51.390 55.027 52.415 8 39.501 55.954 53.954 36.604 55.549 53.125 Average 45.513 53.147 51.769 45.076 53.894 51.066
100
2 118.584 119.178 122.385 116.806 118.913 118.218 4 116.400 117.955 122.642 123.459 121.134 121.325 8 90.327 124.685 125.294 89.993 122.733 127.565 Average 108.437 120.606 123.440 110.086 120.927 122.369
225
2 788.580 786.276 782.141 789.671 793.007 787.424 4 777.486 798.155 787.218 790.475 794.047 781.497 8 620.036 794.198 803.693 607.228 797.229 793.964 Average 728.701 792.876 791.017 729.125 794.761 787.628
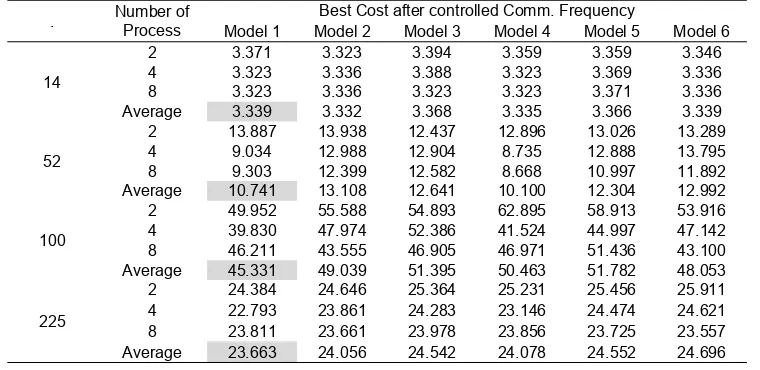
Table 6 shows the best execution times after we controlled communication frequency.
Table 6. Execution for all dataset after controlled communication frequency . Number of Process Best Cost after controlled Comm. Frequency
Model 1 Model 2 Model 3 Model 4 Model 5 Model 6
14
2 3.371 3.323 3.394 3.359 3.359 3.346
4 3.323 3.336 3.388 3.323 3.369 3.336
8 3.323 3.336 3.323 3.323 3.371 3.336
Average 3.339 3.332 3.368 3.335 3.366 3.339
52
2 13.887 13.938 12.437 12.896 13.026 13.289 4 9.034 12.988 12.904 8.735 12.888 13.795 8 9.303 12.399 12.582 8.668 10.997 11.892 Average 10.741 13.108 12.641 10.100 12.304 12.992
100
2 49.952 55.588 54.893 62.895 58.913 53.916 4 39.830 47.974 52.386 41.524 44.997 47.142 8 46.211 43.555 46.905 46.971 51.436 43.100 Average 45.331 49.039 51.395 50.463 51.782 48.053
225
After we controlled communication fre-quency, we gained execution times 12.822ms (M4; np2), 36.604ms (M4; np2), 89.993ms (M4; np8), and 607.228ms (M4; np8) for bur-ma14.tsp, berlin52.tsp, kroA100.tsp and tsp225.tsp respectively. Compare to Table 4 above, the execution time reductions are 93.07%, 91.60% , 89.60%, 74.74% respectively. The average execution time shows that Model 1 gained the best execution time.
We can see that controlled frequency greatly affects the execution time, and also the best cost. It improved execution time and also best cost.
4.3. Result III
This section shows comparison the result from section 4.2 with another approach from another researcher. Since another researchs using different case and different parallel pro-gramming environment, we need to do re-created algorithm and program and apply it to the same case, TSP problem, with some assumption. Since model 1, with single population and partition shows the best result, we choose it and compare to algorithm from [8]. Figure 4 de-scriribe parallel computing model from Hongbing, using ring communciation; compare to model 1 from section 4.2, using mesh communication, can be shown in Figure 5 below:
Figure 4. Single-population with ring communication
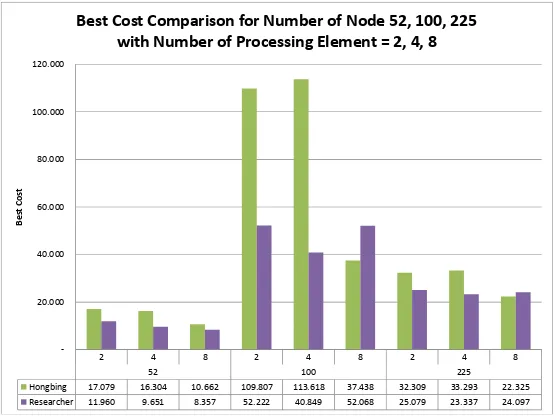
Figure 6 shows best cost comparison for all dataset with number of processing element 2, 4, and 8 and Figure 7 show execution time comparison for all dataset with number of processing element 2, 4, and 8. As we can see, from best cost, there are some differences results from each dataset. But over all, result from researcher gain better best cost than other researcher. From execution time point of view, result from researcher gain significant improve-ment than result from other researcher. We conclude that our approaced lead to better result.
Figure 6. Best cost comparison for all dataset with several number of processing element
Figure 7. Execution time comparison for all dataset with several number of processing element
5. Conclusion
Experiment results showthat all the models, produce best weight relatively close to known-best-cost for burma14 dataset. However, for other dataset need more generation to obtain best know result. Before and after controlled communication frequency, there are some models that obtained 100% known best cost e.g:Model 2 wih np=4 (M2; np4),M4; np8,M5; np4,M6; np2 np4,M1; np4 np8,M2; np2,M3; np8,M4; np4 np8. The execution time significantly
2 4 8 2 4 8 2 4 8
52 100 225
Hongbing 17.079 16.304 10.662 109.807 113.618 37.438 32.309 33.293 22.325 Researcher 11.960 9.651 8.357 52.222 40.849 52.068 25.079 23.337 24.097
-Hongbing 431.891 625.048 774.747 820.685 1.046.232 1.098.001 2.728.151 3.077.894 3.161.612 Researcher 49.413 52.515 38.708 121.474 120.451 99.090 803.739 790.402 636.558
-differs for each model, increases with the number of gener-ations and the number of processors used. It appears that the amount of processing affects the execution time but does not affect the best cost. Frequency of communication greatly affects the execution time, and also the best cost. It improved execution time and best cost. Communication frequency can be up to per 1% of a population size generated. Using four dataset from TSPLib, experiments show the effect of communication frequency that increased best cost, from 44.16% to 87.01% for berlin52.tsp; from 9.61% to 53.43% for kroA100.tsp, and from 12.22% to 17.18% for tsp225.tsp. With eight processors, using communication frequency will be reduced execution time e.g 93.07%, 91.60%, 89.60%, 74.74% for burma14.tsp, berlin52.tsp, kroA100.tsp, and tsp225.tsp respectively.
We conclude that with six models, to obtain best cost the best model is M1, e.g single population with partition in initial population and its best population; and to obtain best execution time, the best model is M4, e.g single population with partition at the end of generation. For the average execution time we can see Model 1 gained the best cost and the execution time. These conditions are best if the communication frequency is controlled. After compare to another approach from another researcher, from execution time point of view, result from researcher gain significant improve-ment than result from other researcher. We conclude that our approaced lead to better result
References
[1] Kulturel-Konak, S Ulutas BH. A Review of Clonal Selection Algorithm and Its Applications. Artificial Intelligence Review. 2011; 36 (2): 117-138.
[2] De Castro LN, Von ZF. Learning and Optimization Using the Clonal Selection Principle. IEEE Transactions On Evolutionary Computation. 2002; 6(3): 239-251.
[3] Gaber J, Bakhouya M. An Immune Inspired-based Optimization Algorithm: Application to the Traveling Salesman Problem. AMO - Advanced Modeling and Optimization. 2007; 9(1): 105-116. [4] Qun G, Xiao HH, Xian JD, Wei TX, Yuanyuan J. Clonal Selection Algorithm Based Iterative Learning
Control with Random Disturbance. TELKOMNIKA Indonesian Journal of Electrical Engineering. 2013; 11(1): 443-447.
[5] Alsharhan S, JR Al-Enezi, Abbod MF. Artificial Immune Systems – Models, Algorithms and Applications. International Journal of Research and Reviews in Applied Science (IJRRAS). 2010; 1(1): 118-131.
[6] Timmis J, De Castro LN. Artificial Immune Systems: A New Computational Approach. 2002.
[7] Watkins A, Bi X, Phadke A. Parallelizing an Immune-Inspiring Algorithm for Efficient Pattern Recognition. In Intelligent Engineering Systems through Artificial Neural Networks: Smart Engineering. 2003: 225-230.
[8] Hongbing Z, Sicheng C, Jianguo W. Paralleling Clonal Selection Algorithm with OpenMP. In 3rd International Conference on Intelligent Networks and Intelligent Systems (ICINIS). Shenyang. 2010; 1: 463 - 466.
[9] Dabrowski J, Kubale M. Computer Experiments with a Parallel Clonal Selection Algorithm for the Graph Coloring Problem. In IEEE International Symposium on Parallel and Distributed Processing. Miami. Florida. 2008: 1-6.
[10] Ian F. Designing and Building Parallel Programs. 1995. [Online]. http://www.mcs.anl.gov/~itf/dbpp/
[11] Blaise. Introduction to Parallel Computing. 2012. [Online]. https://computing.llnl.gov/tutorials/parallel_comp
[12] Baker M, Carpenter B, Shafi A. MPJ Express: towards thread safe Java HPC. In IEEE International Conference on Cluster Computing. 2006:1-10.
[13] Zhang JJ, Liu WJ, Liu GY. Parallel Genetic Algorithm Based on the MPI Environment. TELKOMNIKA Indonesian Journal of Electrical Engineering. 2012; 10(7): 1708-1715.
[14] Brownlee J. Clonal Selection Algorithms. Complex Intelligent Systems Laboratory, Centre for Information Technology Research, Faculty of Information Communication Technology, Swinburne University of Technology, Melbourne, Australia. 2009.