Weeds and Plants Recognition
using Fuzzy Clustering and Fractal Dimension Methods
for Automatic Weed Control
environment and water contamination have led researcher orientation toward finding solutions for their accurate use. If density and weeds species could be correctly detected, patch spraying or spot spraying can effectively reduce herbicide usage. A machine vision with precise automatic weed control system could also reduce the usage of chemicals. Machine vision is a useful method for segmentation of different objects in agricultural applications, especially pattern recognition methods. Many indices have been investigated by researchers to perform weed segmentation based on color information of the images. The purpose of this research is to develop machine vision system that can detect weeds density and variability. In this study the relation between three main color components (red, green & blue) of the images and color feature extraction (hue, saturation, intensity) were used to define weeds density. 1.268, peanut plants have fractal dimension values in the range 1.511 to 1.629, while the weeds have fractal dimension values in the range 1.325 to 1.497.Keywords : Image processing, machine vision, weed control, fractal dimension, fuzzy clustering
I. INTRODUCTION
Weeds can cause various kinds of losses. In agriculture, weeds can reduce crops yield. Stunted plant growth, which will cause the decline. The amount of yield reduction depends on plant varieties, soil fertility, weed type and density, the duration of the competition and culture of action. Indonesia's decline in plant yield due to weeds is estimated at 10-20% (Dwiguntoro, 2008). Weeds can also reduce the quality of agricultural products due contamination of weed seeds to the crop during harvest time and during product processing.
Weeds have a common characteristic that distinguishes the plant cultivation, among others: a high adaptation to the environment, the high number of seeds produced, high competitiveness, long time seed dormancy, ability to survive in circumstances that are not favourable to grow, capable of propagate vegetatively besides generative breeding.
Under the common response to the herbicide, weed is divided into three categories namely weed grasses, broad-leaved weeds (broad leave), and weeds puzzles (sedges).
In order to determine the choice of an appropriate method for controlling weeds, it is needed to analyze vegetation weeds first. Weed vegetation analysis and identification done before control measures are selected and implemented. Lack of precision in the analysis of weed control can lead to ineffective and inefficient, excessive use of cost, time and energy.
The purpose of this research is to build machine vision system that can detect weeds density and variability using fuzzy clustering and fractal dimension methods.
II. MATERIALS AND METHODS
Weed and crop images were obtained from two principal locations, Leuwikopo Research Field of Bogor Agricultural University and from farmers fields surrounding the campus. The selected crops were sweet corn at the age of 9 days and 23 days, and 23 days old peanut, while the types of weeds were grass and the other weeds having similar shape with the main crops. The selection of plants were done randomly in the fields, and done on a sunny day conditions
A. Image Capturing and Processing
Image capturing and processing were due with the following steps :
1.Determination of image capturing area
Image size used was (640x480 dpi with a file size of 0.3 MB.
2.Field conditions data acquisition were selected those depicting the diversity of weed attacks.
3.Image processing.
Weed Image was analyzed with digital image processing to obtain the value of image parameters such as RGB and HSI. Image processing is done in two levels : 1) single-image analysis and 2) image cut into four pieces with the same size of 320x240 dpi.
4.Analysis of weed attack distribution
The analysis used fuzzy clustering technique.
B. Fuzzy clustering
Clustering is a way to analyze data by grouping the objects into groups based on a certain similarity. Clustering can also be interpreted as a process to define the mapping of some data D = (t1, t2, ... ... tn) into several clusters C = (c1, c2, ...., Cn) on the basis of similarity between data. A cluster is a collection of objects grouped together because of similarities or proximity. Clustering commonly used in many fields, such as: data mining, pattern recognition, image classification, and various other purposes.
Cluster analysis is a multivariate analysis technique (many variables) to find and organize information about variables so that a relative can be grouped in a homogeneous form in a cluster. In general, can be regarded as the process of analyzing whether or not a process of cluster formation. Cluster analysis can be obtained from the density of clusters formed (cluster density). The density of a cluster can be determined by variety in the cluster (Vw) and variety of inter-cluster (Vb).
Variants of each stage of cluster formation is calculated using the formula:
Value diversity in the cluster (Vw) is calculated with the formula
Value diversity in the cluster (Vw) is calculated with the formula :
N = number of all data ni = number of data clusters i Vi = A variant of cluster i
The value range of inter-cluster (Vb) was calculated by using the formula:
C. Fractal Dimension Analysis
Fractal shapes can generally be attributed to characteristics known as the fractal dimension. Fractal dimension analysis conducted by the fragmentation of the image that has been filtered into rectangular shapes measuring s. Furthermore, calculated the number of squares N (s) containing the color white (the result of filtering plants). This calculation is repeated with a share value of s. Fragmentation in this study conducted with the value s = 5 to 40 with intervals of s = 5 pixels. The next step is to plot the value of log N (s) to the value of log (1 / s) and determine the form of a linear regression equation y = ax + b. Fractal dimensions is a value on the linear regression equation.
III. RESULTS AND DISCUSSIONS
A. Image Processing
Images that has been taken were analyzed to determine the colors components. Image shooting with 640 x 480 size is processed to obtain average values of red, green, blue, greyscale, and hue. Based on the color components parameters of filtering were determinated to separate background image with plant image. Determination of parameter values is done by plotting average value of red, green, blue, greyscale, and hue in a graph. Based on the parameters were then selected base on the change of pattern significantly in the plant's position.
Figure 1. Relations of average values of red, green, blue, grey scale, and hue with horizontal pixel position.
Filtering parameter is a constant which is determined based on variable values of Hue, which is a significant boundary between the background and plants.
Figure 2. Relationships of the hue average value and horizontal pixel positions.
Figure 3. Filtering result with average value of hue as the filtering parameter
a) Corn
b) Peanut
b) Weed
Figure 4. Results of filtering on various types of plants
B. Weed Density Analysis
Weed density sample were represented by 8 images showing the diversity of weed density is shown in Figure 5.. Image capturing aimed at determining the density cluster based on the average green color value.
TABLE 1.FUZZY CLUSTERING RESULT FOR 8 IMAGES INTO 3 CLUSTERS (640X480 DPI IMAGE SIZE)
Figure 5. Weed density map produced by segmentation on 8 images in 3 clusters.
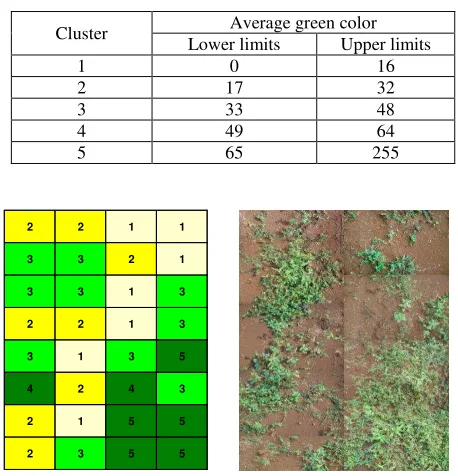
TABLE 2.SEGMENTATION RESULTS IN 32 IMAGES IN 5 CLUSTERS (320X240 DPI IMAGE SIZE)
Cluster Average green color Lower limits Upper limits
1 0 16
2 17 32
3 33 48
4 49 64
5 65 255
Figure 6. Weed density map produced by segmentation on 32 images and 5 clusters.
Identifying the presence of weeds among the main crops can be done by evaluating a particular value that is unique among the weeds and the main crops. If the value is obviously different between weeds and the main crops, the typical value can be used as a reference for identification.
From the sample of corn and peanut crops fractal dimension method is able to identify the presence of weeds on the field. It can be seen from the range of values obtained fractal dimension.
TABLE 3.FRACTAL DIMENSION OF VARIOUS TYPES OF PLANT AND WEED
Sample Type of crops Fractal dimension 1 peanut 1.616 days age have fractal dimension value on the range 1.148 to 1.268, the 23 days peanut have fractal dimension value on the range 1.511 to 1.629, while weeds fractal dimension value on the range 1.325 to 1.497.
IV. CONCLUSIONS AND SUGGESTIONS
Fuzzy clustering were able to identify the weed density. Furthermore segmentation with a smaller image size and higher number of cluster produce a more accurate weed density maps.
Fractal dimension can distinguish the type of plant and weed. Corn plants have fractal dimension values in the range 1.148 to 1.268, peanut plants have fractal dimension values in the range 1.511 to 1.629, while the Weeds have fractal dimension values in the range 1325 to 1497.
REFERENCES .
[1] Dwiguntoro, 2008. Sekilas Tentang Gulma.
http://dwiguntoro.wordpress.com/2008/11/30/ Sekilas Tentang Gulma.html
[2] Lauwerier H. 1991. Fractals, Endlessly Repeated Geometrical Figures. Princeton University Press, Princeton-New Jersey. [3] Ming W.H., C.J. Hou. 2004. Cluster analysis and visualization,
Workshop on Statistics and Machine Learning, Institute of Statistical Science, Academia Sinica
[4] Steward B. L.and Tian L. F. 1996. Real Time Machine Vision Weed-Sensing. Department of Agricultural Engineering. University of Illinois at Urbana-Champaign USA.
[5] Tangkowit, R., V. Salokhe, H. Jayasuria. 2006. Development of Tractor Mounted Real-time Variable Rate Herbicide Applicator for Sugarcane Planting. Agricultural Engineering International : the CIGR Ejournal Vol. VIII, June, 2006.