Classification of Dual-Polarization PALSAR Image
Of Aceh
M. Natsir
The Remote Sensing Technology and Data Center, The National Aeronautics and Space Institute (LAPAN)
Abstract
—
The determination of forest area in Aceh had been carried out with PALSAR data. Phase Array type L-band Synthetic Aperture Radar (PALSAR) data were different with optical data either in data acquisition or difficulties in data processing. A single un-polarized radar data were difficult to recognize objects of targets. While multi-polarized radar easier to recognize objects. The horizontal polarized radar wave H transmitted to object and the return wave were received with horizontal polarized receiver produced HH polarized radar data, while the return wave received with vertical polarized receiver produced HV polarized radar data. In the other hand vertical polarized radar wave V transmitted to objects received with horizontal receiver produced VH polarized radar data, and produced VV polarized radar data if the return radar wave received with vertical polarized receiver. PALSAR acquired data in some mode, among others dual-polarization mode that produced both HH and HV polarized radar image data. These data then be processed became ortho rectified HH and HV polarized radar image data. The only two images could be combined in a color composite image, HH in blue channel , HV in green channel , and HH again in red channel, objects included in the images could be seen in colors. Wide area objects such as forest, resident area, agriculture namely land covers could be clustered (classified) in one color respectively. The certain land cover classification could be performed by the classic supervised classification – maximumlikelihood. The result was a colorfull classified image that represented some object areas over Aceh.Key words: Multi-Polarization Radar, Dual-Polarisation Radar, PALSAR, Classification
I. INTRODUCTION
In the recent three decades, human societies have realized that the global warming effect in decreasing of the environment quality to impact the human life. There are many disaster caused by the irregularity in the climate and weather of global warming effect. One of the greenhouse gases behind all the global warming effect was carbon dioxide. There were many international cooperation to cope with the global warming. The primary work deals with global warming was trees calculation, how much carbon dioxide can be absorbed by the trees, especially tropical forest. Therefore, Indonesia that has large area tropical forest in its territory
joint the international cooperation to help the world overcome the global warming.
One of the forest area calculating efforts was using remote sensing technology either optical remote sensing or radar remote sensing. Although, optical remote sensing data could be used perfectly in the forest area mapping and calculation, but often tied up by cloud. Radar wave could penetrate the clouds, therefore it could be the alternative tool to calculate the cloudy forest area.
In order to calculate the forest area of Sumatra, LAPAN had cooperated with JAXA to tray the ability of PALSAR
Fig 2. Atmospheric Window
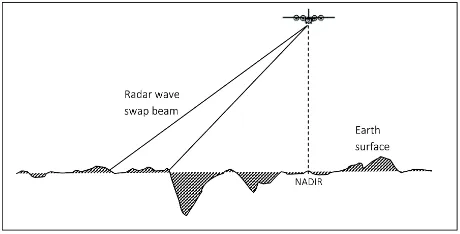
Radar data had advantages can pass through a cloud and does not require the sun rays, but had a weakness in acquisition geometric. The radar data acquired in oblique had shadow and layover images, was difficult to be corrected. flight direction or azimuth direction depended on its antenna beam width, and the spatial resolution in lateral direction or range direction depended on its pulse repetition rate. SAR sensor can be carried with either aircraft or satellite or space shuttles. The sensor could be brought by air plane without time limitation, while by satellite in its orbits. SAR carried by satellites among others RADARSAT of Canada, ERS (Earth Resources Satellite) from Europe Space Agency (ESA), JERS (Japan Earth Resources Satellite) own by Japan space agency NASDA and ALOS (Advanced Land Observation
The PALSAR carrier satellite is called ALOS (Advanced Land Observation Satellite) had launched into orbit by Japan on 24 January 2006 from Jaxa’s Tanegashima Space Center. ALOS also known as ‘Daichi’ had five objectives: (1) mapping over Japan and its surrounding, (2) observing the sustainable development of regional development and earth environment, (3) disaster monitoring, (5) future technology development. Besides PALSAR, ALOS also carried PRISM (Panchromatic Remote Sensing Instrument for Stereo Mapping) designed for digital elevation mapping that provided elevation data, AVNIR-2 (Advanced Visible and Near Infrared Radiometer) planned for an accurate land observation. In accordance with its name was PALSAR capable of producing SAR data or radar data at L-band. Re-visiting period of ALOS was 46 days, but can be push in 2 days for emergency monitoring. PALSAR constituted development or enhancement of the SAR brought by JERS-1 satellite. PALSAR was a fine beam full polarized system, operated with fine beam single polarization (FBS) in H-H or V-V, dual polarization in HH and HV or VV and VH, as well as the full polarimetry in HH, HV, VH and VV. There was
also ScanSAR single polarization in HH or VV. The frequency center of the radar wave was 1270 MHz or 23.6 Cm of wavelength. Its band width were 28 MHZ in fine beam single polarization, 14 MHz in dual quad polarization and ScanSAR mode. Its off-nadir angle varied between 9.9o
and 50.8o (mid-swath) connected with incident angle between 7.9o
and 60.0o.
Fig 2. PALSAR ALOS Data Acquisition (http://www.eorc.jaxa.jp, 2012) In ScanSAR its incident angle variation was between 18o and
43.0o (see figure 2 below).Data used in our research were in
dual mode, they were HH and HV radar images. The spatial resolution or pixel size of image was 25 m.
B. Methodology
PALSAR data processing with raw data as its input and classified data as its results could be done with several steps as seen in figure 3. The pre-processing and mosaic had been done by JAXA. The LAPAN researcher just did digital number conversion to db and classification to measure the forest area of Aceh. To convert the digital numbers to radar wave scattered cross section power per unit projected area in db called gamma naught, it was needed formulae as follows:
γ
o(
db
)=
10 log
(
DN
2)
−83
(1)Fig 3: The Data Processing Flow Diagram
The ortho rectified HH and HV polarized PALSAR data then were combined to be a color composite image with HH in blue channel and red channel while HV in green channel. The color combination would be like in the color additive theory used in RGB color TV. The advantages of color vision was that invisible features in black-white images would be revealed in color composite images.
The color addition formula of red, green and blue color was in the following .
C
mix=
r.R
+
g.G
+
b.B
(2)Fig 4: Red Green Blue Color Addition
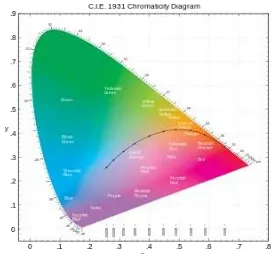
The color mixture could be made by adding r portion of red, g portion of green and b portion of blue. Color mixture with the same portion of red, green and blue would produce a white or gray. The mixture of red and green was yellow, the mixture of green and blue was cyan, then the mixture of red and blue was purple. While the more complicated theory included in the CIE 1931system of colorimetry.
Fig 6. CIE 1931 chromaticity Diagram (Wikipedia, 2014)
The classification tool in this research was maximum likelihood. This method had been used in optical data supervised classification since 1980s. This method evaluated the pixel’s variant as well as its spectral response pattern. The pixels training sample distributions were normal. The spectral response patterns of land covers assumed as an average vector and covariance matrices had a normal statistical distribution.
The spread diagram of the three variables were shown in the figure 7, with the probability as the vertical axis. The group of object classes described as mountains or hills of probability density function values. The digital values in a group of pixels would be identical as their average.
In order to know the distribution of forest and the other objects, the color composite of Aceh PALSAR dual polarized image should be classified. One technique to perform the such kind of classification was supervise classification, maximum likelihood classification. This technique needed sample areas or area of interest that should be decided in the beginning of process.
Fig 7: Object Classes distribution diagram (from many sources)
The software we used in the research was ENVI as the main processing facility and ErMapper was a comparison tool. Both software had supervised classification; maximum likelihood.
IV. RESULT AND DISCUSSION
The color combination of the Dual polarized PALSAR Data or color composite was shown in figure 8. The RGB color combination was called false color composite, because it was an artificial color by mean the red component was not a real natural red, the green component was not a real natural green, and the blue component was not a real natural blue colors.
As discussed before, HH polarized image was connected with blue and red channels, and the HV polarized image was connected with green channel in the processing facility. The features displayed on the screen with a full color: soft green color dominated the image, meant that dense vegetation or forest covered almost entire Aceh. Purple meant resident area or city. Dark purple meant palm oil plantation or paddy field. Blac meant water body or other flat objects.
After did the maximum likelihood classiification to Aceh PALSAR dual-polarization image, it was provided a result, a classified PALSAR image and a such distribution table. The maximum likelihood classification result of Aceh PALSAR Dual-polarization was shown in fig 9 and Table 1.
Fig 8: False Color Composite HH-HV Aceh and Google
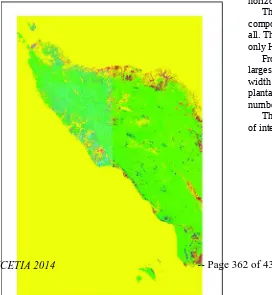
Fig 9: The Aceh PALSAR Dual Polarized Image Classification Result
Figure 9 included 7 (seven) groups or classes of objects in colorfull image, such as resident area was magenta, forest was green, mix plantation was blue, palm oil plantation was maroon, rural area was cyan, agriculture was red, and dried paddy field was purple. Satellite) from The United State of America (USA), SPOT (Satellite pour Observation d' La Terre) from the The Franch Republic or Google, the PALSAR Dual-polarization visually is quite different. The color composite of optical data like Google (fig 8) shows vegetation or forest with green and deep green. While the PALSAR dual-polarization color composite shows vegetation especially forest with soft or light green, it means that there are radar wave back scattering in both HH and HV channels.
The light green color shows that the green channel is greater than the others. It also presents that the vertical polarized wave component is greater than the horizontal polarized wave komponent. It is also saying that the forest vertical component (the trunk) greater (higher) than the horizontal componet (branch, twig or ground).
The purple color of PALSAR Dual-polarization color composite says that there is no vertical or green channel at all. The purple is the mixture of blue and red that come from only HH component.
From the classification result the reader can see that the larges area that covers Aceh area is forest. Then paddy field width is the second, the rural area is the third, the palm oil plantation is the fourth. The width of mix plantation is number six and dried agriculture area is the last.
Visually PALSAR dual-polarization image can differ between objects especially forest and non forest. The maximum likelihood method of classification can groups the object calculate the area of object especially forest, the largest component of the land.
REFERENCES
[1]Elachi, C. 1988, “Spaceborne Radar Remote Sensing:
Application and Techniques”, IEEE Geoscience and Remote
Sensing Society, 345 East 47th Street , New York
[2]Hoekman, D. 2011. “Introduction to Remote Sensing Physic
and Radar”, Environmental Science- Wegeningen University
[3]Lee, Jong-sen and Eric Potter, 2009, “Polarimetric Radar
Imaging from Basic to Application”, CRC Press Taylor &
Francis Group, Boca Raton, Florida
[4]Sanden, J.J. van der. 1997. “Radar Remote Sensing to Support
Tropical Forest Management”, Tropenbos- Guyana
[5]Verhoeven, R. 2011. “Gamma Image Processing Chain”,
SARVision, Bahan Workshop SARVision, Universitas
Wegeningen - LAPAN
[6]Werner, C. 2012. “PALSAR Processing”
http://www.opengis.co.jp/htm/gamma/
[7]http://www.eorc.jaxa.jp/ALOS/en/kc_mosaic/kc_mosaic.htm,
[Juli 2012]
[8]http://www.members.chello.nl/~r.sugardiman/html/GEO