Characterizing Forest Degradation using Multiple SAR Approaches: Case Study of
Tropical Peatland Forests in Sumatera, Indonesia
Arief Wijaya1†, Ari Susanti2, Wahyu Wardhana2, Sigit Deni Sasmito1, Serge Claudio Rafanoharana1, Gilang Aria Seta1, Oka Karyanto2 and Louis Verchot1
Center for International Forestry Research (CIFOR), JL. CIFOR, Situgede, Bogor Barat, 16115 Indonesia
Faculty of Forestry, Gadjah Mada University, Jl. Sosio Yustisia, Bulaksumur, Yogyakarta 55281, Indonesia
†Corresponding author: [email protected]
ABSTRACT
Forest degradation (FD) is an important component of carbon emissions in many developing countries. According to Cancun agreement, countries are required to develop MRV system that allows to account for FD related loss or gain of carbon stocks. This study assessed the ability of quad-polarimetric L-band Synthetic Aperture Radar (SAR) data and quad-polarimetric SAR features aiming at identifying forest degradation events on tropical peat swamp forests in SE Asia region. The selected study site is on peatland forests in Kampar Peninsula, Riau Province, Sumatera, characterized with different forest disturbance, from forest plantation and oil palm concessions. Radar backscatter data (i.e. HH, HV, VH and VV), SAR polarimetric decomposition features (i.e. alpha angle, entropy and anisotropy), ratio of volume – ground scattering amplitude and combined scattering matrix element values were used as ancillary data of the classification.
Applying maximum likelihood classification (MLC) method, the SAR classification yielded 77.8% of accuracy combining radar backscatter, polarimetric features, ratio of volume-ground scattering (RVOG_mv) and joint elements intensity (span_db). Multi-layer perceptron neural network (MLP-NN) classification outperformed the MLC method in terms of classification accuracy with 79.9% of overall accuracy using a combination of SAR backscatter and multi-spectral Landsat TM bands (Band 4,5,7) in the classification.
Keywords: polarimetric SAR, multi-layer perceptron neural network, SAR classification, forest degradation, multi-spectral Landsat
INTRODUCTION
Avoiding forest degradation (FD) is a part of the mitigation activities defined within REDD+ mechanism (decision 1/CP.16). Forest degradation is an important component of carbon emissions in many developing countries. According to Cancun agreement, countries are required to develop MRV system that allows to account for FD related loss or gain of carbon stocks. Many aspects of forest degradation, however, are still not clear, such as criteria to define degraded forest (should it be based on total carbon stocks or ecological parameters) and land cover or land use systems associated to FD (e.g. shifting cultivation or recovery of secondary logged-over forest).
parameters under dense vegetation [8, 9]. The capability of L-band radar backscatter to penetrate through the forest canopy makes this data is useful for mapping the forest structure, including for above ground biomass (AGB) estimation [9] and hopefully to characterize forest degradation events due to anthropogenic or natural factors. Recent studies confirmed that the empirical AGB models generated from the L-band radar backscatter provide favorable estimation results, especially if the data has dual-polarization configuration. Using dual polarimetry SAR data the backscatter signal is more sensitive to forest biomass and forest stand structure and disturbances because of tree trunk scattering, thus showing better discriminations of different forest successional stages [7, 10, 11]. Therefore, this study would test the ability of quad-polarimetric L-band SAR data and SAR polarimetric features aiming at more accurate identification of forest degradation event over a selected tropical peat swamp forests in SE Asia region.
STUDY AREA
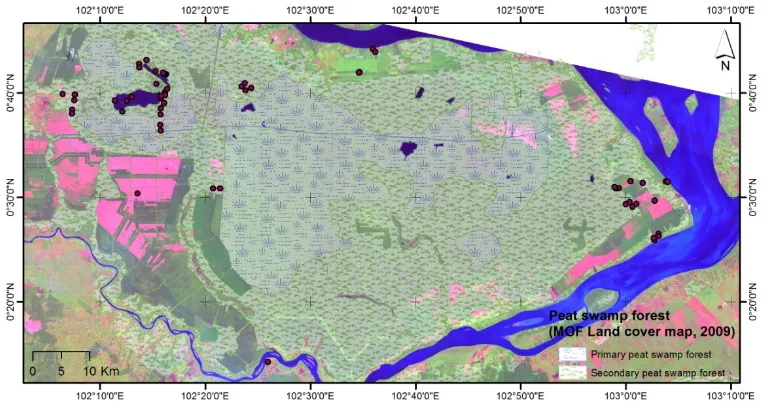
This study focuses on peatland forest ecosystem at Kampar Peninsular, Sumatera, Indonesia, which is geographically located between 101°50’ E and 104°07’ E and between 0°10’ dan 1°14’ N (Figure 1) The Kampar Peninsula is a wetland forest consists of great numbers of natural resources. The area has a size of approximately 700,000 ha, and peatlands in this region are mostly covered with 2-layer forest canopies. Peatlands in this region have depth from 50 cm (very shallow) to more than 20 meter (very deep). The peatland forests in Kampar Peninsula cover 17% of total peatlands in Riau Province (4.044 million ha), and for the entire country this province covers 56% of total 20.5 million ha of peatlands in Indonesia [12].
Figure 1 Color composite of Landsat 8 LDCM data (optical sensor) with band 6,5,4 in RGB channels (background), distribution of sampling plots and peat swamp forests over Kampar (foreground)
Peatlands ecosystem at Kampar Peninsula plays an important role to maintain the stability of tropical peat swamp forests in Indonesia and SE Asia region. Similar to lowland peat swamp forests in Central Kalimantan, peatlands vegetation in Kampar Peninsula are also heavily degraded, deforested and drained, mainly for oil palm and pulp wood plantations. The activities of Asia Pacific Resources International (APRIL) company, a giant private pulp mill factory in Asia, have worsened the degradation of peatland forests over this region as the opening of new pulp wood plantations often compensate the sustainability of peatland forests. Additionally, increasing illegal logging activities by local farmers is also a major problem, particularly after the implementation of decentralization policy in 1999 [13].
SAR Data Preprocessing and Field Data Preparation
One scene of quad-polarimetric ALOS PALSAR data acquired during the end of rain season on May 2010 and Landsat 5 Thematic Mapper (TM) from February 2010 are used to characterize forest degradation event. Calibration of radar backscatter and corrections to other topographic distortions were conducted. Noise filtering to reduce speckle effects is applied using Enhanced-Lee filter. Polarimetric features, i.e. entropy, anisotropy and alpha angle, were generated from the coherency matrices of polarimetric SAR data and plotted against training observation data over degraded peatlands, pristine peatland forest and other land uses to characterize the profiles of radar backscatter in discriminating different peat forests conditions.
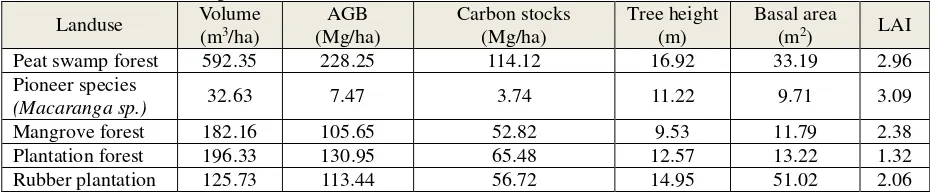
Under REDD+ project conducted in the study area, sampling strategy is explained as follows. Field ground check has collected 80 sampling plots which were averaged from 9, 4 and 2 circular sub plots for natural forest, plantation forests and for oil palm concession, consecutively. The size of each sub plot is 0.04 ha for plantation and natural forests, and 0.25 ha for oil palm concession. These sub plots were established within 60 x 60 meter square areas. Field ground check data was conducted during dry season in 2009 – 2010. In each sampling plot standard tree parameters (i.e. diameter-at-breast height (DBH), commercial tree height, total tree height, number of stems) were measured and tree species information were also recorded. Applying locally-developed allometric equation models, tree diameter data from the plots measurement is converted into carbon above ground biomass. Moreover, Leaf area index (LAI) was measured using hemispherical camera, and converted into LAI value following standard calculation procedure. In each sampling plot, peat thickness was also measured and the soils were sampled to study the concentration of peat and mineral soils.
These field data all together are important to assist characterizing different types of peatland forest degradation and may be used as validation dataset of supervised image classification applied in the study.
Classification of SAR backscatter conducted using supervised classification techniques based on non-parametric Multi-Layer Perceptron Neural Network (MLP-NN) method and the result is compared with that of Maximum Likelihood Classification (MLC). Hence, the classification accuracy is assessed using error matrices and independent test dataset. Attempts to increase the classification accuracy is experimented combining different SAR polarimetric features and also multi-spectral bands of Landsat Thematic Mapper (TM) as ancillary data of SAR classification.
Polarimetric SAR Decomposition
According to the Pauli spin matrix decomposition, symmetric Sinclair scattering matrix of polarimetric SAR data can be presented as follows
[ ]
S =k1[ ]
S sphere +k2[ ]
S diplane( )
0 +k3[ ]
S diplane( )
45In cases dealing with the statistics of fluctuating targets, other formulations, based on well-known, are usually preferred. From Pauli-vectorization above, a coherent matrix [T] can be formulated below
[ ]
Tk k T = ⋅ *
[T] is a 3 × 3 Hermitian matrix which can be readily subjected to standard eigenvalue and statistical analysis, like multi-looking and averaging to obtain a local estimate of [T] from complex, high resolution scattering matrix data,
From such estimates, eigenvectors and eigenvalues of [T] can be estimated like in most applications of radar polarimetry in remote sensing field. Several decomposition approaches based on
eigenvalues of [T] have been developed, in particular the entropy, alpha angle and anisotropy (H, α, A)
decomposition, which has been widely used for classification of land cover, crop, terrain and other remote sensing applications. The entropy (H) which indicates the degree of statistical disorder or pseudo probabilities of the scattering mechanism (pi) is generated using the following equation,
∑
For high entropy values, i.e. over 0.7, a complementary parameter is necessary to fully characterize the set of probabilitie. The anisotropy (A) is defined as the relative importance of secondary scattering mechanism.
Additionally, mean alpha angle (α-angle) is computed as follows.
∑
The α value ~ 0 means that scattering mechanism mainly corresponds to single bounce scattering
from a rough surface, such as from flat surface, α ~ 45° means the volume scattering mechanism, such
as from tree canopy cover, dominates the scattering mechanism and if α ~ 90° the scattering
mechanism is mostly due to double-bounce scattering, e.g. from building or settlement areas.
RESULTS AND DISCUSSION
Field Data
From sampling plots data, we estimate 114 Mg/ha of carbon above ground biomass in the peatland forests, while the first pioneer species dominated with Macaranga sp. has very low carbon stocks of 3.7 Mg/ha. Mangrove forests and rubber plantation have relatively similar carbon stocks of ~50 Mg/ha. Carbon AGB increases following the increase of stand volume, but the LAI does not correspond directly with the AGB (Table 1), as pioneer species in general has higher LAI than other sampled peat forest environments.
Table 1 Field data descriptions
Landuse Volume
Visual observation of ALOS PALSAR and Landsat TM data suggested that land cover types in the study area should include cleared land, degraded peat forest, dense peat forest, mangrove forest, plantation forest, sparse vegetation and water body. These land cover classes were used as a reference for collecting training and test datasets. The two datasets were then employed to train the classification model and validate the classification results, respectively.
SAR Polarimetric Features
1
2
3 4
5
6 7
8
9
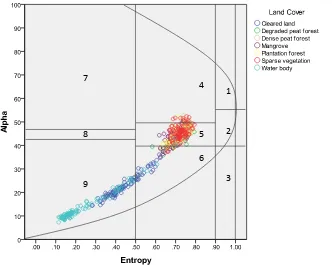
and the figure shows that except for water body and cleared land which are dominated by flat surface scattering (single bounce scattering), the vegetated land cover classes mainly show volume scattering due to random scattering from tree canopy cover. This may partly explain that low carbon biomass represented by low/sparse vegetation has more surface scattering, whereas moderate/higher carbon biomass may be identified from their volume scattering behavior. However, from Figure 2 we could not assess if the application of both polarimetric features could better discriminate different vegetation classes as many of the training data points are falling in the region 5, which characterize the domination of volume scattering mechanism. It has been already well-accepted that vegetation cover represents mainly volume scattering behavior, therefore to better classify different vegetation cover conditions, the use of radar backscatter (sigma nought) and other ancillary data are highly recommended.
Figure 2 Training sample polygons are plotted on alpha angle – entropy plane. The region 1, 4 and 7 represent double bounce scattering. Training data which fall into the region 2, 5 and 8 are mainly dominated by volume scattering, whereas the surface scattering are represented in the region 3, 6 and 9
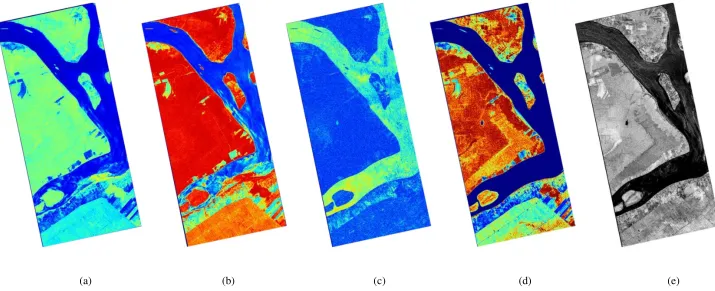
Besides SAR polarimatric features (i.e. alpha angle, entropy and anisotropy), the random volume over ground (RVOG) inversion which measures a realistic scenario of vegetation layer and ground interactions was estimated. Because single layer vegetation thickness could be modeled through scattering particle characterized by a scattering amplitude per unit volume (RVOG_mv). Additionally, joint intensity information of all elements of scattering matrix is calculated from the trace of the scattering matrix, consisting of the addition of the elements from the principal diagonal (span_db).
(a) (b) (c) (d) (e)
SAR Classification Results
The SAR image classification applied a statistical maximum likelihood classification (MLC) and multi-layer perceptron neural network (MLP-NN) method. The MLC method is a statistics classification, where bayesian probability function is calculated from the classification inputs for classes established from the training sites. Each image pixel is then judged as to the class to which it most probably belong. The MLP-NN method applied in this study is a non-statistical classification technique activated using a logistics function and trained using a feed forward back-propagation training algorithm with single hidden layer to classify the SAR multi-looking georeferenced pixels. Te MLP-NN technique may benefit from non-normality behavior of SAR polarimetric data, as this method does not need normality assumption to yield reasonable classification results.
SAR data classification using conventional MLC method show that sigma nought of radar backscatter (i.e. HH, HV, VH and VV) have provided useful information to discriminate densely vegetated ecosystem and cleared forest \ areas. Applying MLC method, the use of only polarimetric SAR properties, such as alpha angle, entropy and anisotropy, could not improve the classification accuracy (Overall Accuracy (OA) = 40.3%, Kappa = 0.30). These SAR properties are useful only if the classification were combined with sigma nought of radar backscatter (OA = 71.9%, Kappa = 0.66). The most accurate classification result, however, were achieved from a joint use of SAR backscatter, polarimetric features, RVOG amplitude and joint intensity information, resulting in 77.8% of overall accuracy and Kappa statistics of 0.73.
On the other side, the MLP-NN classification yielded very low accuracy (OA < 30%, Kappa < 0.2) when additional SAR features (i.e. alpha angle, entropy, anisotropy, RVOG_mv) and especially joint intensity information (span_db) were included in the classification model. Improved classification accuracy was acquired when these additional SAR features, except for joint intensity data (span_db), were combined with SAR backscatter (OA ~ 70%, Kappa ~ 0.64). The highest classification accuracy was achieved through a joint use of radar backscatter and Multispectral bands Landsat data (OA = 79.9%, Kappa =0.75).
Table 2 Overall accuracy (OA) and Kappa statistics of SAR classification results
Classification input MLC NN
OA (%) Kappa OA (%) Kappa
HH, HV, VV 71.7 0.65 65.8 0.58
HH, HV, VH, VV 71.6 0.65 67.1 0.59
Entropy, Alpha, Anisotropy 40.3 0.30 24.6 0.14
HH, HV, VH, VV + H, A, Alpha 71.9 0.66 70.3 0.64
HH, HV, VH, VV + RVOG Mv 72.2 0.66 72.8 0.66
HH, HV, VH, VV + Span_db 71.9 0.66 15.0 0.01
RVOG Mv + Span_db 56.4 0.48 28.9 0.17
HH, HV, VH, VV + H, A, Alpha, RVOG Mv + Span_db 77.8 0.73 60.1 0.51
HH, HV, VV + MS457 75.6 0.70 79.9 0.75
This study found that MLP-NN outperformed MLC technique to classify different forest classes over tropical peatland ecosystem. We also find that for MLP-NN to achieve the highest classification accuracy, addition of redundant input on the classification model will not give contribute to improved accuracy. Whereas, the MLC technique has a trend of improved classification accuracy following the number of input data used in the classification. The formal agreement is that statistical classifier, such as MLC method may suffer from non-normal data distribution, however this study does not seem to show such cases. For MLP-NN classification, feature selection of input data that are useful for the classification would benefit for increasing the classification accuracy. These facts are unfortunately beyond the scope of the present study, and are interesting to further explore.
CONCLUSION
event in tropical peat swamp forests. We found L-Band of quad-polarimetric SAR data may provide useful information to characterize such event. Additionally, the accuracy of SAR classification depends mainly from variations of input data used for the classification, as well as the classification techniques being used. Applying MLC method, the SAR classification yielded 77.8% of accuracy combining radar backscatter, polarimetric features, RVOG_mv and span_db. While, MLP-NN classification is more sensitive to redundant input data, therefore the highest accuracy (79.9%) was achieved applying radar backscatter and multi-spectral Landsat bands in the classification.
ACKNOWLEDGMENT
This work is conducted within Global Comparative Study on REDD+ Project initiated by Center for International Forestry Research (CIFOR) Indonesia and financially supported by Australian Government (AUSAID) and Norwegian Government (NORAD). A.W. would like to gratefully thanks the financial support for this present study. The field measurement data was acquired by colleagues from Gadjah Mada University,Yogyakarta, Indonesia, A.S, W.W and O.K, and therefore we thank them to make the data available for this study.
REFERENCES
[1] A. Luckman, et al., "A study of the relationship between radar backscatter and regenerating tropical forest biomass for spaceborne SAR instruments," Remote Sensing of Environment, vol. 60, pp. 1-13, April 1997 1996.
[2] T. M. Kuplich, et al., "Relating SAR image texture to the biomass of regenerating tropical forests," International Journal of Remote Sensing, vol. 26, pp. 4829-4854, 2005.
[3] J. E. S. Fransson and H. Israelsson, "Estimation of stem volume in boreal forests using ERS-1 C- and JERS-1 L-band SAR data," International Journal of Remote Sensing, vol. 20, pp. 123-137, 1999.
[4] I. Hajnsek, et al., "INDREX II - Indonesian airborne radar experiment campaign over tropical forest in L- and P-band: First results," in International Geoscience and Remote Sensing Symposium (IGARSS), Seoul, 2005, pp. 4335-4338.
[5] M. Isola and S. R. Cloude, "Forest height mapping using space-borne polarimetric SAR interferometry," in International Geoscience and Remote Sensing Symposium (IGARSS), Sydney, NSW, 2001, pp. 1095-1097.
[6] S. Kingsley and S. Quegan, Understanding radar systems, 1st Edition ed.: SciTech Publishing, 1992.
[7] S. S. Saatchi, et al., "Mapping deforestation and land use in amazon rainforest by using SIR-C imagery," Remote Sensing of Environment, vol. 59, pp. 191-202, 1997.
[8] Y. Rauste, "Multi-temporal JERS SAR data in boreal forest biomass mapping," Remote Sensing of Environment, vol. 97, pp. 263-275, 2005.
[9] A. Luckman, et al., "A study of the relationship between radar backscatter and regenerating tropical forest biomass for spaceborne SAR instruments," Remote Sensing of Environment, vol. 60, pp. 1-13, 1997.
[10] K. J. Ranson, et al., "Mapping of boreal forest biomass from spaceborne synthetic aperture radar," Journal of Geophysical Research D: Atmospheres, vol. 102, pp. 29599-29610, 1997. [11] E. Rignot, et al., "Mapping deforestation and secondary growth in Rondonia, Brazil, using
imaging radar and thematic mapper data," Remote Sensing of Environment, vol. 59, pp. 167-179, 1997.
[12] Wahyunto, et al., Distribution of Peatlands and Carbon Stocks in Sumatera and Kalimantan (In Indonesian). Bogor: Wetlands International - Indonesia Programme and Wildlife Habitat Canada, 2005.