________________________________________ † : Corresponding Author
The 11th Asia Pacific Industrial Engineering and Management Systems Conference
The 14th Asia Pacific Regional Meeting of International Foundation for Production Research
Melaka, 7 – 10 December 2010
Decision Support System for Determining Number of Depot to
Distribute Material in the Rattan Furniture Industry by
Considering the Location-Allocation Problem
Yuniaristanto†1, Wahyudi Sutopo2
Laboratory of Logistics System and Business,
Department of Industrial Engineering, Sebelas Maret University Jalan Ir. Sutami No. 36ª, Kentingan, Surakarta, 57126, INDONESIA
E-mail:1)[email protected], 2)[email protected]
Azizah Aisyati
Laboratory of Production System
Department of Industrial Engineering, Sebelas Maret University Jalan Ir. Sutami No. 36ª, Kentingan, Surakarta, 57126, INDONESIA
E-mail: [email protected]
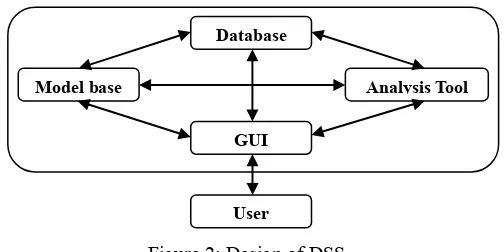
Abstract - In this paper we will develop a spreadsheet-based Decision Support System (DSS) to determine the number of rattan depot and supply allocation to meet the production centers demand with case study in Solo Raya. The DSS incorporates database, model base, analysis tool, and Graphical User Interface (GUI) and user. Databases for storing data, the model base to keep models, analysis tool is required for solving the model and GUI allows users to interact with the database, model base and analysis tool. Data base, the base model and analysis tool are developed using the spreadsheet. The basic idea of the proposed approach is the spreadsheets can be used to build data-driven, model-driven DSS and solver-driven DSS. The model was developed by consider two stages of distribution network, multi commodities of raw rattan, and multi-periods of production plan. The DSS development approaches used in order to government can efficiently make the policy. DSS software interface is designed so user-friendly with point and click application so that users can operate quickly and easily. Users do not need to formulate a mathematical model despite they want to change index values or parameters repeatedly. The test results of case examples provided also give good results, where the software is capable for processing data based on selected model. The DSS is capable for providing location results and the allocation of raw or processed rattan at the depot on minimal total supply chain cost. The result may be a consideration for the policy makers to determine the right location of rattan depot.
Keywords: decision support system, spreadsheet, location-allocation model, rattan industry
1. INTRODUCTION
Decision Support Systems (DSS) have emerged as the computer-based system to assist decision makers address with semi-structured problems by allowing them to access and use data and analytical models. “A decision support system is a system under the control of one or more decision makers that assists in the activity of decision making by providing an organized set of tools intended to impose structure on portions of the decision making situations and to improve the ultimate effectiveness of the decision outcome” (Marakas, 2003). DSS utilize models with internal and external databases, emphasize flexibility, effectiveness, and adaptability. Keen (1988) reviewed the DSS development and concluded that there is a need to balance the three elements of DSS: decision, support and systems.
A DSS uses residing in databases, models it, analyzes it, and assists the users in decision making processes through a graphical user interface (GUI). A DSS can be developed in any environments that support data storage, data analysis, solution methods, and graphical user interface. Decision support systems built using spreadsheet software can be called a spreadsheet-based DSS (Power, 2004). Spreadsheets can be used to build data-driven, model-driven DSS and solver-based DSS. User interface can be created by using macros or Visual Basic Application (VBA). For data-driven DSS data can be imported from the DBMS or text file.
References relate to the use of spreadsheets in DSS applications include: Hanna, et. al (2003) and Bhargava, et. al
The 11th Asia Pacific Industrial Engineering and Management Systems Conference
The 14th Asia Pacific Regional Meeting of International Foundation for Production Research
Melaka, 7 – 10 December 2010
spreadsheets associated with the DSS concept for several decades (Stair & Reynolds, 1999), there are few documented examples of their successful use in small businesses. Little work has been conducted specifically to identify those areas that have not been adapted towards DSS, but showed the potential for an introduction to small business (Duan et. al,
2002). Spreadsheets have been used as decision support tools with a variety of ways. For example, to allocate production resources and combine raw materials in an optimal mix in wood panel industry (Buehlmann, et. al, 2000).
In this paper we will develop a spreadsheet-based DSS to determine the number of raw materials depot and supply allocation to meet the production centers (PCs) demand with case study in Solo Raya. DSS is intended to solve location-allocation problems that have been modeled by Yuniaristanto,
et. al, (2010). In the second section in this paper, we present a description of the distribution network from material supplier to the PCs. The third section will describe the development of DSS for this problem. In the fouth section, we describe how the DSS can be used in practice to determine the location-allocation decision in the case of rattan distribution network. Finally, conclusions and future research directions are presented in Section 6.
.
2. THE APPLICATION PROBLEM
At the present, there are approximately more than 400 furniture and handicraft companies that produce various kinds of furniture such as chairs, tables, cabinets, lockers, and appliances in Sukoharjo (Reichert, 2007). There are about 15 companies belonging to the large scale; 20 companies included in the medium scale category, while the rest are in small scale category. These companies export furnitures and handicrafts of more than 120 containers every month, mainly to Spain, Netherlands, United Kingdom, United States, Australia and some countries in Asia (Sutopo, 2007).
2.1 Problem Descriptions
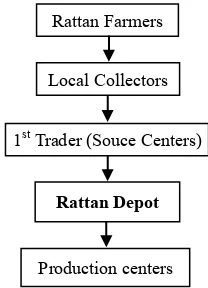
Rattan distribution network from farmer to production centers (PCs) in Solo Raya can be explained in Figure 1 where the design was adopted from Yuniaristanto et. al, (2009). It consists of three main components namely supply side, demand side, and location-allocation center. This relevant system captured trading activities from multiple sources including the farmers, local collector, source centers (SCs), rattan depot, and PCs.
The procurement will be given to the first trader based on total demand of PCs then the raw material supplied will be stored in the depot. Raw rattan will process and distribute to PCs according to their demand. The demand of PCs is dynamic for years. During this time horizon is possible to open or close the depot that has been selected. If there is a
depot which was opened, it will emerge the depot fixed costs.
Figure 1: An overview of the rattan distribution network.
2.2 Mathematical Models
This model purposes to determine the depot location and raw rattan allocation each depot by considering inventory, depot and supply capacity. The mathematical model used is reference to Yuniaristanto, et. al, (2010). Decision variables in the dynamic location-allocation model as follows:
Xijt The total volumes of raw rattan that is shipped to
po-tential depot j from potential supplier i in period t,
Yjknt Indicate 1 if semi-finished rattan n is delivered from
opened depot j to PCs k in period t and 0 otherwise,
gjt Indicate 1 if the potential depot j is open and 0 otherwise, Ajnt The total volumes of semi-finished rattan n that is
processed at depot j in period t,
jt
B The on-hand stock of raw rattan at depot j in period t,
jt
B The shortage of raw rattan at depot j in period t,
njt
I The on-hand stock of semi-finished rattan n at depot j in period t,
njt
I The shortage of semi-finished rattan n at depot j in period t.
Parameters:
Cbit Procurement cost of raw rattan from supplier i in period t. Ctijt Transportation cost of raw rattan from supplier i to depot j in
period t.
Ctjknt Transportation cost of semi-finished rattan n from depot j to
production center k in period t.
Cpjnt Processing cost of semi-finished rattan n at depot j in period t Hjt Holding cost of raw rattan at depot j in period t.
Ejt Shortage cost of raw rattan at depot j in period t
Hjnt Holding cost of semi-finished rattan n at depot j in period t. Ejnt Shortage cost of semi-finished rattan n at depot j in period t Fjt Fixed cost of depot j in period t.
Wjt Holding capacity of depot j in period t. Sit Supply capacity of supllier j in period t. ajt Reopening cost of depot j in period t.
Rattan Farmers
Local Collectors
Rattan Depot
Production centers
The 11th Asia Pacific Industrial Engineering and Management Systems Conference
The 14th Asia Pacific Regional Meeting of International Foundation for Production Research
Melaka, 7 – 10 December 2010
The problems is to select a depot location which will be opened, determine the total volume of raw rattan that should be delivered from the suppliers to depot and the total volume of raw rattan are processed in depot and the total volume of semi-finished rattan which should be distributed from the depot which is opened to PCs. Model can be formulated as costs of raw rattan from suppliers to the depot and from depot to PCs, inventory costs, processing costs, fixed costs of depot and reopening and closing costs. The constraint (1) ensures that each supplier is shipped raw rattan under their capacity. The constraint (2) represents the capacity restriction of potential depots. The constraint (3) ensures that we locate at most Wt depots. Equation (4) guarantees that each PCs is only
connected to one depot. Equation (5) sets a balance between the raw rattan processed to stock of raw rattan. Set equations (6) – (9) ensure that the stock of processed rattan is sufficient to fulfill PCs demand. Constraint set (10) enforces the binary number of the decision variables and constraint equation (11) enforces the non-negativity restriction on the decision variables used in the model.
3. DSS DEVELOPMENT
DSS is specifically built to assist the decision maker determine the location and allocation of raw rattan inventory by considering each depot, the depot capacity constraints and supply capacity, so that the system developed: (1) based on the user's mental model, (2) does not require any knowledge about programming mathematically to operate, (3) can be used via the simple point-and-click, (4) having input and output procedures; (5) can be operated from a personal computer with Microsoft Windows operating system, (6) utilize the features and functions of Risk Solver and VBA; (7) flexible, easy to modify and easier to maintain. During the early development of the DSS sought to the above requirements can be met by the software.
Figure 2: Design of DSS
The 11th Asia Pacific Industrial Engineering and Management Systems Conference
The 14th Asia Pacific Regional Meeting of International Foundation for Production Research
Melaka, 7 – 10 December 2010
this DSS software, users are allowed to input and/or edit the necessary data on the location-allocation problem.
Figure 3: Home page of the DSS software
Home page of the DSS software can be seen in Figure 3. To fill in values of model parameters, the user can click on the
Start button. Display data input can be seen in the figure 4-6. First, the user can input data such as number of products, the number of potential depot, the number of PCs, the number of suppliers and the number of period (see fig. 4).
Fig 4: Dialog box for indexes Fig 5: Dialog box for cost parameters
Figure 6: Dialog box for input the transportation costs
Then the user can input the required indexes (see Fig 5). Each parameter selected, the user may input the parameter value as an example for inputing data of transportation cost from the source center to rattan depot as shown in Figure 6. After all parameters are input, the user can return to the Solver form and clicking Solver button (see Fig 5).
Example Case
Data input is adopted from Yuniaristanto et. al. (2010) that obtained from Indonesia Furniture Association, Industrial and Trading Department of Sukoharjo and Surakarta Regencies, and Rattan Industries in Solo Raya. There are five SCs that supply the raw rattan to potential depot such as South Borneo, Central Borneo, East Borneo, Makassar, and Gorontalo. Rattan depot will processed raw rattan and stored it in depot. There are five potential depot among Grogol, Baki, Trangsan, Tembungan and Luwang. There are four types of processed rattan which used by the PCs namely stem, core, fitrit and peel. Processed rattan will be delivered to six of PCs involve Grogol, Baki, Trangsan, Tembungan, Luwang and Kartosuro.
In this case, we assume that the demand of PCs will increase 10% per year, a planned capacity of each depot is 18,000 tons per year and all costs increased 7.2% every year which is affected by inflation .
4. ANALYSIS AND DISCUSSION
DSS development approaches used in this paper represent an effort to make the implementation and use of DSS in the government policy will be more efficient. Recognized that effective DSS is intended for semi-structured problem, using a model with internal and external databases, and emphasize flexibility, effectiveness and adaptability. The introduction of this system within government requires various efforts to solve the non-technical obstacles that exist, such as limited resources, poor knowledge about information technology and mathematical programming. This tends to create resistance to use quantitative models for decision-making. To overcome these obstacles, the DSS software developed is very helpful because it can be used directly on the personal computers are widely available and affordable.
The 11th Asia Pacific Industrial Engineering and Management Systems Conference
The 14th Asia Pacific Regional Meeting of International Foundation for Production Research
Melaka, 7 – 10 December 2010
Based on these data have been input into the DSS software, solution values of selected locations are shown in Table 1 by active report. Depot at Luwang must be opened and operated at the beginning to the end of the planning period, while the Depot at Baki will be opened at the second
year as increasing the demand from PCs which cannot be fulfilled by a depot at Luwang.
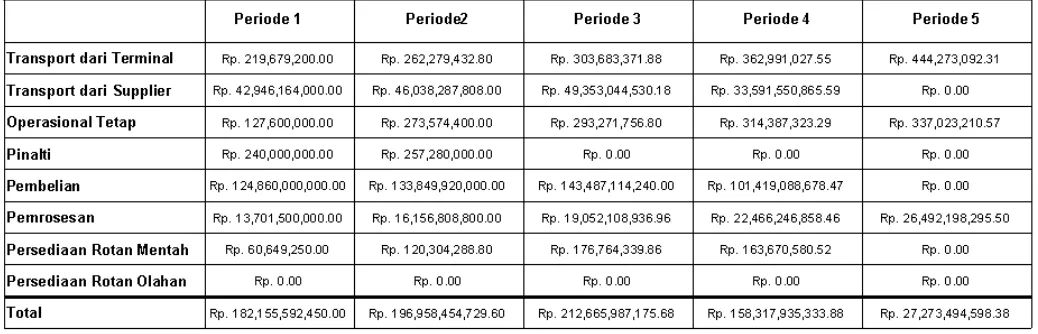
Based on the existing decision variables in the model, we can be calculated, each cost component and the total supply chain costs and the results indicated at Table 2.
Table 2: Total supply chain cost (million Rp)
In Table 2, it can be seen that in the first year to fifth years will increase the cost component of supply chain. This occurs due to the assumptions: demand rate is 10% per year and inflation rate is 7.2% per year. In the fourth and fifth year, total supply chain costs decreased due to allocation to the depot decrease so that the procurement cost and transportation costs from suppliers will decrease too.
DSS software interface is designed so user-friendly with point and click application so that users can operate quickly and easily. Users do not need to formulate a mathematical model despite they want to change index values or parameters repeatedly. In addition, there are functions and operations in this software which adopted from MS Office, so it is familiar to most users. But it still needed supervision so that users are accustomed to use the DSS software.
5. CONCLUSION
Through a case study, this paper uses a spreadsheet approach to develop DSS that will be used for policy makers. The basic idea of the proposed approach is the spreadsheets can be used to build data-driven, model-driven DSS and solver-driven DSS. While the user interface can be developed with VBA is already integrated with MS-Excel. User interfaces can be designed, user-friendly, making it easier and speed up the user in using the software.
The test results of case examples provided also give good results, where the software is capable of processing data based on selected model. DSS is capable of providing location results and the allocation of raw or processed rattan at depot on minimal total supply chain cost. The result may
be a consideration for the policy makers to determine the right location of rattan depot.
With the benefit of the DSS software, it can be made more precise analysis in determining the location and allocation for another areas or another products. For the future development of this DSS is needed to develop algorithms or meta-heuristic approach to speed up the time processing of selected model. So that it can be used for many cases which consider the large scale mathematical models.
ACKNOWLEDGMENT
The authors are grateful to the anonymous referees for the comments and recommendations that improve the paper. This research was partially funded by the DGHE, Ministry of National Education, Republic of Indonesia in HIBAH BERSAING Program FY2010.
REFERENCES
Bhargava, H. K., Sridhar, S. and Herrick, C. (1999). Beyond spreadsheets: Tools for building decision support systems. IEEE Computer, 32(3), 31-39.
Buehlmann, U., Ragsdale, C. T. and Gfeller, B. (2000). A spreadsheet-based decision support system for wood panel manufacturing. Decision Support Systems, 29(3), 207-227.
The 11th Asia Pacific Industrial Engineering and Management Systems Conference
The 14th Asia Pacific Regional Meeting of International Foundation for Production Research
Melaka, 7 – 10 December 2010
Hanna, M. M., Ahuja, R. K. and Winston, W. L. (2003).
Developing spreadsheet-based decision support systems using VBA for Excel. Gainesville, USA: Innovation Center.
Keen, P.G.W. (1988) Decision Support Systems: the Next Decade, Decision Support systems 3, pp. 253-265.
Marakas, G. M. (2003), Decision Support Systems in the 21st Century, Prentice Hall.
Power, D. J. (2004), "A Brief History of Spreadsheets",
http://dssresources.com/history/sshistory.html, Access date: 15 June 2010
Reichert, C. (2007). Rattan Furniture Value Chain Promotion in the Solo Region, Central Java, Indonesia. GTZ-RED, Jakarta
Stair, R. M. and Reynolds, G. W. (1999). Principles of information systems (4th ed.). USA, Course Technology-ITP.
Sutopo, W., (2007). Mapping of Global Logistics Operating Systems in Indonesia: Rattan Industry Case Study, Working Paper, Dept. of Industrial Engineering, Univ. of Sebelas Maret.
Yuniaristanto, Sutopo, W., and Aisyati, A. (2009). A Facility Location-Allocation Model for Distributing Raw-Rattan Material To Increase the Rattan Industry Competitiveness: A Case Study. Proceedings the 5th International Intelligent Logistics System Conferences,
116.1– 116.7. (September 27th - 30th 2009, Gold Coast, AUSTRALIA).
Yuniaristanto, Sutopo, W., Aisyati, A. and Andreadi, P. W (2010). A Facility Location-Allocation Model for Determining Number of Depot to Distribute Material in the Rattan Furniture Industry, Working Paper in Indonesia, Laboratory of Logistics System and Business, Department of Industrial Engineering, Sebelas Maret University.
AUTHOR BIOGRAPHIE
YUNIARISTANTO is a lecturer in Department of Industrial Engineering, Faculty of Engineering, University of Sebelas Maret. He obtained his Bachelor’s degree in Industrial Engineering from Sepuluh Nopember Institute of Technology in 1999 and Master’s degree in Industrial Engineering and Management from Bandung Institute of Technology in 2002. His research interest is at logistic systems, supply chain modeling and simulation games. He can be reached at
W. SUTOPO is currently an assistant professor in the Department of Industrial Engineering, Sebelas Maret University. He received a B.S. in Industrial Engineering from Bandung Institute of Technology in 1999 and a M.S. in Management Science from the University of Indonesia in 2004. Prior to joining Sebelas Maret University in 2003, he spent 4 years in PT. Panasonic Manufacturing Indonesia (was PT. Panasonic Gobel). He has research interests covering Logistics Systems and Supply Chain Management, Industrial Engineering Education, Performance Measurement System and Cost Analysis & Estimation. He can be reached at
A. AISYATI is a lecturer in Department of Industrial Engineering, Faculty of Engineering, University of Sebelas Maret. She obtained her Bachelor’s degree in Industrial Engineering from Sepuluh Nopember Institute of Technology
in 1995 and Master’s degree in Industrial Engineering and