introduction
Chromium is a metal that occurs in oxidation states, ranging from +2 to +6. However, as far as environmental protection is concerned, only the two most common oxidation states, namely Cr(III) and Cr(VI), need to be considered. Cr(III) and Cr(VI) are drastically different in physicochemical properties as well as chemical and biochemical reactivities. Cr(III) is well-known as an essential trace element for humans, required for the maintenance of normal glucose, cholesterol and fatty acid metabolism. On the other hand, water-soluble Cr(VI) is highly toxic to humans and animals,1 and other studies have indicated that it is an extremely toxic carcinogen.2
Several types of wastewater, such as those discharged in the course of dye, pigment and leather production, and by the process of plating and electroplating and by mining may contain undesirable amounts of Cr(VI).3 In principle, because the health effects are determined largely by the oxidation states, different guideline values for Cr(III) and Cr(VI) should be derived. However, current analytical methods and the variable speciation of chromium in water favor a guideline value for a total chromium of 50 µg dm–3.4–6 If simple, sensitive and rapid analytical techniques selective for trace Cr(VI) are applicable to various environmental samples, the situation can be improved.
Although atomic spectrometries, such as flame atomic
absorption spectrometry (FAAS), inductively coupled plasma–atomic emission spectrometry (ICP-AES) and inductively coupled plasma–mass spectrometry (ICP-MS) are sensitive and selective for Cr, only the total amounts of Cr can be determined despite the fairly expensive equipment. Solid-phase spectrophotometry (SPS) is based on the direct spectrophotometric measurement of a solid phase that has sorbed a sample component. This method made it possible to determine trace components in natural and other water samples without preconcentration, because a sensitivity enhancement was easily accomplished by increasing the sample volume.7,8 By employing diphenylcarbazide (DPC) as a coloring agent, SPS selective for Cr(VI) has also been developed.9
In the case where the distribution ratio of the sample species is high enough for complete adsorption, the absorbance of the target colored analyte species in the solid phase (ARC) can be expressed as Eq. (1) if the analyte, whose concentration (C0) in a V cm3 sample solution is concentrated into v cm3 of the solid phase,
ARC = εRCC0lRCV/v, (1)
where εRC is the molar absorptivity of the colored species and
lRC the light path length in the solid phase. Alternative ways to enhance the sensitivity of SPS by using a smaller volume of the sample solution is to apply a larger lRC and/or smaller v systems. As described in a later section, the use of a black flow-through cell in which a small volume of solid particles is packed as an adsorbent for the target chemical species is very effective for 2009 © The Japan Society for Analytical Chemistry
† To whom correspondence should be addressed.
E-mail: [email protected]
improved solid-phase spectrophotometry for the
microdetermination of Chromium(Vi) in Natural Water
sulistyo s
aPUTRO,*
1Kazuhisa Y
OsHimURa,*
2†shiro m
aTsUOKa,*
3Kô T
aKEHaRa,*
2and Narsito*
4*1
Department of Mathematics and Natural Science Education, Faculty of Teacher Training and Education
Sciences, Sebelas Maret University, Surakarta-57126, Indonesia
*2
Department of Chemistry, Faculty of Sciences, Kyushu University, Hakozaki, Higashi,
Fukuoka 812–8581, Japan
*3
Department of Environmental Science, Faculty of Science, Niigata University, Ikarashi,
Niigata 950–2181, Japan
*4
Department of Chemistry, Faculty of Mathematics and Natural Sciences, Gadjah Mada University,
Yogyakarta-55281, Indonesia
A simple and sensitive solid-phase spectrophotometry procedure was improved for the microdetermination of Cr(VI). A 0.06 cm3 portion of a cation exchanger, Muromac AG 50W-X2, was used to concentrate the target Cr(VI) in a 20 cm3 water sample, and resin beads were introduced in a flow cell of 1.5 mm diameter and having a 10 mm light path length for measurements using a UV-visible spectrophotometer. Three lenses were used for focusing the incident light beam and for recovering light scattered by the solid phase in the cell. The sensitivity achieved was higher by a factor of 277 compared with that of the solution method, and the detection limit was 0.014 µg dm–3. The recovery on spiked real water samples by the standard addition method was 96 – 101%. Favorable working and performance characteristics made it possible to directly determine sub-µg dm–3 amounts of Cr(VI) in natural water samples.
higher sensitivity. However, different from conventional solution spectrophotometry, SPS basically suffers from weak light intensities due to light scattered by the solid phase.10 In addition, attenuation of the incident light intensity by a black flow cell also has to be considered if the area of the incident light beam is wider than that of the light-path portion of the black flow cell. For this reason, it is necessary to make some improvement in the equipment or the light measurement system to reduce the background light attenuance by the solid phase and the cell, and this makes it difficult to apply this SPS method widely to various trace analyses.
The aim of this study was to develop and evaluate a simple and sensitive solid-phase spectrophotometric batch method using a commercially available, simple spectrophotometer, which would be applicable to the determination of sub-µg dm–3 amounts of Cr(VI) in natural water samples or drinking water. The most interesting features of the improved method are simplicity in operation, high sensitivity and fast application without any previous sample treatment including many laborious steps. This paper reports on the main characteristics of this improved method and the optimum experimental conditions, as well as the analytical application of the improved method to natural water samples.
Experimental
Reagents
All reagents used were of analytical grade. Highly purified water prepared with a Milli-Q SP system (Millipore, Milford, MA) was used throughout. A standard Cr(VI) solution (1000 mg dm–3) for atomic absorption spectrometry (Kishida, Osaka, Japan) was used. A sulfuric acid solution (about 0.5 mol dm–3) was prepared by diluting 6.8 cm3 of concentrated sulfuric acid with water up to 250 cm3. A coloring reagent solution was prepared by dissolving 0.25 g of DPC
(diphenylcarbazide, Wako, Osaka, Japan) and diluting to 100 cm3 with acetone. A calcium solution (2000 mg dm–3) was prepared by dissolving 0.74 g of CaCl2·2H2O (Kishida) in 100 cm3 of water. A sodium chloride solution (1 mol dm–3) was prepared by dissolving 5.84 g of NaCl (Wako) and diluting to 100 cm3 with water. A standard solution of NaOH (0.1 mol dm–3, Wako) was used for acid-base titration of the ion exchanger. A Muromac 50W-X2 cation exchanger (100 – 200 mesh, Muromachi, Tokyo, Japan) was used.
Apparatus
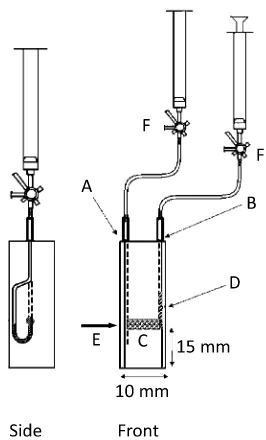
Absorbance measurements were made with a double-beam UV-visible spectrophotometer (Model V-630, Jasco, Tokyo, Japan). A flow cell Model FLM 220B-B-1.5 (Fig. 1) was supplied from GL Science (Tokyo, Japan). It was black-sided, 10 mm in length and 1.5 mm in diameter. At the outlet of the cell, a polytetrafluoroethylene (PTFE) tube (1 mm i.d.) was connected to a silicone tube. Inside the end of the tube, a polypropylene (PP) filter tip was placed so as to block the ion-exchanger beads in order to pack them in the light-path portion. At the sample light beam, a cylindrical convex lens (focal distance 25.4 mm, Sugitoh, Tokyo, Japan) and a concave lens (focal distance –200 mm, Sugitoh) were placed between the incident light window and the cell for focusing the light beam at the light-beam entrance of the cell, and the lens (Jasco) at the detector window for recovering the scattered light. A diagram of the cell holder for the determination of Cr(VI) is shown in Fig. 2.
The ion exchanger was measured with an ion-exchanger aliquotting device. A PTFE tube (1.0 mm i.d. and 7 cm long) was fitted on one side with a PP resin filter tip and connected to a 10 cm3 disposable syringe.11
Collection of natural water samples
Natural water samples (from No. 1 downstream to No. 7 upstream) were collected from a surface stream of the Ochozu Experimental Watershed in Fukuoka Experimental Forest, Kyushu University, in a mountainous watershed of Japanese cypress located about 15 km east of Fukuoka City in western Japan. The predominant forest soil is yellow-brown, and the underlying bedrock consists of serpentinite containing chromite Fig. 1 Black flow cell for SPS. A, Inlet of the black cell connected
to a 10-cm3 PE syringe (SS-10SZ, Terumo) using PTFE and silicone tubes; B, outlet of the black cell with inserted PTFE tube; C, light path which is filled with ion-exchange resin (1.5 mm i.d. 10 mm long); D, PP filter tip; E, incident light beam; F, three-way stopcock.
and chlorite schist.12 Water samples No. 8 and No. 9 were collected from a surface stream near Ochozu Experimental Watershed with a different geological condition. Water samples No. 10 and No. 11 were collected from Karst springs on Hirao-dai plateau, Kitakyushu, Fukuoka. Water samples were also collected from the Central Java Province, Indonesia. Tlatar (Tl) and Ngabean (Ng) are natural groundwater sources that flow continuously, and are located at about 7 and 10 km, respectively, from Boyolali, Central Java (near the Merapi volcano). Tawangmangu (Tw) is a natural waterfall at 1100 m in altitude, covered with forest, and located 30 km from Surakarta, Central Java. The underlying bedrock consists of volcanic rocks with lava and andesite breccias. The natural water was filtered through a 0.20-µm membrane filter at the site and stored without being acidified in a polyethylene (PE) bottle for Cr(VI) determination. For total chromium determination, the sample was stored in a PTFE bottle, and 1 cm3 of highly purified nitric acid (Kishida, Japan) was added to a 100-cm3 sample in order to avoid the adsorption of Cr(III) on the container wall. The pH and temperature of the water sample were measured with a pH meter (HM-14P, TOA DKK) at the sampling point, and the dissolved organic carbon (DOC) content was measured with a TOC apparatus (TOC-VE, Shimadzu).
Determination of Cr(VI) by means of SPS
To a 20 cm3 water sample containing 1.0 cm3 of a 2000 mg dm–3 Ca2+ solution, 1.0 cm3 of a H
2SO4 solution and 0.5 cm3 of a coloring agent solution, 0.06 cm3 of the ion exchanger was added using an aliquotting device, and the mixture was stirred for 20 min at 20 C. After allowing the ion exchanger to settle, the supernatant solution was removed, and about 1 cm3 of the mixture was transferred into a disposable PE syringe (SS-10SZ, Terumo, Tokyo, Japan) connected to a flow cell, as shown in Fig. 1. The absorbances were directly measured at 540 nm (absorption maximum wavelength) and 700 nm (non-absorption wavelength), and the difference between the two absorbances was used for Cr(VI) analyses. After the absorbance measurement, the ion-exchanger beads were removed from the cell for the next measurements.
Analytical method for total chromium
The total chromium concentration of the natural water samples was determined with an ICP-MS Agilent Model 7500cx (Yokogawa, Japan).
Results and Discussion
Improvement of the spectrophotometer for SPS
As shown in Eq. (1), an effective way to enhance the sensitivity is to employ a smaller v and/or longer cell systems. On the other hand, these systems may involve a difficulty in packing ion exchanger beads in a cell and/or exceed the limit of detection by the light detector used. Therefore, we made some improvement in the spectrophotometer, as shown in Fig. 2. The cell was placed at the nearest position to the light detector of a silicon photocell, and the sample light beam was adjusted to focus at the flow cell using a cylindrical lens (focusing length of 25.4 mm, Sugitoh, Japan) and a convergence lens (focusing length of –200 mm, Sugitoh). The optimum position of the cell was adjusted using an XY stage (TASB-402, Sigma Koki, Tokyo) attached the cell in order to obtain the strongest light intensities. A commercially available lens (Jasco, Japan) for recovering the scattered light from the cell was also installed at the detector window of the spectrophotometer. The achievement of the light measurement improvement is shown in Table 1 as the decrease in the background attenuances of the ion exchanger packed in the flow cell. Without using lenses, the background attenuances were over 4, and by using a cylindrical convex lens and a concave lens at the sample light beam, the values were reduced to around 2. Background attenuance values of around 1.7 were achieved when a commercially available lens (Jasco) was also used. Both the focusing lens and the recovery lens are very effective for reducing the background attenuances of the flow cell and the ion-exchanger beads. The cell was connected to a 10-cm3 disposal syringe (SS-10SZ, Terumo, Japan) with a PE three-way stopcock for introducing colored ion exchanger beads in the cell, which could make the operation in the solid phase absorbance measurements simple, easy and reproducible.
Optimization of SPS for microdetermination of Cr(VI)
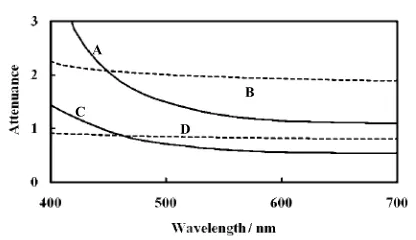
Type of ion exchanger. Polystyrene-type ion exchangers were appropriate for the determination of Cr(VI) using the present SPS. In the case of cross-linked dextran ion exchangers, it was difficult to measure the light absorption due to the high background absorbance. Therefore, a Muromac 50W-X2 cation exchanger (100 – 200 mesh) was used. Figure 3 shows the differences in background attenuation spectra of the two types of ion exchangers. It was clear that by using Muromac 50W-X2, the background absorbances were lower than those of SP-Sephadex C-25 cation exchanger. On the other hand, Muromac 50W-X2 also had a limitation, especially if absorbances at wavelengths lower than 460 nm had to be Table 1 Improvement of the light measurements by SPS using
lenses
A540nmc A700nmd ∆Ae
Without lenses With the lensesa;
without the Jasco lensb
With the lenses; with the Jasco lens
Over 4 2.434 2.382 2.312 1.931 1.936 1.924
Over 4 2.238 2.175 2.101 1.732 1.738 1.726
— 0.196 0.207 0.211 0.199 0.198 0.198
a. For focusing the incident light beam on the flow cell. b. For recovering the scaterred light from the cell.
c. Absorbance at the wavelength characteristic of colored species. d. Absorbance at the wavelength which the sample species does not absorb.
e. The difference between the two of absorbances.
The light measurements were done against air. Cell: 1.5 mmf, 10 mm long. Ion exchanger: Muromac AG 50W-X2, 100 – 200 mesh.
measured. In this case, SP-Sephadex C-25 could still be used.
Diameter of the black flow cell. Figure 3 also shows that a 3-mm diameter cell provides a lower attenuance background than that of a 1.5-mm diameter cell. When the attenuance exceeds 2, it is recommended that the 3-mm diameter cell be used, although the sensitivity is decreased. To balance the light intensities between the sample beam and the reference beam, a light attenuation disk of 0.4 or 1.0 absorbance unit, Hitachi (Tokyo, Japan) was placed in the reference beam.
Aliquotting of cation exchanger. For precise aliquotting of a small amount of ion-exchanger beads, a device made of a PTFE tube was used.11 In order to use a very small amount of resin with high reproducibility, the device was made with a PTFE tube 1.0 mm i.d. and 7 cm long. The ion exchanger was collected into the tube with a disposal syringe. One side end connected to the syringe had an inserted polypropylene filter tip. The wet volume of the ion-exchanger used in the device was determined by titration. The H+ ion of 1.32 cm3 of the resin packed in a column was exchanged with Na+ by passing a 1 mol dm–3 NaCl solution through the column, and the H+ in the effluent solution was titrated with a standard NaOH solution. An aliquotted ion exchanger was also titrated with the same standard solution, and the volume of wet ion exchanger beads could be estimated. The reproducibility of the aliquotting of the ion exchanger beads was determined by this method to be 0.0600 ± 0.0008 cm3, with a relative standard deviation (RSD) of 1.4%, which included the titration error.
Time dependence of color development. The effect of the stirring time on the adsorption of the purple species on the cation exchanger is shown in Fig. 4. The color development of the resin was influenced by the stirring time. In this experiment, the stirring time was fixed at 20 min. The absorbance of the adsorbed purple color species was nearly constant in the temperature range 10 – 30 C.
Effect of co-existing ions. As has already been demonstrated in SPS with DPC as the coloring agent,9,13 metals such as V(V), Cr(III), Mn(II), Co(II), Ni(II), Zn(II), Mo(VI), Cd(II), Sn(IV), Hg(II) and Pb(II) do not interfere when present up to 1000-times the concentration of Cr(VI). In the case of Cu(II), its presence at 10-times the concentration of Cr(VI) is tolerable.
The presence of divalent cations, such as Ca2+ in real water samples, caused higher background attenuance (A700nm, i.e., the attenuance at 700 nm) than that of a standard solution in the absence of divalent cations, as shown in Table 2. A background attenuance change due to shrinkage of the cation exchanger in the cell is often observed13,14 when polyvalent cations are adsorbed. The resin particles shrink when the counter ions are exchanged with divalent cations, which causes an increase in the
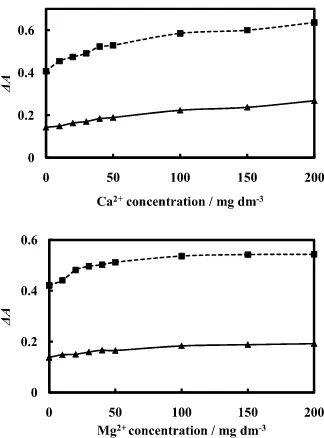
amount of resin in the cell, and also in the effective light path. In this paper, the effect of the concentration of divalent ions common in natural water, Ca2+ and Mg2+, was studied (Fig. 5). The existence of Ca2+ showed a larger effect in producing a higher background attenuance compared to that of Mg2+. This phenomenon was due to the higher selectivity of Ca2+ than that of Mg2+. It is effective to add Ca2+ in constant excess to suppress any change in the amounts of the ion exchanger in the light path (Table 2).
Fig. 4 Effect of stirring time on color development at 20 C. Sample, 1 µg dm–3 Cr(VI), 20 cm3; ion exchanger, Muromac 50W-X2, 0.06 cm3; ∆A = A
540nm – A700nm.
Fig. 5 Effect of coexisting Ca2+ and Mg2+ on solid-phase absorbance measurements. , Blank; , Cr(VI) 1 µg dm–3; ∆A = A
540nm – A700nm. Table 2 Effect of adding an excess of Ca2+ in the analysis of natural water samples
Cr(VI)/µg dm–3 A
540nma A700nmb ∆Ac Cr(VI)/µg dm–3
Without adding 100 mg dm–3 Ca2+ 0
0.5 1.0 2.0 Tw-1 sample
1.525 1.605 1.729 1.954 1.828 1.801 1.794
1.373 1.329 1.330 1.335 1.630 1.616 1.617
0.152 0.276 0.399 0.619 0.198 0.185 0.177
0.20 0.14 0.11 With adding 100 mg dm–3 Ca2+
0 0.25 0.5 1.0 Tw-1 sample
2.023 2.051 2.177 2.343 2.102 2.093 2.119
1.828 1.781 1.818 1.822 1.889 1.881 1.904
0.195 0.270 0.359 0.521 0.213 0.212 0.215
0.06 0.06 0.07
a. Absorbance at the wavelength characteristic of colored species. b. Absorbance at the wavelength which the sample species does not absorb.
c. The difference between the two of absorbances.
Calibration and sensitivity the corresponding solution method, a 1 mg dm–3 Cr(VI) solution showed an absorbance of 0.704, and therefore the sensitivity achieved was 277-times higher for a sample volume of 20 cm3 than that of the solution method. The respective theoretical value of the sensitivity enhancement estimated by the ratio V/v
was 333-times that of the solution method, which was in fairly good agreement with the obtained results.
Precision and detection limit
The precision was measured with samples of Tw from Tawangmangu, Karanganyar, Central Java province, Indonesia and No. 10 from Mizutori-no-ana spring, Hiraodai plateau, Fukuoka, Japan. Using the standard addition method, the concentrations of Cr(VI) were 0.04 ± 0.006 (n = 5) for the sample Tw-2 and 0.34 ± 0.03 (n = 5) for sample No. 10, with a
recovery of 96 – 101% (Table 3). The relative standard deviations for five measurements were 15 and 8.8%, respectively, due to their low concentrations. However, the Cr(VI) from 0.61 to 4.72 µg dm–3 in water samples from the Ochozu Experimental Watershed was determined with an RSD of less than 5% (Table 4). It is clear that the recovery for each sample solution was acceptable, although these samples contain cations such as magnesium and calcium ions at 20 mg dm–3 levels.
In order to determine the detection limit, a blank signal was repeatedly measured. When the detection limit is defined as the concentration that gives an absorbance corresponding to 3σ for the standard deviation of fluctuation of the blank, the value was 0.014 µg dm–3 (n = 5) for 20 cm3 samples. The concentration level of Cr(VI) below 1 µg dm–3 could be effectively determined by the developed method.
Applicability of this method
The combination of SPS for Cr(VI) and ICP-MS for the total Cr made it possible to carry out speciation of the dissolved Cr in water. Except for the Ng sample, the predominant species of dissolved Cr was Cr(VI). For water samples from the Ochozu Experimental Watershed, serpentine containing chromite is distributed in the studied area and the samples contained slightly higher Cr(VI) concentrations than those of other areas of granite and limestone.15 We could not find any relationships between the [Cr(VI)]/[Cr(III)] ratios and the pH values or the concentrations of DOC. A further study is necessary to clarify the source of Cr(III) for the Ng sample.
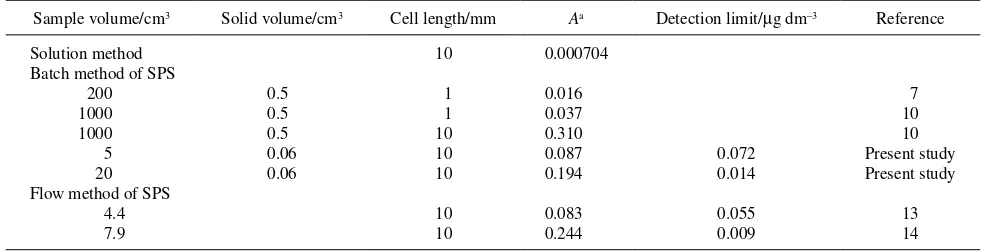
As shown in Table 5, the sensitivity of the present method is the highest among those of previous batch methods if the sample volume is the same. There is a limitation of the batch method, especially in packing all of the ion exchanger into the light-path portion in the black cell; however, a 0.06-cm3 ion exchanger, a three-times volume of the light-path portion was enough to get high sensitivity and reproducibility. The sensitivity is comparable between the present method and the flow method of SPS,13,14 but the present batch method is easy to set up and simple in operation without any pumps or other accessories for the flow system. The flow method may be convenient for the routine analysis of many samples, but the present method can be as an alternative for laboratory use.
The improvement of this method using another type of double-beam spectrophotometer was done with a Shimadzu UV 1601 PC spectrophotometer. A focusing system using cylindrical convex lenses (50 and 60 mm in focus) and convex lenses (25.4 Table 3 Standard addition method in Cr(VI) determination for
natural water by SPS
a. Tawangmangu waterfall, downstream of Tw-1, Karanganyar, Central Java, Indonesia.
b. Mizutori-no-ana spring, Hiraodai Karst plateau, Fukuoka.
Table 4 Analytical data for Cr(VI) and Cr(III) in natural water samples
Sampling site Date pH Water temp./ C DOC/mg dm–3 Cr(VI)/µg dm–3 Cr(III)/µg dm–3
and 40 mm in focus) also gave lower background absorbances, and made it possible to analyze Cr(VI) in natural water samples.
Conclusions
The favorable operation and performance characteristics of the improved procedure of the SPS method made it possible to determine Cr(VI) at sub-µg dm–3 to µg dm–3 levels in natural water within 20 min. As shown in Table 5, the use of a narrow black-sided cell could reduce the amount of required ion-exchange material, and a higher sensitivity could be obtained by using a smaller amount of sample solution. The procedure is simple and easy in operation. An improvement in any less-expensive spectrophotometers can be achieved along with the basic idea shown in this paper, which will extend the SPS to other wider demands for trace analyses.
acknowledgements
The authors would like to thank Prof. Kyoichi Otsuki from the Department of Forest and Forest Product Sciences, Faculty of Agriculture, Kyushu University, for guidance on site sampling at the Ochozu Experimental Watershed, and Dr. Yoshika Tennichi from the Kyushu Environmental Evaluation Association of Fukuoka for ICP-MS measurements of total chromium. This work was partially supported by the JSPS Ronpaku Program (DGHE-10715) for S. S. (2007 and 2008) and by a Grant-in-Aid for Scientific Research (C), No. 18550067 for S. M. (2006 – 2007), and by a Grant-in-Aid for Scientific Research (B),
No. 19310011 for K. Y. (2007 – 2009), from the Ministry of Education, Science, Sports and Culture, Japan.
References
1. J. Kotás and Z. Stasicka, Environ. Pollut., 2000, 107, 263. 2. A. M. Zayed and N. Terry, Plant Soil, 2003, 249, 139. 3. P. A. Kumar, M. Ray, and S. Chakraborty, J. Hazard.
Mater., 2007, 143, 24.
4. World Health Organization, “Chromium in Drinking-water”, 2006, World Health Organization (WHO), Geneva. 5. Guidelines for Canadian Drinking Water Quality, in Health
Canada on behalf of the Federal-Provincial-Territorial Committee on Drinking Water, 2007.
6. EU’s Drinking Water Standards, Council Directive 98/83/EC on the Quality of Water Intended for Human Consumption, November 3, 1998.
7. K. Yoshimura and H. Waki, Talanta, 1976, 23, 449. 8. K. Yoshimura and H. Waki, Talanta, 1985, 32, 345. 9. K. Yoshimura and S. Ohashi, Talanta, 1978, 25, 103. 10. K. Yoshimura and H. Waki, Talanta, 1987, 34, 239. 11. U. Hase and K. Yoshimura, Anal. Sci., 1993, 9, 111. 12. J. Ide, O. Nagafuchi, M. Chiwa, A. Kume, K. Otsuki, and
S. Ogawa, J. Forensic. Res., 2007, 12, 45. 13. K. Yoshimura, Analyst, 1988, 113, 473.
14. S. Matsuoka, Y. Tennichi, K. Takehara, and K. Yoshimura,
Analyst, 1999, 124, 787.
15. T. Tsuruhara, K. Takehara, K. Yoshimura, S. Matsuoka, S. Saputro, and J. Aizawa, J. Ion Exchange, 2007, 18, 524. Table 5 Comparison of sensitivity
Sample volume/cm3 Solid volume/cm3 Cell length/mm Aa Detection limit/µg dm–3 Reference
Solution method Batch method of SPS
200 1000 1000 5 20 Flow method of SPS
4.4 7.9
0.5 0.5 0.5 0.06 0.06
10
1 1 10 10 10
10 10
0.000704
0.016 0.037 0.310 0.087 0.194
0.083 0.244
0.072 0.014
0.055 0.009
7 10 10 Present study Present study
13 14