2014 Fifth International Conference on Intelligent Systems Modelling and Simulation
A DNR and DG Sizing Simultaneously by Using EPSO
Mohamad Fani Sulaima, Nur Hazahsha
Shamsudin, Hazriq Izzuan Jaafar
Faculty of Electrical Engineering Universiti Teknikal Malaysia Melaka
Malacca, Malaysia
[email protected], [email protected], [email protected]
Wardiah M. Dahalan, Hazlie Mokhlis
Department of Electrical EngineeringUniversity Malaya Kuala Lumpur, Malaysia
[email protected], [email protected]
Abstract—Distribution network planning and operation require the identification of the best topological configuration that is able to fulfill the power demand with minimum power loss. This paper presents an efficient hybridization of both Particle Swarm Optimization (PSO) and Evolutionary Programming (EP) methods which is called the Evolutionary Particle Swarm Optimization (EPSO). The proposed method is used to find the optimal network reconfiguration and optimal size of Distribution Generation (DG) simultaneously. The main objective of this paper is to gain the lowest result of real power losses in the distribution network while improve the computational time as well as satisfying other operating constraints. A comprehensive performance analysis is carried out on IEEE 33 bus distribution system. The proposed method is applied and its impact on the network reconfiguration for real power loss is investigated. The results are presented and compared with the strategy of separated DG sizing and network reconfiguration.
Keywords-evolutionary particle swarm optimization; particle swarm optimization; evolutionary programming; distribution generation
I. INTRODUCTION
Mostof electrical distribution systems usually operate in a radial configuration due to lower short circuit, simple switching, lower cost of installation and protect equipment with lower reliability. Two types of switches are generally found in the system for both protection and configuration management which are sectionalizing switches (normally closed switches) and tie switches (normally opened switches). One of the most important control schemes in
electrical distribution systems is “Distribution Network Reconfiguration” (DNR) which can bring optimal
minimization of real loss, improve the voltage profile and relieve the overloads in the network. The DNR is affected more through the interconnection of DGs. The growth of DG insertion in distribution system is indeed in the increasing trend because of its vital contribution in the power system performance. According to the statistic in the literature review, [1] has reported that 70% of the total losses occur in the primary and secondary distribution system, while transmission and sub-transmission lines account for only 30% of the total losses. Therefore, considering the best DG insertion in the active distribution network is necessary.
The installation of DG and other devices will incur high cost. Therefore, determining the suitable DG sizing and its location prior to installation is essential to maintain the network stability and minimize the power loss in the distribution system. In the meantime, the reconfiguration technique is only required some additional line and controlling methods to improve the consistency of the system. Furthermore, the installation of reconfiguration network is much simple and cost efficient compared to other techniques. Various reconfiguration methods have been proposed in the research to foresee the strengths and weaknesses of each method. Many researchers have been focusing more on overcoming the reconfiguration problem through various approaches such as Tabu Search [2], Ant Search Colony (ASC) [3-4], Particle Swarm Optimization (PSO) [5-6], Genetic Algorithm [7], Plant Growth Algorithm (PGO) [8] and Bacterial Foraging Algorithm (BFA) [9]. However, there are only a few of them associate
DG in their research and foresee DG’s impact on the
reconfiguration distribution network [2], [3] and [6]. On top of that, their reconfiguration system and DG sizing operate in different situation and organize separately.
In this work, the researcher is trying to solve the problem in finding the optimal network reconfiguration and optimal DG sizing simultaneously. Doing it simultaneously will further reduce the cost and increase its efficiency. In order to achieve that, EPSO has been proposed in reconfiguration problems due to its excellent capability for searching globally optimal solution to a complex problem and fast convergent. Five distinct cases have been manipulated to foresee their outcomes and results with the presence of DG as well as in the absence of DG. In experimenting the five cases, we only look for the best possible size of DG while the location of DG shall be set constant. The test result of EPSO algorithm is compared with the existing method as the conclusion for the minimization of losses and the decrease percentage is shown as the conformation for the success of this optimization.
social animals which live and move in group such as fish and bird. The birds or fish usually move in a group at a certain speed and position. Their design of movement is depending on their experience as well as the experience of others in the group (Pbest andGbest). The new velocity, fitness function that has been achieved so far by any particle. Constants wf1and wf2 are weighting factors of the random
acceleration terms, which attract each particle towards
best
P and Gbest positions. Lower values of fitness function
allow particles to move farther from the target region before they return. The inertia weight ωiis typically set according to
the following equation: maximum and minimum of the inertia weights, respectively. The summary process of implementation of PSO algorithm is as follows:
Step A- Initialization- generate randomly all particles
Step B- Evaluate the fitness function Step C- Determine Pbest andGbestfor all
Step F- Update the existing speed to the new speed Step G- Check the stopping criteria –otherwise go will be considered as the initial population.
A. Generator operation constraint:
All DG units are only allowed to operate within the acceptable limit where Pimin and Pimax are the lower and upper
bound of DG output. Therefore, for the analysis that contained the DG units, the DGs size results must not exceed this limit.
B. Power injection constraint:
In the effort of avoiding power injection for its main grid (substation) from DG unit, the output of DG cannot be more than the total load and the total active power loss in the network.
C. Power balance constraint:
The amount of power generated within the network system which comes from the DG unit and the substation must be equal to the amount of total load plus the total power loss. This concept complies with the principle of equilibrium in generating power and demand concept.
D. Voltage bus constraint:
The voltage for each bus should operate within the acceptable limit which is in between1.05 and 0.95(5). E. Constraint of Radial configuration:
The configuration must be in radial to avoid excess current flow in the system. Therefore, in order to ensure the radial network to be maintained, several constraints must be taken into account. Several standard rules have been adopted for selection of switches. Those switches that do not belong to any loop, connected to the sources and contributed to a meshed network have to be closed.
EPSO is resembled to PSO in many ways. This is because EPSO has been developed based on PSO. However, their resemblances stop at step E and F where the new Pbest and new Gbest are determined. In the next subsection, EPSO will be discussed in greater detail.
2014 Fifth International Conference on Intelligent Systems Modelling and Simulation
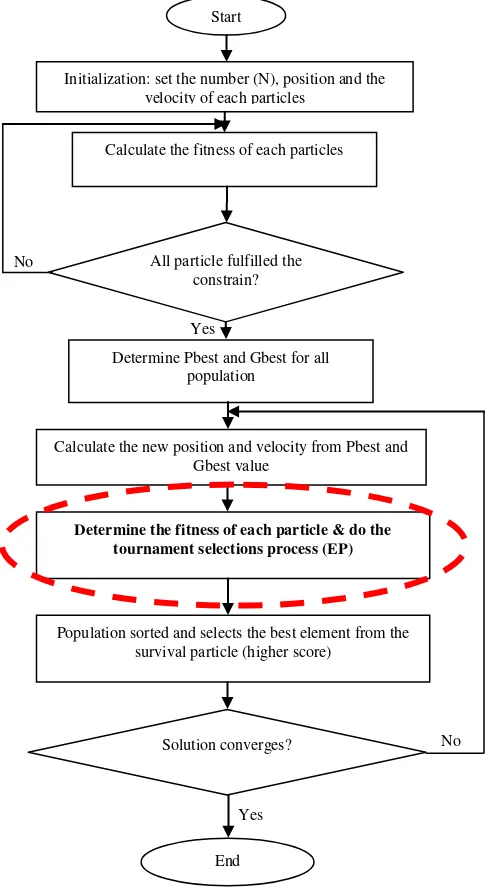
Figure 1. Flowchart for EPSO algorithm
This selection is used to identify the candidates that can be transcribed into the next generation of the combined population of the parents and offspring. In details for this EPSO, after obtaining the new position Xnew, the new fitness
value is determined by using the value of new positions. Thus, the set of new position Xnew and the old set position
x
will be combined together. This combination of new and old set position will be contested in a tournament as shown in red dotted line in flow chart. A position gains the score when its fitness is better than other contenders and this tournament is contested as randomly. This tournament selection is a part which is adapted from EP method that's different compare to the conventional Particle Swarm Optimization.
Meanwhile in step F, after the tournament and selection process, the positions will be sorted out in descending style,
starting with the highest score to the lowest score. The N numbers of positions with the best score from the results can be considered as survival positions which are used for the next iteration. These positions have been used as the newest Pbest and the position with the highest score is used as the
newest Gbest.
Finally, in the last step, the convergence test is required to determine the stopping criteria of this optimization search process. The new position set will be tested for convergence. If convergence is not achieved, the process will be repeated by calculating a new velocity and position by using equations (E) and (F) based on the new local best (Pbest) and
global best (Gbest). If convergence is achieved, then the
optimization process is terminated. The overall flow of EPSO is illustrated in the Figure 1.
IV. SIMULATION AND CONSIDERATION
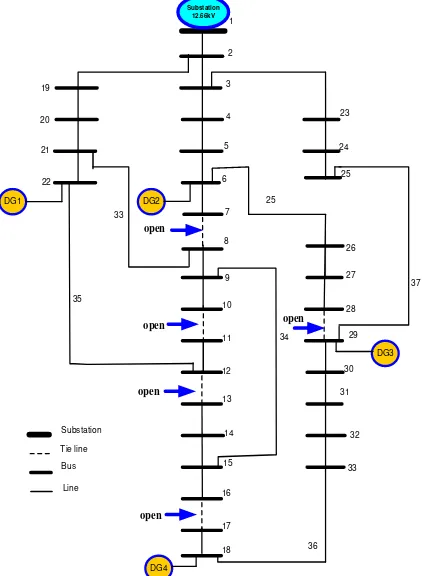
The test system for the case study is consisting of 33-bus radial distribution system as is shown in Figure 2. The system consists of one feeder, 32 normally closed tie line and five normally open tie lines (dotted line) and located on branch No. 33, 34, 35, 36 and 37. The system load is assumed to be constant and Sbase = 100MVA. The line and load data details can be referred in [10]. The total load on the system is 3715kW and 2300kVAr. The minimum and maximum voltages are set at 0.95 and 1.05p.u.respectively. All calculations for this method are carried out in the per-unit system. The convergence value is taken as 0.0001.
Five distinct cases have been executed to find out their reliability of having EPSO in the system to achieve the best configuration and the most optimal size of DG. Those cases are described as follows:
A. In this first case
The system follows the original network distribution of 33-bus without any alteration done.
B. In this second case
Reconfiguration technique is added to the existing system to foresee its effects of power loss reduction.
C. In this third case
Four DG units are stationed at the most optimal locations of buses 6, 18, 22 and 29 respectively. There is no reconfiguration done in this case. Then, the impacts of all these DGs are being analyzed.
D. In this fourth case
Both the reconfiguration and DG have been applied in the system. The system will find the optimal DG size first before conducting the reconfiguration. They are done separately.
E. In this fifth case
Both the reconfiguration and DG have been applied simultaneously in the system. Then we can make a better comparison between having used them separately or simultaneously.
Start
Initialization: set the number (N), position and the velocity of each particles
All particle fulfilled the constrain?
Calculate the fitness of each particles
Calculate the new position and velocity from Pbest and Gbest value
Determine Pbest and Gbest for all population
Solution converges?
Population sorted and selects the best element from the survival particle (higher score)
Determine the fitness of each particle & do the tournament selections process (EP)
End No
Yes
No
Substation Tie line
Bus Line 35
37 26
28
32
33 19
20
21
22
1
18
23
24
25
27
29
30
31 33
34
36
132/12.66kV
1
2
3
4
5
6
7
10 8
9
11
12
13
14
15
16
17
open open
open
open
open
Figure 2. Initial configuration of the 33- bus radial distribution system
V. ANALYSIS OF THE RESULTS
As mentioned in the previous section, the analysis of reconfiguration involved the network with and without DG units. In the case of a network with DG, the optimal size of DG units is obtained from the simulation in which both parameters DG size and the switches opened (in equation (4)) are adjusted during simulation simultaneously. The size of each DG is already set with the limitation range less than 5MW in the program. In this work, the location of DG is fixed. DG location shall be constant as a controlled measure in order to observe the responding changes of DG sizing. Tie switch and sectionalizing switch are considered as the main control variables. The optimal power losses are based on flexible switches while the optimal size of DG depends on the optimum power losses value. The programming is run randomly and takes approximately 100 times by using MATLAB software. Then, only the minimum power loss with optimal DG size is selected. The results obtained consist of the five opened switches, total power loss and four optimal DG sizing. Analysis of the network reconfiguration and DGs installation technique has been divided as follows: A. Impact on power loss
Since the reconfiguration technique has changed the original configuration network as well as a number of feeders, the impacts of this technique to the power losses and voltage profile of the system need to be studied and analyzed. The operation of the system by using EPSO method in the initial case (case 1) shows that the network of 33-bus system runs without the presence reconfiguration and
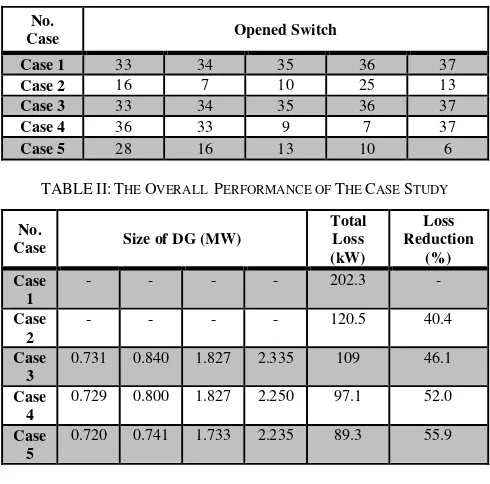
and 37. While in case 2 where the reconfiguration is employed in the network of 33-bus system, the power loss reduction has been improved by 40.4% (202.3kW to 120.5kW). At the same time, the newly opened switches are also shifted to 7, 10, 13, 16 and 25 after the reconfiguration. The open switches and overall performance of the test is summarized in Table I and Table II.
Meanwhile, in case 3 where the network of 33-bus system is operated by having only DG which is placed on bus number 6, 18, 22 and 29. In this case, reconfiguration is taken out so that we can clearly observe the impact of DG. After the analysis, it is found that the presence of DG does give lower power loss as compared to case 2. The total power loss is reduced by 93.3kW or 46.1% (from 202.3kW to 109kW). From the improved network system, the sizes of DG are also become optimal; 0.731MW, 0.840MW, 1.827MW, 2.435MW respectively. Figure 3 and Figure 4 show the diagram of the network after reconfiguration and DG installation in the distribution system.
In case 4, the operation is conducted in both reconfiguration and DG. However, reconfiguration process is only being done after the right size of DG has been determined. In other word, both processes run separately. The results reveal even greater power loss reduction by 105.2kW or 52% as compared to case 2 and case 3. Thus, the presence of both DG and reconfiguration in the process has indeed led to the reduction of power loss. The new diagram of the network reconfiguration operates with DGs in splitting and simultaneous mode is illustrated in Figure 4.
TABLEI:TIE SWITCHES TOPOLOGY
No.
Case Opened Switch
Case 1 33 34 35 36 37
Case 2 16 7 10 25 13
Case 3 33 34 35 36 37
Case 4 36 33 9 7 37
Case 5 28 16 13 10 6
TABLEII:THE OVERALL PERFORMANCE OF THE CASE STUDY
No.
Case Size of DG (MW)
Total Loss (kW)
Loss Reduction
(%) Case
1
- - - - 202.3 -
Case 2
- - - - 120.5 40.4
Case 3
0.731 0.840 1.827 2.335 109 46.1
Case 4
0.729 0.800 1.827 2.250 97.1 52.0
Case 5
0.720 0.741 1.733 2.235 89.3 55.9
2014 Fifth International Conference on Intelligent Systems Modelling and Simulation
Figure 3. Case 2: after network reconfiguration without DGs
Substation
Figure 4. Case 3: network with DGs installation
Substation
Figure 5. Case 4: network reconfiguration and DGs sizing separately
Substation
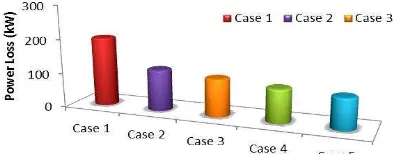
results for the network of 33-bus system show the greatest improvement on power loss reduction of 55.9% (202.3kW to 89.3kW). The optimal size of DG is slightly different from case 4 which are 0.720MW, 0.741MW, 1.733MW and 2.235MW. The analysis of this case has proven that the simultaneous presence of reconfiguration and DG yields a much better rate of power loss. The comparison of power losses of all cases is depicted in Figure 7.
Figure 7. Power losses against cases between with and without reconfiguration and DGs installation
B. Computing time
The computing time taken in case 5 only 46 seconds instead of 57 seconds in case 4 to perform two processes together as shown in Table 3. Hence, case 5 gives better results in term of Computer Processing Unit (CPU) time to reach the optimal result with the percentage of improve is 19.3%.
TABLEIII:THE COMPUTATIONAL TIME
No. Case
CPU time (s) Improvement [%]
Case 4 57 -
Case 5 46 19.3
The differential of CPU time is due to the concept used in EPSO which only maintains survival particles. The survival particles are the particles among the population set that given the lowest fitness value when the optimization process is running. So that, it has made the process of convergence becomes faster and consistence. While Case 4 needs longer time because the organization of the two processes has to be done twice and separately. The results of CPU time are illustrated in Figure 8.
Figure 8. The performance of CPU time of EPSO algorithm
introduced. The prime aim of this paper is to reduce the amount of power loss to the lowest possible and at the same time improve the computing time is positively done. The applying a reconfiguration technique with the presence of DG and with the absence of DG has successfully analyzed. Thus, the simultaneous implementation of DG and reconfiguration by using the EPSO algorithm is certainly giving great impacts to the whole distribution system.
ACKNOWLEDGMENT
The authors would like to thank the Universiti Teknikal Malaysia Melaka for all support given.
REFERENCES
[1] N.Suresh and Dr.T.GowriManohar. “Optimal Citing Of Custom Power Controller in Distribution System For Loss reduction”, paper presented at the National Conference on Oct 6-7, 2009 at GSSSETW, Mysore, Kartanaka.
[2] N. Rugithaicharoencheep; S. Sirisumarannukul, Feeder reconfiguration for loss reduction in distribution system with distributed generators by tabu search, GMSARN International Journal, vol 3, 2009, pp. 47-54.
[3] Y. K. Wu, C. Y. Lee, L. C. Liu and S. H. Tsai, Study of Reconfiguration for the Distribution System With Distributed Generators, IEEE Transaction on Power Delivery, Vol. 25, No. 3, July 2010, pp. 1678-1685.
[4] Ching-Tzong Su, Chung-Fu Chang and Ji-Pyng Chiou, “Distribution Network Reconfiguration for Loss Reduction by Ant Colony Search Algorithm”, Electric Power Systems Research, Vol. 75, No. 2-3, August 2005, pp. 190–199.
[5] N. Gupta, A. Swarnar and K. R. Nizai, Reconfiguration of Distribution Systems for Real Power Loss Minimization Using Adaptive Particle Swarm Optimization, Electric Power Components and Systems, 39:4, 2011, pp. 317-330.
[6] J.Olamie, T.Niknam, G. Gharehpetian, “Application of Particle Swarm Optimization for Distribution feeder Reconfiguration Considering Distributed Generators”, Applied Mathematics and Computation, 2008, pp. 575-586.
[7] J. H. Choi and J. C. Kim, "Network reconfiguration at the power distribution system with dispersed generations for loss reduction," in Proc.IEEE Power Engineering Society Winter Meeting, 2000, vol. 4, pp. 2363-2367
[8] J.Y. Fang Zong Wang, “A Refined Plant Growth Simulation Algorithm for Distribution Network Reconfiguration”, IEEE Trans. on Power Systems, 2009, pp. 4244-4738.
[9] K. Sathish Kumar, T. Jayabarathi, “Power system reconfiguration and loss minimization for an distribution systems using bacterial foraging optimization algorithm,” Electrical Power and Energy Systems 36, Nov 2011, pp. 13–17.