Safety in Work Vehicles: A Multilevel Study Linking Safety Values and
Individual Predictors to Work-Related Driving Crashes
Sharon Newnam
Queensland University of Technology University of Sheffield
Mark A. Griffin
Claire Mason
Queensland University of Technology
Although work-related driving is associated with high accident rates, limited research has investigated the factors influencing driving crashes in the work setting. This study explored multilevel influences on self-reported crashes in the workplace by surveying a sample of work-related drivers (n⫽380), their workgroup supervisors (n⫽88), and fleet managers (n⫽47). At the driver level of analysis, safety motivation predicted self-reported crashes. In turn, drivers’ perceptions of their fleet managers’ safety values (but not drivers’ perceptions of their supervisors’ safety values), their own attitudes, and their own efficacy beliefs predicted motivation to drive safely. Furthermore, the influence of supervisors and fleet managers interacted such that drivers were more motivated to drive safely if they perceived both their supervisor and fleet manager to value safety. This study also explored the cross-level relationships between supervisors’ and fleet managers’ perceptions of organizational safety values and drivers’ perceptions of managerial safety values and found a relationship between fleet managers’ perceptions of organizational safety values and drivers’ perceptions of fleet managers’ safety values. These results illustrate that perceptions of workplace safety values are transmitted across levels of the organization.
Keywords:safety climate, fleet safety, attitudes, self-efficacy, work-related driving
Road crashes are now the most common cause of work-related injury, death, and absence in a number of countries. In the United States, work-related drivers accounted for the highest number of fatal work injuries of any occupation. Approximately 7 out of 10 of the fatally injured work-related drivers were killed on public roadways or surrounding areas (Bureau of Labor Statistics, 2004). In the United Kingdom, research has found work-related drivers have above-average crash frequencies compared to non-work-related drivers in personal vehicles (Downs, Keigan, Maycock, & Grayson, 1999; Lynn & Lockwood, 1998). Similar statistics have also been found within the Australian context (Murray, Newnam, Watson, Schonfeld, & Davey, 2003).
The above figures suggest road safety should be an important concern for all organizations where employees are engaged in work-related driving. However, surprisingly little research has investigated the predictors of driving crashes in an organizational
setting. Given that past research has found differences in the on-road behavior of work-related drivers when driving a work and personal vehicle (Newnam, Watson, & Murray, 2002), there is a need to explore the influences on driving crashes in an organiza-tional setting.
Safety Framework
Work-related drivershave been defined as those who drive at least once per week for work-related purposes (Murray et al., 2003). To develop a better theoretical understanding of work-related driving, we integrated this issue into the broader context of safety outcomes at work. From this perspective, safe driving at work is a form of motivated behavior that is influenced by a range of workplace and individual factors. Based on research in the areas of safety climate (e.g., Griffin & Neal, 2000; Probst & Brubaker, 2001; Zohar, 2000), Figure 1 shows the main constructs that we expected to influence motivation to drive safely and, subsequently, self-reported driving crashes. We review the evidence for includ-ing each of the constructs shown in our model below.
At the individual level, drivers’ perceptions of the safety values held by their supervisor and their fleet manager, along with driv-ers’ own driving self-efficacy and safety attitudes, were identified as proximal predictors of driver safety motivation. At the work-group level, we investigated the safety values reported by super-visors and fleet managers themselves as predictors of drivers’ perceptions of supervisor and fleet manager safety values. In this way, we were able to investigate the cross-level link from man-agement values to driver values. In this study, we used self-Sharon Newnam, Centre of Philanthropy and Nonprofit Studies,
Queensland University of Technology, Carseldine, Queensland, Australia; Mark A. Griffin, Institute of Work Psychology, University of Sheffield, Sheffield, United Kingdom; Claire Mason, School of Management, Queensland University of Technology, Brisbane, Queensland, Australia.
We would like to thank Boris Kabanoff for his helpful comments. Support from the Australian Research Council is also gratefully acknowl-edged.
Correspondence concerning this article should be addressed to Sharon Newnam, Centre of Philanthropy and Nonprofit Studies, Queensland Uni-versity of Technology, Carseldine, Queensland, Australia 4034. E-mail: [email protected]
reported crashes as the criterion variable. As discussed below, direct measures of driving behavior are difficult to obtain, so we relied on the more indirect measure of crashes.
A unique aspect of this study is the opportunity to explore the correlates of drivers’ safety values at work. The management of safety in the work-related driving setting has some characteristics that distinguish it from the management of other organizational safety activities. Most important, driving activities often fall out-side typical line management responsibilities and are supervised by a person who is not part of the same management structure associated with other work roles. In the organization in the current study, a separate fleet manager was responsible for the use of motor vehicles by employees. The role of fleet manager is com-mon to many organizations that require employees to drive and is similar to the role of logistic supervisor or dispatcher (e.g., Rothe, 1991). Fleet managers have regular contact with drivers through duties such as organizing fleet vehicles, distributing car keys, and ensuring accurate completion of log books. Although they do not have supervisory authority over work-related drivers, they may influence drivers’ perceptions of safety within the driving context. Specifically, as fleet managers have initial contact with individuals before and after they use a work vehicle (e.g., distributing keys), they have the ability to alert drivers to safety issues, organizational requirements, and safety standards. Thus, although supervisors in the driving context are believed to be responsible for providing reinforcement through processes such as praise, performance
ap-praisal, and reward power, the role of the fleet manager also needs to be taken into account. Differentiating the effects of fleet man-agers and supervisors on drivers’ safety perceptions is important for understanding how to manage safe driving in the workplace.
Safety Motivation
Safety motivationrefers to an individual’s willingness to put in effort to act safely and the importance an individual places on safe behaviors (Neal & Griffin, 2006). Campbell, McCloy, Oppler, and Sager (1993) identified motivation as a critical determinant of safety outcomes on the grounds that behavior depends on the motivational properties of the situation and determines the direc-tion, amplitude, and duration of volitional behavior. Consistent with this proposition, safety motivation has been shown to influ-ence a range of safety behaviors at work (Griffin & Neal, 2000; Neal, Griffin, & Hart, 2000; Probst & Brubaker, 2001). However, the role of motivation in predicting driving crashes in work-related driving settings has not been investigated.
Past research has found that motivation mediates the link be-tween organizational climate and task behavior (Brown & Leigh, 1996) and that safety motivation has a lagged effect on safety compliance for up to 6 months (Probst & Brubaker, 2001), with more recent research suggesting a lag up to 2 years (Neal & Griffin, 2006). Therefore, in this study, where self-reported crashes are the criterion measure, we proposed that motivation to
Self-report accidents Perception of fleet manager’s
safety values
Driving safety attitudes Motivation to
drive safely
Driving self-efficacy Perception of
supervisor’s safety values Supervisor’s perception of organizational values
Fleet manager’s perception of organizational values
Fleet level
Individuals
within fleets
drive safely would be related to self-reported crashes in a work vehicle.
Hypothesis 1: Drivers’ safety motivation will be negatively related to self-reported crashes.
Safety Values in the Workplace
Workplace perceptions are an important influence on motivated work behaviors, including safety behavior. Much of the research concerning safety-related perceptions of the workplace has fo-cused on perceptions of the organizational climate in work groups (Griffin & Neal, 2000; Hofmann & Stetzer, 1996).Safety climate
has been described as an individual’s perceptions of the value and importance associated with safety within an organization (Griffin & Neal, 2000; Zohar, 1980). Past research has found support for the relationship between safety climate and outcome measures such as accident rates (Zohar, 1980), self-reported accident in-volvement (Mearns, Flin, Gordon, & Fleming, 1998), self-reported safety behaviors (e.g., Hofmann & Stetzer, 1996; Neal et al., 2000), and frequency of compensation claims (O’Toole, 2002).
More recently, employees’ perception of value placed on safety within the workgroup has been the focus of safety climate research (e.g., Neal & Griffin, 2006; Zohar, 2000). However, measuring the construct of management safety values within workgroups is somewhat problematic in relation to work-related driving. As noted above, an important difference between work-related driving and other safety activities is the organizational system of rewards and control in which safe driving is managed. The line responsi-bility for safety in the work vehicle is not the same as the line responsibility for other safety activities in organizations such as hospitals (e.g., Griffin & Neal, 2000) and manufacturing plants (e.g., Zohar & Luria, 2005) because there are two sources of line management with responsibility for safe driving, namely, supervi-sors and fleet managers.
Drivers’ perceptions of the safety values held by supervisors and fleet managers might be related to safety motivation concerning work-related driving in three ways. First, perceptions of supervi-sors’ values might be related to motivation independently of per-ceived fleet managers’ values. Second, perceptions of fleet man-agers’ values might be related to motivation, independently of perceived supervisors’ values. Third, perceptions of supervisors’ and fleet managers’ values might interact to jointly relate to driving motivation. There are theoretical reasons for proposing hypotheses about each of these possibilities, which we outline below.
With regard to supervisors, supervisory safety practices have been found to have positive effects on increasing safety percep-tions and reducing workplace accidents (Zohar, 2002; Zohar & Luria, 2004). Furthermore, the climate created by supervisors has been found to exert a strong impact on individual motivation (Brown & Leigh, 1996), with recent research suggesting positive effects on motivation with lags of up to 2 years (Neal & Griffin, 2006). Considering this research, we expected that supervisors, who have a clear line responsibility for employee general safety, might have an influence on drivers’ safety motivation. As such, we predicted the following:
Hypothesis 2: Drivers’ perceptions of supervisors’ safety values will be positively related to drivers’ safety motivation,
and this relationship will be independent of drivers’ percep-tions of fleet managers’ safety values.
Because work-related driving safety is not well integrated within most occupational health and safety systems, it is possible that the responsibility for managing the safety of drivers becomes partly the responsibility of the fleet manager. In support of this possibility, research has found that fleet managers have the ability to enhance the safety performance of their fleet through particular fleet safety initiatives (Newnam & Tay, 2007; Newnam, Tay, & Mason, 2006). Although fleet managers do not have supervisory authority over drivers, they might influence driving safety by communicating the importance of safety. In support, past research has identified open communication channels between leaders and their subordinates as an important influence on safety performance (e.g., Griffin & Neal, 2000; Hofmann & Morgeson, 1999; Hof-mann & Stetzer, 1996; S. K. Parker, Axtell, & Turner, 2001). As fleet managers have regular contact with drivers, particularly be-fore and after drivers use a work vehicle, they have the ability to inform drivers of safety issues. Therefore, we predicted the fol-lowing:
Hypothesis 3:Drivers’ perceptions of fleet managers’ safety values will be positively related to drivers’ safety motivation, and this relationship will be independent of drivers’ percep-tions of supervisors’ safety values.
Perceptions of fleet managers’ and supervisors’ values might also combine to influence driver safety motivation beyond simple main effects. Past research has explored the role of social– organizational factors in influencing safety performance (e.g., Hof-mann & Morgeson, 1999; Zohar, 2000). Research has suggested that an organization’s values and norms can influence the relation-ship between supervisors and their subordinates (Dienesch & Liden, 1986). More recent research has supported this assumption with findings suggesting that the organizational climate establishes the context that emphasizes certain role behaviors as being impor-tant (Hofmann, Morgeson, & Gerras, 2003). This research sug-gests that leaders and the climate that they help to create can have an influence on the safety outcomes of subordinates.
Hypothesis 4:If drivers perceive their supervisors to value safety, the relationship between drivers’ perceptions of their fleet managers’ safety values and drivers’ motivation will be stronger.
Cross-Level Influences in the Driving Context
In addition to exploring the independent and combined contri-butions of drivers’ perceptions of supervisors’ and fleet managers’ safety values on drivers’ safety motivation, we extended the frame-work to incorporate supervisors’ and fleet managers’ own percep-tions of organizational safety values. More specifically, this study investigated the cross-level relationships between supervisors’ and fleet managers’ perceptions of organizational safety values and drivers’ perceptions of supervisors’ and fleet managers’ safety values, within both supervisor and fleet manager workgroups.
We deliberately chose to assess supervisors’ and fleet managers’ perceptions of organizational safety values rather than supervisors’ and fleet managers’ own safety values, because our aim was to understand how workplace safety perceptions are transmitted across levels of the organization. The formal responsibility of managers (whether fleet coordinators or supervisors) is to promote organizational safety values. Although their own safety values may have an impact on the way that they enact organizational safety values, we believed that perceptions of organizational safety val-ues should have the most direct impact on drivers’ perception of fleet managers’ and supervisors’ safety values.
No research to date has established the cross-level relationship between group-level predictors and individual-level safety perfor-mance constructs in the driving context. However, past research in other organizational contexts has demonstrated that managers in-fluence subordinates’ safety behaviors (e.g., Maierhofer, Griffin, & Sheehan, 2000) and organizational determinants of safety (Barling & Zacharatos, 1999). Processes operating at the group level have been found to influence employees’ safety perceptions, which in turn predict role definitions (Hofmann et al., 2003) and behavior-outcome expectancies (Zohar, 2000). As such, we pre-dicted the following:
Hypothesis 5:Supervisors’ perceptions of the organizational safety climate will be positively related to drivers’ percep-tions of supervisors’ safety values.
Hypothesis 6:Fleet managers’ perceptions of the organiza-tional safety climate will be positively related to drivers’ perceptions of fleet managers’ safety values.
Individual Differences
In addition to safety values in the workplace, individual differ-ences are also likely to play an important role in safety in the organizational context (Hofmann, Jacobs, & Landy, 1995). We included drivers’ self-efficacy and drivers’ attitudes toward rule violations and speeding as direct predictors of motivation to drive safely. The incorporation of these two variables is supported by previous research using the theory of planned behavior model (Ajzen, 1991). This model has typically been tested in the general driving population, where researchers have found that attitudes and self-efficacy explain variance in drivers’ intentions to drive safely
(D. Parker et al., 1992; D. Parker, Stradling, & Manstead, 1996). The theory has also been used to investigate intention to speed in a work vehicle (Newnam, Watson, & Murray, 2004).
Self-Efficacy
Self-efficacyis defined as the belief in one’s ability to perform a specific task through successfully executing the behavior to produce the desired outcome (Bandura, 1977). Self-efficacy pre-dicts task effort and work behavior (Gist & Mitchell, 1992; Sta-jkovic & Luthans, 1998) and may be a better predictor of work-related behavior than many personality trait-based constructs (Stajkovic & Luthans, 1998). Although self-efficacy has been widely investigated in the organizational literature (e.g., Bandura, 2000; Chen, Gully, & Eden, 2001; Gist, 1987) as well as in the general driving literature (Tay, 2004, 2005; Tay & Watson, 2002), it has not yet been tested in studies of work-related driving.
In some studies, self-efficacy is treated as an inherently moti-vational construct, where positive correlations between behavior and efficacy are interpreted as a motivational effect of self-efficacy on behavior (e.g., Bandura, 1986; Judge, Erez, & Bono, 1998; Vancouver, Thompson, & Williams, 2001). Other research-ers have argued motivation is a distinct construct, which can be used to explain variability in behavior (e.g., Brown & Leigh, 1996; Griffin & Neal, 2000), independent of self-efficacy or other psy-chological states. Like the latter researchers, in this study we distinguish self-efficacy from motivation and definedriver self-efficacy as the driver’s belief in his or her own ability to drive safely. Thus, in the safety framework, self-efficacy represents an antecedent variable, indirectly related to self-reported crashes through its effect on motivation. Thus, we hypothesized the fol-lowing:
Hypothesis 7:Drivers’ self-efficacy will be positively related to their safety motivation.
Attitudes Toward Rule Violations and Speeding
Anattitudeis a favorable or unfavorable evaluation of an object (person, entity, or idea) that exerts a direct impact on social behavior (Eagly & Chaiken, 1993). Attitudes have been widely used to predict behavior, but early research indicated only a weak direct relationship between individuals’ attitudes and their behav-ior (Ajzen, 1988; Wicker, 1969). Stronger relationships between attitudes and behavior have been observed by assessing more specific attitudes that relate to the behavior in question.
motivation, research in other areas of work behavior has suggested that attitudes play an important role in influencing work behavior (e.g., Hofmann et al., 1995). Thus, in the safety framework, attitudes represent an antecedent variable, indirectly related to self-reported crashes through their effect on safety motivation. Therefore, we hypothesized the following:
Hypothesis 8: Drivers’ attitudes toward rule violations and speeding will be positively related to their safety motivation.
Self-Reported Crashes as an Outcome Variable
Unlike other types of safety behavior that can be directly mon-itored by a workgroup supervisor or safety representative within the organization, there is currently no objective method (e.g., supervisor ratings of performance) of studying individuals’ behav-ior in the work-related driving context. Work-related driving is generally performed in isolation, and as such, measures of work-related driving performance are generally gauged through self-report data. A number of studies have assessed work-related driv-ing behavior usdriv-ing questionnaires (e.g., Davey, Wishart, Freeman, & Watson, 2007; Wills, Watson, & Biggs, 2004). However, the questionnaires utilized in these studies were developed for the general driving population (e.g., Driving Behavior Questionnaire; Reason, Manstead, Stradling, Baxter, & Campbell, 1990), adapted to the work-related driving context, and have not been developed on the basis of theoretical grounds. The problem associated with adapting driving behavior measures from the general driving pop-ulation is that job performance is believed to be a function of the goals established by the organization, and so adapting measures from a context with different goal perspectives may produce a contaminated source of variance (Campbell et al., 1993). In other words, driving for personal and work purposes may not be equiv-alent. In support, research has found differences in the degree to which driving behaviors are performed between the personal and work settings (Newnam et al., 2002). To overcome this issue, we chose to utilize crash involvement as an outcome measure. The premise of this variable as an outcome measure is that individuals are more likely to be involved in a crash if they drive unsafely in a work vehicle.
Although it would have been ideal to obtain an objective mea-sure of crash outcomes or an alternative criterion meamea-sure that would be considered more reliable and valid (e.g., infringement data), due to limitations associated with the organization’s data-base system, this was not possible. First, due to inaccurate data entry and missing entry fields in the organizational database sys-tem, we were unable to match driver details with claim inputs for the 6 months preceding the completion of surveys. Furthermore, according to the organization’s crash database system, the majority of crashes that have occurred in the past 6 months were single vehicle crashes (e.g., rear-end crashes), which suggest that no police reports would have been involved. As such, there was no method of externally validating the crash data. Second, infringe-ment data (i.e., loss of demerit points) were not available through the organization’s database system.
Based on these limitations, self-report crash involvement was considered appropriate in this context. To provide some informa-tion about the external validity for the self-report data, we com-pared the percentage of crashes in the total number of respondents
in the survey to the leasing vehicle agency’s claims benchmark for that year. It was found that 5% of individuals reported being involved in a crash over the 6-month period preceding the com-pletion of the survey, whereas the vehicle leasing agency reported that 16% of their fleet were involved in a crash for that year. The vehicle leasing agency’s benchmark figure suggests that approxi-mately 8% (with a total cost at $450,759) of the vehicle leasing agency’s fleet would have been involved in a crash over the 6-month period preceding the completion of the survey. In sum-mary, these figures provide some support for the self-report data, as the actual claims benchmark was close to the percentage of crashes reported in the survey. In further support of this criterion, past research has found self-report measures of crashes strongly correlate with objective measures of crashes (e.g., Lajunen & Summala, 2003).
Control Variables
This study also included a number of control variables, on the basis of previous research. The driver-level control variables were vehicle accidents while not at work, kilometers driven per week in a work vehicle, and driver age. Work-related drivers, on average, accumulate higher mileage in comparison to the average private motorist (Downs et al., 1999) and have been found to have a higher rate of crashes when driving for work purposes than for personal purposes (Newnam et al., 2002). In addition, younger drivers are known to have higher accident rates than older, more experienced drivers (Caird & Kline, 2004; Lynn & Lockwood, 1998). These findings constituted an argument for using these variables as controls within the current study.
Method
Participants and Procedure
The research was conducted in partnership with a vehicle leas-ing agency that is a government provider of vehicle leasleas-ing and fleet management services in a state of Australia. The study participants came from a sample of six government agencies, representing the following business portfolios: health, environ-mental protection, public works, road management, education and training, and emergency services. We chose this subset of agencies as being representative of the state public sector, including both small and large departments, and of a good mix of portfolios. Within some of these agencies, driving was relatively important for the core business, but in other agencies or sections of these agencies, only a small proportion of employees met our criteria (see below) to be identified as a work-related driver. To ensure that all participants understood the purpose of the study, we provided an information sheet to the fleet managers and drivers defining
motor vehicle safety as one’s behavior when driving for work purposes.
questionnaire was distributed only to individuals who drove at least once per week for work-related purposes.
The supervisor and fleet manager questionnaires were collected at the same time as the driver questionnaire. However, the proce-dure for collecting the data was different in the supervisor and fleet manager groups. In regard to the supervisors, the contact details of the supervisors were provided by the drivers after they had com-pleted and returned their own questionnaires. The drivers were requested to provide their supervisor’s contact details, and their anonymity was assured. An e-mail was then sent to the supervisors stating they were believed to be a supervisor of an individual who drove a work vehicle. The e-mail also detailed the purpose of the study, with a questionnaire attached. After the supervisors com-pleted the questionnaire, they were requested to return them via e-mail or the postal system. For the fleet managers, a list of fleet managers’ names was provided by the vehicle leasing agency. A detailed e-mail was sent to fleet managers detailing the purpose of the study, with the questionnaire attached. After the fleet managers completed their questionnaire, they were requested to return them via e-mail or the postal system.
Drivers. Completed questionnaires were returned by 385 drivers, all of whom drove a work vehicle at least once per week for work-related purposes. Due to the process of fleet managers distributing the questionnaire, a response rate for the driver ques-tionnaire was not available. However, 102 fleet managers were contacted and asked to distribute the questionnaire to drivers, and there was a response rate of 51% from the fleet managers. The majority of the drivers were male (76%) and fell within the 40 –59 years age category (65%). Over 70% had held their license for a minimum of 21 years, and the majority of the participants drove every day of the week (55%), with a driving average of 365 kilometers per week. After deleting missing data, a sample of 385 driver responses was available for analysis, of which 300 could be matched to fleet managers, as described below, and utilized in the analyses.
Supervisors. A total of 88 supervisors participated in the questionnaire, with a response rate of 53%. The majority of the sample was male (86%) and between the ages of 40 –59 years (82%). The response to the questionnaire from the supervisors meant that 121 of the original sample of 385 drivers were able to be matched with their supervisors.
Fleet managers. A total of 52 fleet managers participated in the questionnaire, representing a response rate of 51%. The ma-jority of the fleet managers participants were male (67%) and between the ages of 40 –59 years (67%). This sample of fleet managers meant that this study was able to match 342 of the original sample of 385 drivers with their fleet manager. Following the deletion of cases with missing values, the final driver sample size was 300. The final sample consisted of 47 groups, with a mean of 25 drivers represented in each fleet manager group.
Although all drivers identified their fleet manager, not all driv-ers identified their supervisor, so we could not link every driver to an individual supervisor. However, all drivers with the same supervisor had the same fleet manager. We therefore used the fleet management group structure as the basis for aggregating data to the group level. If there were two or more supervisors within a fleet manager group, we aggregated the supervisors’ responses and used this measure as the supervisor variable at the fleet level. On average there were 2.8 supervisors within each fleet manager
group. In the analyses, we also controlled for group size, as the interaction between drivers within each workgroup may have an influence on the dependent measure.
Measures
Safety motivation. We assessed safety motivation using Neal and Griffin’s (2006) safety motivation scale. The items were reworded slightly to suit the driving context. An example item is “I feel it is worthwhile to put in effort to improve my driving in a work vehicle.” These items were measured on a 5-point Likert scale, ranging fromstrongly disagree(1) tostrongly agree(5).
Perceived managerial safety values. Drivers’ perceptions of their supervisor’s and fleet manager’s safety values were assessed from the managerial values dimension of Griffin and Neal’s (2000) safety climate measure. The three items making up this measure appeared twice in the questionnaire, once to assess drivers’ ceptions of supervisors’ values, and again to assess drivers’ per-ceptions of fleet managers’ values. The items were reworded to suit the driving context. An example item is “My fleet manager/ workgroup manager places a strong emphasis on motor vehicle safety.” These items were measured on a 5-point Likert scale, ranging fromstrongly disagree(1) tostrongly agree(5).
Perceived organizational safety values. Supervisors’ and fleet managers’ perceptions of organizational safety values were also assessed from the managerial values dimension of Griffin and Neal’s (2000) safety climate measure. The items were reworded so that the referent was the organization (rather than a manager) and to suit the driving context. An example item is “This organization places a strong emphasis on motor vehicle safety.” These items were measured on a 5-point Likert scale, ranging from strongly disagree(1) tostrongly agree(5).
Self-efficacy. Self-efficacy was assessed by three items adapted from Renn and Fedor (2001). An example item is “Feel confident about your ability to drive safely in a work vehicle.” Due to the complexity of the driving task, it was considered appropriate to measure only the strength aspect of drivers’ belief in their ability to drive safely in a work vehicle (i.e., Gist & Mitchell, 1992). In support, past research has found that strength measures of self-efficacy correlated with performance just as strongly as composite measures did (strength and magnitude measures; Lee & Bobko, 1994). These items were measured on a 5-point Likert scale, ranging fromnever(1) tovery often(5).
Attitudes toward rule violations and speeding. Attitudes toward rule violations and speeding were assessed from 11 items. These items were adopted from Iversen and Rundmo’s (2004) rule violations and speeding scale. An example item is “Speed limits are exceeded because they are too restrictive.” These items were measured on a 5-point Likert Scale, ranging fromstrongly disagree(1) tostrongly agree(5). In the analy-ses, the 11 items comprising the scale were randomly allocated into three item-parcels to systematically randomize the error variance and reduce the number of indicators for the latent construct (see S. West, Finch, Curran, & Patrick, 1995). As this scale was negatively worded, the items were reversed in the analyses.
of the questionnaire. A 6-month period was chosen to ensure accurate recall of crashes (Landen & Hendricks, 1995). On the questionnaire, aroad traffic crashwas described as “an incident of at least one road vehicle involving death, injury to a person, or property damage.” Drivers responded either “yes” or “no” to this question: “In the last 6 months, have you been involved in a traffic crash when driving a work vehicle with your current employer?” The majority of drivers reported having only one crash in the past 6-month period, and only a few reported having two crashes. Due to current methods of determining a work-related road crash (i.e., Murray et al., 2003), it is uncertain how representative these statistics are of the national work-related road crash average.
Control measures. Age was measured as a categorical vari-able. A space was also provided for the participants to indicate how many kilometers they drove per week. In regards to the number of crashes when driving for personal purposes, drivers responded either “yes” or “no” to this question: “In the last 6 months, have you been involved in a traffic crash when driving for personal purposes?” Group size was also used as a control vari-able, as the interaction between drivers within each workgroup may have an influence on the dependent measure.
Measurement Properties
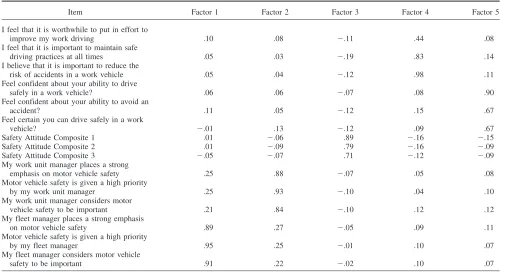
Exploratory factor analysis was used to evaluate the factor structure of the items used to measure safety motivation, driv-ing self-efficacy, safety attitudes, perceptions of fleet manag-ers’ safety values, and perceptions of supervisors’ safety values. Five factors with eigenvalues greater than 1 were extracted using maximum likelihood estimation and varimax rotation.
The loadings of the factors corresponded to the hypothesized factors, and all relevant factor loadings were above .40. No cross-loadings were above .40 in the rotated solution. The results of the analysis are reported in Table 1 and support the proposed factor structure of the items. Confirmatory factor analysis also showed the five-factor model was a good fit to the data, 2(80, N ⫽ 300) ⫽ 130.00, p ⬍ .001, comparative fit index⫽.98, root-mean-square error of approximation⫽.042. All hypothesized loadings were statistically significant, and the highest factor correlation wasr⫽.51 for perceptions of super-visors’ safety values and perceptions of fleet managers’ safety values.
In regard to the deletion of missing values, we examined whether the 85 cases not included in the analysis differed from the included cases on available measures. There were no significant differences in mean values for the number of crashes, age, or the five individually assessed scales described above.
Results
The correlations among the driver-level measures and disag-gregated fleet managers’ and supervisors’ perceptions of orga-nizational safety values are reported in Table 2. However, to show the full set of relationships depicted in Figure 1, multi-level modeling was required. Our main purpose in using mul-tilevel modeling was to assess the driver-level variables within fleet manager workgroups and the cross-level relationships between the group-level influences of supervisors and fleet managers and the individual-level driver safety perceptions. For the analyses, all drivers were nested within fleet manager
Table 1
Exploratory Factor Analysis Results for Driver Questionnaire Items
Item Factor 1 Factor 2 Factor 3 Factor 4 Factor 5
I feel that it is worthwhile to put in effort to
improve my work driving .10 .08 ⫺.11 .44 .08
I feel that it is important to maintain safe
driving practices at all times .05 .03 ⫺.19 .83 .14
I believe that it is important to reduce the
risk of accidents in a work vehicle .05 .04 ⫺.12 .98 .11
Feel confident about your ability to drive
safely in a work vehicle? .06 .06 ⫺.07 .08 .90
Feel confident about your ability to avoid an
accident? .11 .05 ⫺.12 .15 .67
Feel certain you can drive safely in a work
vehicle? ⫺.01 .13 ⫺.12 .09 .67
Safety Attitude Composite 1 .01 ⫺.06 .89 ⫺.16 ⫺.15
Safety Attitude Composite 2 .01 ⫺.09 .79 ⫺.16 ⫺.09
Safety Attitude Composite 3 ⫺.05 ⫺.07 .71 ⫺.12 ⫺.09
My work unit manager places a strong
emphasis on motor vehicle safety .25 .88 ⫺.07 .05 .08
Motor vehicle safety is given a high priority
by my work unit manager .25 .93 ⫺.10 .04 .10
My work unit manager considers motor
vehicle safety to be important .21 .84 ⫺.10 .12 .12
My fleet manager places a strong emphasis
on motor vehicle safety .89 .27 ⫺.05 .09 .11
Motor vehicle safety is given a high priority
by my fleet manager .95 .25 ⫺.01 .10 .07
My fleet manager considers motor vehicle
groups. Although some fleet manager groups had more than one supervisor, to analyze the data using one set of analyses, we aggregated supervisor data to the fleet manager level. In other words, aggregating supervisors to the fleet manager level pro-vided a common level of analysis. Figure 1 also depicts the hierarchical nature of the data.
The analyses were conducted using MLwiN (Goldstein et al., 1998). For all analyses we included control variable of vehicle accidents when not at work, age, and distance traveled at the individual level of analysis and number of respondents in each fleet manager group at the work unit level of analysis.
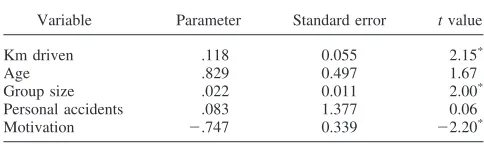
In the first analysis, we regressed self-reported crashes on the control variables and safety motivation. The analysis assumed a negative binomial distribution for reported crashes (Gardner, Mulvey, & Shaw, 1995). We used a negative binomial regres-sion to estimate the probability distribution of our dependent count measure, as the data showed more dispersion that could be accounted for under the Poisson regression model (see Table 3). The results supported Hypothesis 1, as motivation was a significant predictor of self-reported crashes, ⫽ ⫺.747, t ⫽ ⫺2.20,p⬍.05. Consistent with previous research, number of kilometers driven per week was also a significant predictor in this analysis, ⫽.118, t⫽ 2.15,p⬍ .05.
In the next analysis we assessed the driver-level predictors of safety motivation, specifically, drivers’ self-efficacy, drivers’ safety attitudes, drivers’ perceptions of fleet managers’ safety values, and drivers’ perceptions of supervisors’ safety values. We entered all variables in a single step with the control variables, and the results are reported in Table 4. In support of Hypothesis 3, perceived fleet managers’ values,␥ ⫽0.07, p⬍
.05, were positively related to motivation, but perceived super-visor values were not, ␥ ⫽ 0.02, ns. Therefore, Hypothesis 2 was not supported.
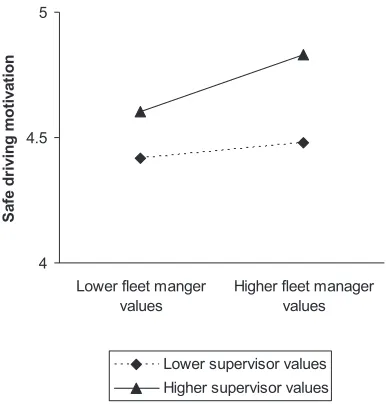
To test Hypothesis 4, which predicted that drivers’ percep-tions of fleet managers’ and supervisors’ safety values would interact in their effect on drivers’ safety motivation, another step was added to the analysis. In this second/third step, the interaction term was added to the analysis. Table 4 shows that this interaction was significant, and we have depicted the nature of the interaction in Figure 2 using procedures recommended by Aiken and West (1991). The graph shows that perceptions of fleet managers’ values were more strongly related to drivers’ motivation when perceptions of supervisors’ values were higher,␥ ⫽.09,p⬍.01. Alternatively, the interaction could be interpreted as showing that the perceptions of supervisors’ values were more strongly related to drivers’ motivation when perceptions of fleet managers’ values were higher. Thus, the form of the interaction was consistent with our hypothesis, namely, that drivers would report higher motivation to drive safely if they perceived both their supervisor and their fleet manager to value safety.
The individual difference variables, safety attitudes and self-efficacy, were also examined as driver-level predictors of safety motivation (see Table 4). The results found that both safety attitudes,␥ ⫽0.27,p⬍.001, and self-efficacy,␥ ⫽0.14,p⬍
.05, were also significantly and positively related to motivation. These results supported Hypotheses 7 and 8.
We next tested the cross-level relationships between fleet managers’ and supervisors’ perceptions of organizational safety Table 2
Means, Standard Deviations, Reliabilities, and Correlations Between Constructs
Variable M SD 1 2 3 4 5 6 7 8 9 10 11 12
1. Crashes at work 0.05 0.21 — 2. Crashes not at work 0.02 0.15 .06 —
3. Km driven 3.65 3.46 .06 ⫺.01 —
4. Age 2.71 0.59 .09 .04 .14** —
5. Safety motivation 4.47 0.60 ⫺.10* ⫺.04 ⫺.04 .06 —
6. Self-efficacy 4.46 0.59 .01 ⫺.06 ⫺.01 .08 .21*** —
7. Attitudes 3.51 0.55 .01 .01 .09 .09 .30*** .22*** —
8. Perceptions of fleet
managers’ values 3.64 1.05 .04 ⫺.01 ⫺.03 .01 .20*** .17** .09 —
9. Perceptions of
supervisors’ values 3.57 1.02 .04 .03 .01 .09 .17** .23*** .19** .48*** —
10. Group size 25.05 22.61 .10* .07 ⫺.13* ⫺.02 .05 ⫺.09 .11* .05 ⫺.03 —
11. Fleet managers’
perceptions 4.04 0.73 .01 .01 ⫺.13* ⫺.01 .06 .01 .01 .15** .03 .25*** —
12. Supervisors’
perceptions 4.48 0.36 ⫺.09 ⫺.02 .07 .03 .05 .10* .08 ⫺.08 .06 ⫺.50*** ⫺.09 —
Note. Group-level variables have been disaggregated to the individual level in the table.
*p⬍.05. **p⬍.01. ***p⬍.001.
Table 3
Negative Binomial Regression of Self-Reported Accidents on Motivation and Control Variables
Variable Parameter Standard error tvalue
Km driven .118 0.055 2.15*
Age .829 0.497 1.67
Group size .022 0.011 2.00*
Personal accidents .083 1.377 0.06
Motivation ⫺.747 0.339 ⫺2.20*
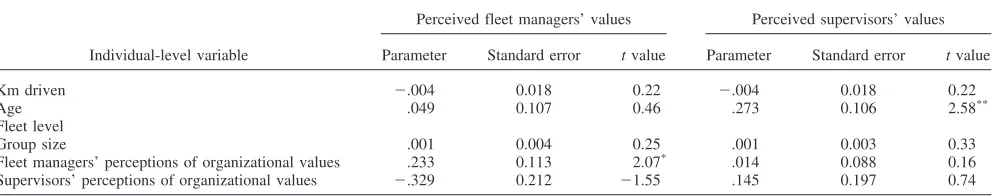
values and drivers’ perceptions of managerial (fleet manager and supervisor) safety.1 Two multilevel regression analyses were carried out, one in which the criterion was drivers’ per-ceptions of fleet managers’ safety values and another in which the criterion was drivers’ perceptions of supervisors’ safety values. Supervisors’ and fleet managers’ own perceptions of organizational safety values were tested as predictors in both analyses. The results of these analyses are reported in Table 5. The results revealed that only fleet managers’ perceptions of organizational safety values were significantly related to driv-ers’ perceptions of fleet managdriv-ers’ safety values,␥ ⫽0.09,p⬍
.05, supporting Hypothesis 6. However, supervisors’ percep-tions of organizational safety values were not related to drivers’ perceptions of supervisors’ safety values,␥ ⫽ 0.14, p⬎ .05, indicating that Hypothesis 5 was not supported.
Discussion
This study explored multilevel influences on self-reported crashes in the workplace. Specifically, the study investigated the
relationships between supervisors’ and fleet managers’ perceptions of organizational safety values, drivers’ perceptions of supervi-sors’ and fleet managers’ safety values, and drivers’ attributes in predicting self-reported crashes in the workplace. This study there-fore contributes to the field of occupational safety by integrating workplace safety value perceptions with individual attributes and using the combined set of variables to predict motivation to drive safely in a work vehicle. We found that drivers’ perceptions of supervisors’ and fleet managers’ safety values interacted to deter-mine drivers’ safety motivation, in combination with drivers’ self-efficacy and safety attitudes. Furthermore, we were able to delineate the cross-level influence of fleet managers’ perceptions of organizational safety values on drivers’ perceptions of fleet managers’ safety values.
Consistent with research investigating other forms of safety performance (Griffin & Neal, 2000; Neal & Griffin, 2004; Probst & Brubaker, 2001), in this study, motivation was found to be a critical determinant of self-reported crashes. This finding suggests that drivers are less likely to report crashes while driving for work purposes if they are motivated to drive safely.
A unique aspect of this study was that we assessed multiple influences on drivers’ perceptions of managerial safety values. Although managerial safety values have been shown to be impor-tant for other forms of safety behavior (e.g., Neal & Griffin, 2006; Zohar, 2000), this study is the first to extend this finding to safe driving motivation and to investigate the role of fleet managers in the safety of work-related drivers. First, we were able to show that
1To assess whether aggregating to the fleet management group level of
analysis underestimated the results obtained in the supervisory sample, we conducted a further analysis on a smaller subset of the data, where we matched the 121 supervisory responses to their specific supervisory work-groups. For this analysis, fleet manager measures were disaggregated to groups. In this analysis, the pattern of results was unchanged. The corre-lation between drivers’ perceptions of supervisors’ values and supervisors’ own reports wasr⫽.02 (p⬎.05), compared tor⫽.06 (p⬎.05) in the full sample. The correlation between drivers’ perceptions of fleet manag-ers’ values and the fleet managmanag-ers’ own reports wasr⫽.18 (p⬎.05), compared tor⫽.15 (p⬍.001) in the full sample. Therefore, we can conclude that aggregating the results to the fleet management level of analysis did not appear to influence the results relating to the role of supervisors.
4 4.5 5
Lower fleet manger values
Higher fleet manager values
S
a
fe
dr
iv
in
g
m
o
tiv
a
ti
o
n
Lower supervisor values Higher supervisor values
Figure 2. The interaction between supervisors’ safety values and fleet managers’ safety values on drivers’ motivations to drive safely. Table 4
Multilevel Regression of Within-Fleet Measures on Safety Motivation
Variable
Step 1 Step 2
Parameter Standard error tvalue Parameter Standard error tvalue
Km driven .002 0.009 0.22 .002 0.001 2.00*
Age .027 0.053 0.51 .025 0.052 0.48
Group size .002 0.002 1.00 ⫺.003 0.009 ⫺0.33
Safety attitudes .274 0.057 4.81*** .234 0.057 4.11***
Self-efficacy .135 0.053 2.55* .147 0.053 2.77*
Perceived supervisors’ values .019 0.035 0.54 ⫺.302 0.094 ⫺3.21***
Perceived fleet managers’ values .074 0.033 2.24* ⫺.250 0.095 ⫺2.63**
Supervisors’ Values⫻Fleet
Managers’ Values — — — .092 0.025 3.68**
drivers’ perceptions of fleet managers’ safety values, but not drivers’ perceptions of supervisors’ safety values, were related to their motivation to drive safely. This finding supports past research that has found that fleet managers play an important role in influencing the safety performance of their fleet (Newnam & Tay, 2007; Newnam et al., 2006). The nonsignificant result for super-visors was not surprising, as work-related driving safety has not been well integrated within the occupational health and safety system. As such, it is uncertain whether senior-level managers had given supervisors the directives to safely manage their fleet.
Although drivers’ perceptions of supervisors’ safety values was not found to have an independent effect on their safety motivation, supervisors were found to play an important role in the safety management of drivers. Our study found that the influence of supervisors and fleet managers interacted such that drivers were more motivated to drive safely if they perceived both their super-visor and fleet manager to value safety. These findings suggested that the combined influence of supervisors and fleet managers was likely to have a stronger effect on drivers’ safety motivation, as the climate that supervisors shaped had an effect on drivers’ percep-tions of the value given to safety by their fleet manager. In support of these results, the influence of more senior leaders within an organization has been found to be mediated by group leaders (Zohar & Luria, 2005). Therefore, within the realm of safety in the work-related driving context, there are two routes through which safety in the work vehicle can be fostered, and both fleet managers and supervisors need to be seen to promote safety values if high safety motivation is to be achieved.
Second, the multilevel component of this study was introduced by exploring the cross-level relationships between supervisors’ and fleet managers’ perceptions of organizational safety values and drivers’ perceptions of managerial safety values. We were able to show a relationship between fleet managers’ perceptions of organizational safety values and drivers’ perceptions of fleet man-agers’ safety values, which illustrates that perceptions of work-place safety values are transmitted across levels of the organiza-tion. The relationship between supervisors’ perceptions of organizational safety values and drivers’ perceptions of supervi-sors’ safety values was not significant, but this may have been because we had to aggregate supervisor groups to the fleet man-ager level, which meant loss of variance and power for the anal-ysis. It is worth noting that fleet managers’ perceptions of orga-nizational safety values did not predict drivers’ perceptions of supervisors’ safety values, even though they did predict drivers’
perceptions of fleet managers’ safety values. This finding further supports our proposition that fleet managers and supervisors rep-resent independent sources of influence on safety motivation.
Potentially, there are other workplace contexts where there may be multiple managerial influences at work. For example, in orga-nizations where there is both a discipline-based manager (who is responsible for maintaining professional standards) as well as a worksite manager (who is responsible for managing workloads and providing day-to-day supervision), there is potential for dual in-fluences on employee performance outcomes. We are not aware of any research that has attempted to delineate how these two sources of managerial influences interact under these circumstances, but our findings suggest that this may be an important area for further research.
This study also revealed that the measures of drivers’ self-efficacy and attitudes could explain additional variance within the safety framework. In particular, attitudes toward rule violations and speeding explained a relatively large proportion of variance in drivers’ safety motivation. By integrating variables from the driv-ing literature within the safety framework, we have been able to build a more inclusive model of the range of factors contributing to self-reported crashes and the pathways through which these effects occur. Furthermore, the fact that these individual attributes explained unique variance in the model supports the proposition that greater variability in safety outcomes can be taken into ac-count when individual attributes are assessed in combination with climate perceptions (Brown & Leigh, 1996; Hofmann et al., 1995). It may be that research into other forms of safety outcomes can be developed by incorporating relevant individual attributes in the safety framework.
Practical Applications
This study has applied a framework for systematically assessing safety value perceptions across multiple levels within an organi-zational hierarchy, combining these with individual attributes and using the combined set of variables to predict motivation to drive safely in a work vehicle. The results of the current study offer some practical suggestions for interventions designed to improve work-related road safety outcomes.
First, individual motivation was found to be a significant pre-dictor of work-related crashes, which suggests an avenue to di-rectly influence crash involvement. This study assessed the intrin-sic value of safety, rather than extrinintrin-sic motivators such as rewards Table 5
Multilevel Regression Predicting Perceptions of Supervisors’ and Fleet Managers’ Safety Values
Individual-level variable
Perceived fleet managers’ values Perceived supervisors’ values
Parameter Standard error tvalue Parameter Standard error tvalue
Km driven ⫺.004 0.018 0.22 ⫺.004 0.018 0.22
Age .049 0.107 0.46 .273 0.106 2.58**
Fleet level
Group size .001 0.004 0.25 .001 0.003 0.33
Fleet managers’ perceptions of organizational values .233 0.113 2.07* .014 0.088 0.16
Supervisors’ perceptions of organizational values ⫺.329 0.212 ⫺1.55 .145 0.197 0.74
and punishment (e.g., Probst & Brubaker, 2001). As such, a possible intervention could focus on providing feedback to drivers on their safety performance in a work vehicle. This type of intervention would aim to enhance drivers’ belief in the intrinsic value associated with safety through a system of positive rein-forcement (e.g., Prue & Fairbank, 1981).
Second, the study suggested that drivers reported a higher mo-tivation to drive safely if they perceived both their supervisor and fleet manager to value safety. The findings from this study, thefore, constitute a recommendation for integrating fleet safety re-sponsibilities within the roles and rere-sponsibilities of supervisors and fleet managers. Furthermore, the results also confirm that the fleet manager, as the principal contact for driving-related matters in the organization, contributes to drivers’ safety value percep-tions, which in turn predict their motivation to drive safely. This finding suggests that fleet managers are seen by drivers as a legitimate source of power within the driving context. As such, the responsibility of fleet managers in safety management could be acknowledged more formally, so that it is understood to be part of the fleet manager’s role to ensure that he or she supports the integrated organizational approach to fleet safety.
Third, the findings suggest individual-level interventions, pro-moting the negative consequences associated with rule violations and speeding and strengthening drivers’ beliefs in their ability to drive safely, should also be effective in increasing levels of safety motivation, which, in turn, reduce work-related road crashes. An intervention designed to enhance drivers’ attitudes toward traffic safety could involve an information campaign promoting the value and importance associated with complying with the traffic rules and speed limits. This strategy could be combined with driver training (Christie, 1995) or worker participation programs (Gre-gersen, Brehmer, & Moren, 1996).
Limitations
There are some limitations associated with this study. First, in this study we relied on self-report data for the outcome measure, which are open to socially desirable responding. However, this is less likely to be an issue in this particular study for two reasons. First, crashes represent infrequent and salient events, so unlike other forms of behavior (e.g., absenteeism), they are less likely to be affected by poor recall. To ensure accurate recall of crashes we also opted to use a 6-month period of recall. Second, it has been shown that self-report driving questionnaires are associated with minimal social desirability bias (Lajunen & Summala, 2003). In support of these assertions, self-report measures of crashes have been found to be strongly correlated with independent observa-tions (Lusk, Ronis, & Baer, 1995), and accurate recall of work-place accidents has also been found to be acceptable in older age groups (25–54) for up to a period of 12 months (Landen & Hendricks, 1995). Third, past research has found self-report mea-sures of crashes strongly correlate with objective meamea-sures of crashes (e.g., Lajunen & Summala, 2003). Last, organizational records of driving behaviors are known to be unreliable, as they are insufficiently sensitive, inaccurate, and retrospective, and they ignore risk exposure (Glendon & McKenna, 1995). On the basis of these justifications, we believed self-reported crashes to be a suitable outcome variable.
A second limitation was that we could not link every driver to a single supervisor. Therefore, we used the fleet management group as the unit of analysis at the aggregate level. By aggregating supervisor measures to the fleet level we may have underestimated the role of supervisors in safety processes. However, as noted in the results section, we conducted further analysis where we matched the 121 supervisory responses to their specific workgroup and found that the pattern of results was unchanged. Therefore, we can conclude that aggregating the results to the fleet management level of analysis did not influence the results relating to the role of supervisors in influencing fleet safety.
A third limitation relating to the outcome measure concerns its inability to determine culpability. In this study, we assessed driv-ers’ ability to recall crashes but did not distinguish responsibility for the crash. As such, it could be argued that crashes in which an individual is not culpable could be predicted by another variable (Wahlberg, 2003).
A fourth limitation was not directly assessing driving behavior. Considering that past research in the safety domain has investi-gated the link between motivation and performance (e.g., Griffin & Neal, 2000; Neal & Griffin, 2006), the proposed model may be viewed as making a substantial leap from motivation to self-reported crashes. However, we believed self-self-reported crashes to be an appropriate outcome for three reasons. First, as noted in the introduction, there is no questionnaire currently available to accu-rately assess work-related driving behavior. Second, some research has used a measure of accidents within an organization as a behavior-based criterion measure (Zohar, 2000; Zohar & Luria, 2004). Third, self-report measures of crashes have been found to be associated with other forms of unsafe driving behavior (e.g., speeding; e.g., D. Parker, Reason, Manstead, & Stradling, 1995; R. West, French, Kemp, & Elander, 1993). As such, we believed that self-reported crashes, rather than driving behavior, to be an appro-priate outcome measure for this setting.
A final limitation relates to the cross-sectional measurements. It was not possible to test the casual relationships proposed in this research. Therefore, reverse causation could also explain the rela-tionship between the driver variables. For example, it is possible that drivers who have had a crash and did not experience any adverse outcomes then experience lower motivation to drive safely. Future research is needed to test the casual relationships proposed in the safety framework longitudinally to provide further validation of the hypothesized relationships.
Conclusion
References
Aiken, L. S., & West, S. G. (1991).Multiple regression: Testing and interpreting interactions.Newbury Park, CA: Sage.
Ajzen, I. (1988).Attitudes, personality, and behavior.Chicago: Dorsey. Ajzen, I. (1991). The theory of planned behavior.Organizational Behavior
and Human Decision Processes, 50,179 –211.
Bandura, A. (1977).Social learning theory.Englewood Cliffs, NJ: Prentice Hall.
Bandura, A. (1986).Social foundations of thought and action: A social cognitive theory.Englewood Cliffs, NJ: Prentice Hall.
Bandura, A. (2000). Cultivate self-efficacy for personal and organizational effectiveness. In E. A. Locke (Ed.),The Blackwell handbook principles of organizational behavior(pp. 120 –136). Oxford, England: Blackwell. Barling, J., & Zacharatos, A. (1999, August).High performance safety systems: Management practices for achieving optimal safety perfor-mance.Paper presented at the 25th annual meeting of the Academy of Management, Toronto, Ontario, Canada.
Brown, S. P., & Leigh, T. W. (1996). A new look at psychological climate and its relationship to job involvement, effort, and performance.Journal of Applied Psychology, 81,358 –368.
Bureau of Labor Statistics. (2004).Census of fatal occupational injuries. Retrieved from http://www.bls.gov/iif/oshwc/cfoi/cfch0003.pdf Caird, J. K., & Kline, T. J. (2004). The relationships between
organiza-tional and individual variables to on-the-job driver accidents and accident-free kilometers.Ergonomics, 47(15), 1598 –1613.
Campbell, J. P., McCloy, R. A., Oppler, S. H., & Sager, C. R. (1993). A theory of performance. In J. Schmitt & W. C. Borman Associates (Eds.), Personnel selection in organizations (pp. 35– 69). San Francisco: Jossey-Bass.
Chen, G., Gully, S. M., & Eden, D. (2001). Validation of a new general self-efficacy scale.Organizational Research Methods, 4(1), 62– 83. Christie, R. (1995, September).Driver training: What have we learned?
Paper presented at the National Roads & Motorists Association’s Crashes, Costs and Causes Seminar, Sydney, Australia.
Davey, J., Wishart, D., Freeman, J., & Watson, B. (2007). An application of the driver behavior questionnaire in an Australian organizational fleet setting.Transportation Research Part F, 10,11–21.
Dienesch, R. M., & Liden, R. C. (1986). Leader–member exchange model of leadership: A critique and further development.Academy of Manage-ment Review, 11,618 – 634.
Downs, C. G., Keigan, M., Maycock, G., & Grayson, G. B. (1999).The safety of fleet car drivers: A review(Report No. 390). Crowthorne, England: Transport Research Laboratory.
Eagly, A. H., & Chaiken, S. (1993).The psychology of attitudes.Orlando, FL: Harcourt Brace Jovanovich.
Gardner, W., Mulvey, E. P., & Shaw, E. C. (1995). Regression analyses of counts and rates: Poisson, overdispersed Poisson, and negative binomial models.Psychological Bulletin, 118(3), 392– 404.
Gist, M. E. (1987). Self-efficacy: Implications for organizational behavior and human resource management.Academy of Management Review, 12, 472– 485.
Gist, M. E., & Mitchell, T. R. (1992). Self-efficacy: A theoretical analysis of its determinants and malleability.Academy of Management Review, 17(2), 183–211.
Glendon, A. I., & McKenna, E. F. (1995).Human safety and risk man-agement.London: Chapman and Hall.
Goldstein, H., Rasbash, J., Plewis, I., Draper, D., Browne, W., Yang, M., et al. (1998).A user’s guide to MLwiN.London: Institute of Education. Gregersen, N. P., Brehmer, B., & Moren, B. (1996). Road safety improve-ments in large companies: An experimental comparison of different measures.Accident Analysis and Prevention, 28,297–306.
Griffin, M. A., & Neal, A. (2000). Perceptions of safety at work: A framework for linking safety climate to safety performance, knowledge
and motivation.Journal of Occupational Health Psychology, 5(3), 347– 358.
Hofmann, D. A., Jacobs, R., & Landy, F. L. (1995). High reliability process industries: Individual, micro, and macro organizational influences on safety performance.Journal of Safety Research, 26,131–149. Hofmann, D. A., & Morgeson, F. P. (1999). Safety-related behavior as a
social exchange: The role of perceived organizational support and leader–member exchange.Journal of Applied Psychology, 84(2), 286 – 296.
Hofmann, D. A., Morgeson, F. P., & Gerras, S. J. (2003). Climate as a moderator of the relationship between leader–member exchange and content specific citizenship: Safety climate as an exemplar.Journal of Applied Psychology, 88(1), 170 –178.
Hofmann, D. A., & Stetzer, A. (1996). A cross-level investigation of factors influencing unsafe behaviors and accidents.Personnel Psychol-ogy, 49(2), 307–339.
Iversen, H., & Rundmo, T. (2004). Attitudes towards traffic safety, driving behavior and accident involvement among the Norwegian public. Ergo-nomics, 47(5), 555–572.
Judge, T. A., Erez, A., & Bono, J. E. (1998). The power of being positive: The relationship between positive self-concept and job performance. Human Performance, 11,167–187.
Lajunen, T., & Summala, H. (2003). Can we trust self-reports of driving? Effects of impression management on driver behavior questionnaire responses.Transportation Research Part F, 6,97–107.
Landen, D. D., & Hendricks, S. (1995). Effect of recall on reporting of at-work injury.Public Health Reports, 110,350 –354.
Lawton, R., Parker, D., Manstead, A. S. R., & Stradling, S. G. (1997). The role of affect in predicting social behaviors: The case of road traffic violations.Journal of Applied Social Psychology, 27,1258 –1276. Lee, C., & Bobko, P. (1994). Self-efficacy beliefs: Comparison of five
measures.Journal of Applied Psychology, 79(3), 364 –369.
Lusk, S., Ronis, D., & Baer, L. (1995). A comparison of multiple indica-tors: Observations, supervisor report, and self-report measures of work-er’s hearing protection use. Evaluation and the Health Professions, 18(1), 51– 63.
Lynn, P., & Lockwood, C. R. (1998).The accident liability of company car drivers (Report No. 317). Crowthorne, England: Transport Research Laboratory.
Maierhofer, N. I., Griffin, M. A., & Sheehan, M. (2000). Linking manager values and behavior with employee values and behavior: A study of values and safety in the hairdressing industry.Journal of Occupational Health Psychology, 5(4), 417– 427.
Mearns, K., Flin, R., Gordon, R., & Fleming, M. (1998). Measuring safety climate on offshore installations.Work and Stress, 12,238 –254. Murray, W., Newnam, S., Watson, B., Schonfeld, C., & Davey, J. (2003).
Evaluating and improving fleet safety in Australia.Canberra, Australia: Australian Transport Safety Bureau.
Neal, A., & Griffin, M. A. (2004). Safety climate and safety at work. In M. R. Frone & J. Barling (Eds.),The psychology of workplace safety(pp. 15–34). Washington, DC: American Psychological Association. Neal, A., & Griffin, M. A. (2006). A study of the lagged relationships
among safety climate, safety motivation, safety behavior, and accidents at the individual and group levels.Journal of Applied Psychology, 91(4), 946 –953.
Neal, A., Griffin, M. A., & Hart, P. M. (2000). The impact of organiza-tional climate on safety climate and individual behavior.Safety Science, 34,99 –109.
Newnam, S., & Tay, R. (2007). Evaluation of a fleet safety management system.Journal of Advanced Transportation, 41(1), 39 –52.
Newnam, S., Tay, R., & Mason, C. (2006). Using psychological frame-works to inform the evaluation of fleet safety initiatives.Safety Science, 44,809 – 820.
factors influencing work-related drivers in a work and personal vehicle. InProceedings of the Road Safety Research, Policing and Education Conference,Adelaide, Australia.
Newnam, S., Watson, B., & Murray, W. (2004). Factors predicting inten-tions to speed in a work and personal vehicle.Transportation Research Part F, 7,287–300.
O’Toole, M. (2002). The relationship between employees’ perceptions of safety and organizational culture.Journal of Safety Research, 33,231– 243.
Parker, D., Anthony, S. R., Manstead, A. S. R., Stradling, S. G., Reason, J. T., & Baxter, J. S. (1992). Intention to commit driving violations: An application of the theory of planned behavior.Journal of Applied Psy-chology, 77(1), 94 –101.
Parker, D., Lajunen, T., & Stradling, S. G. (1998). Attitudinal predictors of interpersonally aggressive violations on the road.Transport Research, 1, 11–24.
Parker, D., Reason, J. T., Manstead, A. S. R., & Stradling, S. G. (1995). Driving errors, driving violations and accident involvement. Ergonom-ics, 38,1036 –1048.
Parker, D., Stradling, S. G., & Manstead, A. S. (1996). Modifying beliefs and attitudes to exceeding the speed limit: An intervention study based on the theory of planned behavior.Journal of Applied Social Psychol-ogy, 26,1–19.
Parker, S. K., Axtell, C. M., & Turner, N. (2001). Designing a safer workplace: Importance of job autonomy, communication quality and supportive supervisors. Journal of Occupational Health Psychology, 6(3), 211–218.
Probst, T. M., & Brubaker, T. L. (2001). The effect of job insecurity on employee safety outcomes: Cross-sectional and longitudinal explora-tions.Journal of Occupational Health Psychology, 6(2), 139 –159. Prue, D. M., & Fairbank, J. A. (1981). Performance feedback in
organi-zational behavior management: A review. Journal of Organizational Behavior Management, 3(1), 1–16.
Reason, J., Manstead, A., Stradling, S., Baxter, J., & Campbell, K. (1990). Errors and violations: A real distinction?Ergonomics, 33,1315–1332. Renn, R. W., & Fedor, D. B. (2001). Development and field test of a feedback seeking, self-efficacy, and goal setting model of work perfor-mance.Journal of Management, 27,563–583.
Rothe, P. (1991). The truckers’ world: Risk, safety and mobility.New York: Transaction.
Stajkovic, A. D., & Luthans, F. (1998). Self-efficacy and work-related performance: A meta-analysis.Psychological Bulletin, 124(2), 240 –261. Tay, R. (2004). The relationship between public education and enforce-ment campaigns and their effectiveness in reducing speed related serious crashes.International Journal of Transport Economics, 31(2), 251–255.
Tay, R. (2005). Drunk driving enforcement and publicity campaigns: Are the policy recommendations sensitive to model specifications?Accident Analysis and Prevention, 37(2), 259 –266.
Tay, R., & Watson, B. (2002). Changing drivers’ intentions and behaviors using fear-based driver fatigue advertisements.Health Marketing Quar-terly, 19(4), 55– 68.
Vancouver, J. B., Thompson, C. M., & Williams, A. A. (2001). The changing signs in the relationships between self-efficacy, personal goals, and performance.Journal of Applied Psychology, 86,605– 620. Wahlberg, A. E. (2003). Some methodological deficiencies in studies of
traffic accident predictors.Accident Analysis and Prevention, 35,473– 486.
West, R., French, D., Kemp, R., & Elander, J. (1993). Direct observation of driving, self-reports of driver behaviour, and accident involvement. Ergonomics, 36,557–567.
West, S., Finch, G., Curran, J. F., & Patrick, J. (1995). Structural equation models with nonnormal variables: Problems and remedies. In R. H. Hoyle (Ed.),Structural equation modeling: Concepts, issues, and appli-cations(pp. 56 –75). Thousand Oaks, CA: Sage.
Wicker, A. W. (1969). Attitudes versus actions: The relationship of verbal and overt behavioral responses to attitude objects.Journal of Social Issues, 25(4), 41–78.
Wills, A. R., Watson, B., & Biggs, H. C. (2004). The relative influence of fleet safety climate on work-related driver safety. InProceedings of the Australasian Road Safety Research, Education and Policing Confer-ence,Perth, Australia.
Zohar, D. (1980). Safety climate in industrial organizations: Theoretical and applied implications.Journal of Applied Psychology, 65(1), 96 –102. Zohar, D. (2000). A group-level model of safety climate: Testing the effects of group climate on microaccidents in manufacturing jobs. Jour-nal of Applied Psychology, 85(4), 587–596.
Zohar, D. (2002). Modifying supervisory practices to improve subunit safety: A leadership-based intervention model.Journal of Applied Psy-chology, 87(1), 156 –163.
Zohar, D., & Luria, G. (2004). Climate as a social-cognitive construction of supervisory safety practices: Script as proxy of behavior patterns. Journal of Applied Psychology, 89(2), 322–333.
Zohar, D., & Luria, G. (2005). A multilevel model of safety climate: Cross-level relationships between organizational and group-level cli-mates.Journal of Applied Psychology, 90(4), 616 – 628.
Received April 27, 2006 Revision received November 14, 2007