DIMENSION ANALYSIS OF SABO WORKS ON
COUNTERMEASURES DEBRIS FLOWS IN PUTIH RIVER,
INDONESIA
Jazaul Ikhsan
1, Puji Harsanto
2, Tria Wulandari Octaviani
3Sutikno Hardjosuwarno
4, Adam Pamudji Rahardjo
51.
Dept. of Civil Engineering, University of Muhammadiyah Yogyakarta, Indonesia 55183, [email protected]
2.
Dept. of Civil Engineering, University of Muhammadiyah Yogyakarta, Indonesia
3.
Dept. of Civil Engineering, University of Muhammadiyah Yogyakarta, Indonesia
4
Sabo Research Center, Ministry of Public Works, Yogyakarta, Indonesia
5
Dept. of Civil Engineering, Gadjah Mada University, Yogyakarta, Indonesia
Abstract
After Mt. Merapi eruption, abundant of sediment was deposited in its slopes. In rainy season, the deposited sediment will be brought by discharge as debris flows. In order to reduce the negative impacts of debris flows, government constructed sabo works. Therefore, it is important to study effects of sabo works dimension on countermeasures debris flows. This study took Putih River as study case, which located on the western part of Mt. Merapi. SIMLAR V.1.0 software was used to simulate debris flow phenomena. Rainfall data was processed using Nakayashu method to obtain discharge for simulations. Topographical data as initial condition was used DEM with precision 20 x 20. Grain size of riverbed material was used from field. The simulations were conducted in three conditions, namely no sabo works, with sabo works in existing condition and modified dimension of sabo works. Result showed that in the simulation with no sabo works, debris flow velocity was relative high, so this condition was dangerous for inhabitant along the river. With sabo works in existing condition, debris flow velocity could be reduced, even though there were villages buried by sediment.
Key Words: Sediment Disaster, Debris Flows, Sabo Works, Mt. Merapi
1. INTRODUCTION
Sediment related disaster is a natural phenomenon that happened closely related to the process of stream sediment. Sediment related disaster also called the natural dynamics in the form of a displacement of soil and rock material (sediment) that cause landslides, ground motion, flow of lava in the volcano area and so on. Debris flow occurred in almost rainy season.
Nowadays disaster management already has better improvement in non-structure by using some equipment to tell other if there is any disaster will happen thus people can escape right before the disaster happen or structure prevention to help human lives. Another example for the prevention in non-structure method is using Simlar V.1.0 software to forecast the danger area / debris flow that usually found in volcanic district. Apart from it, in structure prevention by constructs installation to prevent the debris flow damages.
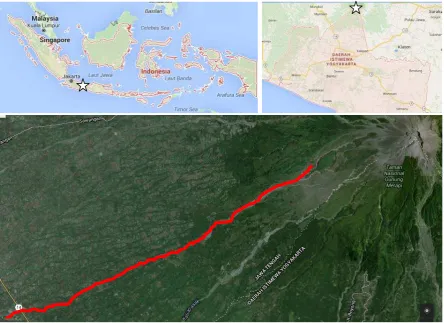
Fig 1. Location of Putih River, Yogyakarta, Indonesia
2. METHODS
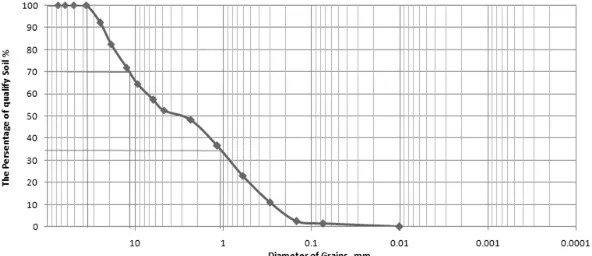
Data was used in this research consisted of hydrology data such as annual daily rainfalls data, Putih River’s catchment area map or Digital Elevation Model, soil investigation obtained from result of investigation soil material in laboratory data and the data of specification of Sabo Work.. The daily rainfalls data and Putih River’s catchment area map or Digital Elevation Model was taken from Sabo Center, Yogyakarta, Indonesia. The daily rainfalls data of the Ngepos Station in January are presented in Table 1. According to the Table 1, the highest daily rainfalls data occurred in 23th of January were calculated by Nakayashu method to obtain hydrograph data that shown in Fig. 2. The Digital Elevation Model is shown in Fig. 3.The investigation result of soil Fig. 4.
Date 22 23 24
Time
13.00-14.00 11.5 66.5 0.0
14.00-15.00 2.0 24.5 12.5
15.00-16.00 2.5 1.5 0.5
16.00-17.00 0.0 0.5 0.0
17.00-18.00 0.5 0.5 3.6
Fig 2. Hydrograph Data Calculated by Nakayashu method
Fig 3. Digital Elevation Model of Putih River
Fig 4. Grain Size Distribution of the Soil Sample
3. SIMULATION LAHAR (SIMLAR) V.1.0
Simulation Lahar (SIMLAR) software is developed by Sabo Center and UGM, based on JICA –STC’s 2D Numerical Simulation of Riverbed Fluctuation and Deposition of Lahar. The software is modified on interface and added some sediment transport formulas, as Ashida-Takahashi-Mizuyama formula. The governing equations used in the software are follows:
a. Momentum equation
(1)
b. Continuity equation
(2) ( ) ( )
by
N uN vN H
gh
t x y y
δ βδ βδ δ τ
δ + δ + δ = − δ −
0
h M N
t x y
∂ ∂ ∂
Where, h is dept of flow, t is time, x and y are the coordinate along the longitudinal and transversal direction, g is the gravity force, M and Nare velocity in x and y direction, τby is turbulence stress.
c. Continuity of sediment discharge
(3)
Where
c
∗is sediment concentration in riverbed;q
Bxand qByare sediment discharge in x and ydirections, which consists bed load and riverbank erosion.
Some sediment discharge equation which used in the numerical model of debris flow 2D are as follows.
d. Ashida-Takahashi-Mizuyama equation:
)
f. Meyer Peter Muller equation: 5
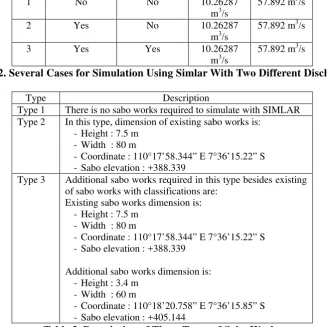
4. SIMULATION SCENARIOS
In this experimental program, the goal is to analyze the effectiveness of sabo works by forecast the flow may occurred in danger area based on result from SIMLAR software. So that it is necessary to process all the data required in two conditions, there are without existing of sabo works and with existing sabo works condition as seen in Table 2. The data required to process in SIMLAR such as, the annual daily rainfalls data was calculate with Nakayashu method to obtain the peak of discharge from the combination of hydrograph but in this case only fifteen hour of daily rainfall data used from twenty four hour a day to process in SIMLAR Software. Grain size distribution of the soil sample also obtained from calculation of investigation soil sample. And also the Dimension of sabo works to
analyze the effectiveness of sabo works (Table 3). Hereinafter all the data required was inputted later on SIMLAR Program to obtain the spread of debris flow to analyze the effectiveness of sabo works PU-C2.
Type
Cases Description Existing
of sabo works
Additional of sabo works
Discharge 1 Discharge 2
1 No No 10.26287 m3/s
57.892 m3/s
2 Yes No 10.26287 m3/s
57.892 m3/s
3 Yes Yes 10.26287 m3/s
57.892 m3/s
Table 2. Several Cases for Simulation Using Simlar With Two Different Discharges
Type Description
Type 1 There is no sabo works required to simulate with SIMLAR Type 2 In this type, dimension of existing sabo works is:
-Height : 7.5 m -Width : 80 m
-Coordinate : 110°17’58.344” E 7°36’15.22” S -Sabo elevation : +388.339
Type 3 Additional sabo works required in this type besides existing of sabo works with classifications are:
Existing sabo works dimension is: -Height : 7.5 m
-Width : 80 m
-Coordinate : 110°17’58.344” E 7°36’15.22” S -Sabo elevation : +388.339
Additional sabo works dimension is: -Height : 3.4 m
-Width : 60 m
-Coordinate : 110°18’20.758” E 7°36’15.85” S -Sabo elevation : +405.144
Table 3. Description of Three Types of Sabo Works
4. RESULT AND DISCUSSION
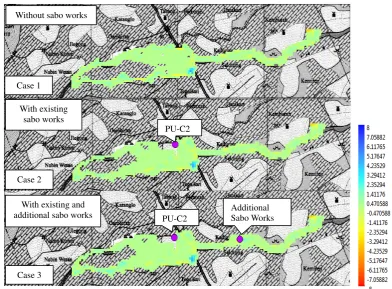
In this case, the discussion focuses on two hours with total discharges of 10.26287 m3/s in first hour and 57.892 m3/s in second hour, in order to compare the influence of two conditions, with sabo works and without sabo works. Based on result of SIMLAR V.1.0, the spread of debris flow in first hour with total of discharge 10.26287 m3/s is illustrated in Fig. 5. In condition 1, the flow hurtling because there is no sabo works. In the other hand, in condition 2 which is lies existing of sabo works, the flow slides not as far as condition 1 but there is a widen flow in certain area so that additional sabo works needed to be added in this case. In condition 3 which is lies additional of sabo works, the flow decrease less then condition 2. The colour representatives sediment and erosion happened.
Fig. 5. Results of First Hour in 3 Cases
Hereinafter the spread of sabo works in second hour with total discharge of 57.892 m3/s is illustrated in Fig. 6. In condition 1 to 3 with total discharge of 57.892 m3/s the flow seen equal in each condition.
Fig. 6. Results of Second Hour in 3 Cases Without sabo works
With existing sabo works
With existing and
additional sabo works PU-C2 PU-C2
Additional Sabo Works Case 1
Case 2
Case 3
Without sabo works
With existing sabo works
With existing and
additional sabo works PU-C2 PU-C2
Additional Sabo Works Case 1
Case 2
Based on the result shown in Fig. 6, we could get some conclusions such as if discharge of debris flow is very high, river couldn’t deliver flow from upper to lower area, the area surrounding river is buried by sediment. Sabo works could reduce the area buried by sediment from debris flows. Additional sabo works could increase capacity for sediment, so the impact of debris flows could be reduced.
5. CONCLUSIONS
Sabo works is effective to reduce the impact of debris flows. Improvement of sabo works structure is important to prevent the debris flow effectively. However, it is necessary to do some study or research to obtain the right dimension of sabo works.
Acknowledgements
The author is grateful for University of Muhammadiyah Yogyakarta, Indonesia, through internationalization program, which has supported author to conduct publicizing in this workshop.
References
[1] Hasnawir, 2012, Sediment disaster mitigation, Division of Forestry Research in Makassar, Ministry of Forestry, South Sulawesi, Indonesia (in Indonesian).
[2] Putro, S,H., 2011, The impact of debris flow in Mount Merapi after eruption in Putih River , Proceeding of National Seminar on Developing Merapi Area, pp. 103-111 (in Indonesian).
[3] Soeryono, et.al., 2011, Guidelines for construction and building: How to make debris flow hazard maps, Ministry of Public Work, Indonesia (in Indonesian)
[4] Suparman, T.soetopo, Soenar W, Djoko S, Hendro P, 2011, Sabo works for prevention of disaster mitigation caused of sediment, Air Adhi Eka Foundation, Jakarta, Indonesia (in Indonesian)
[5] Sutikno H, 2003, Application of 2D simulation models for forecasting flood prone areas of volcanic lava area in Lumajang Regency East Java, Proceedings of the National Workshop Towards Ecosystem-Based Resource Management Areas To Reduce Potential Conflicts of Inter-Regional Sabo Research Center, Water Resources Research Center, Ministry of Public Work, Indonesia (in Indonesian)