Canopy quantum yield in a mesocosm study
Yiqi Luo
a,∗, Dafeng Hui
a, Weixin Cheng
b, James S. Coleman
c,
Dale W. Johnson
c, Daniel A. Sims
daDepartment of Botany and Microbiology, University of Oklahoma, Norman, OK 3019, USA bEnvironmental Studies Department, University of California, Santa Cruz, CA 95064, USA
cBiological Sciences Center, Desert Research Institute, Reno, NV 89512, USA
dDepartment of Biology and Microbiology, California State University, Los Angeles, CA 90032, USA Received 12 March 1999; accepted 5 August 1999
Abstract
Due to past limitations in experimental technology, canopy function has generally been inferred from leaf properties through scaling and/or indirect measurements. The development of a facility (EcoCELLs) at the Desert Research Institute has now made it possible to directly measure canopy gas exchange. In this experiment, sunflowers (Helianthus annus) were planted in the EcoCELLs and grown under ambient (399mmol mol−1) and elevated (746mmol mol−1) CO2concentrations.
We continuously measured carbon flux during canopy development from which canopy quantum yield (φC) was estimated.
The results indicated that the total daily carbon flux was similar between elevated and ambient CO2treatments in the early
stage of canopy development. After the canopy closed, carbon flux under elevated CO2averaged 53% higher than that under
ambient CO2. Assimilation/incident irradiance (A/I) curves of leaves at different canopy positions were used to estimate
leaf quantum yields (φL), and A/I curves of canopies at late development stages were used to estimateφC. Elevated CO2
enhancedφLby 24%. There was little difference inφLat different canopy positions, averaging 0.0542 at ambient CO2and
0.0671 at elevated CO2. Canopy quantum yield (φC) was higher by 32% at elevated than ambient CO2. It increased with
canopy development and was strongly correlated with leaf area index (LAI) byφC=0.0094 LAI/(0.0829+0.1137 LAI) at
ambient CO2andφC=0.01382 LAI/(0.1129+0.1224 LAI) at elevated CO2. In addition, the curvilinear relationship between
radiation and canopy carbon fluxes suggests that canopy radiation use efficiency (CRUE) varied with radiation availability. The variability inφCand CRUE with canopy development and light levels warrants further research on the notion drawn from
earlier work that CRUE in non-stressed conditions is relatively constant. ©2000 Elsevier Science B.V. All rights reserved.
Keywords: Carbon flux; Canopy; Leaf area index; Light use efficiency; Photosynthesis; Quantum yield; Radiation use efficiency; Scaling
1. Introduction
Plant canopy plays a critical role in determining ecosystem primary productivity and also in regulating biosphere-atmosphere exchanges in energy, water,
at-∗Corresponding author.+1-405-325-1651; fax:+1-405-325-7619.
E-mail address: [email protected] (Y. Luo).
mospheric CO2, and various pollutants. Photosynthe-sis, which determines the rate of CO2exchange, has been extensively studied at biochemical and leaf lev-els during the past few decades. As a consequence, we have developed a firm understanding of the biochem-istry and ecophysiology of leaf photosynthesis (Far-quhar et al., 1980; Harley et al., 1992). Our knowl-edge of canopy photosynthesis, however, is limited due to technological constraints in experimentation.
Direct measurement of canopy photosynthesis is very difficult although some indirect methods have been employed. Micrometeorological techniques, such as the eddy correlation method, have become very useful tools in measuring net ecosystem CO2exchange (Bal-docchi, 1993). Together with other experimental data (e.g. CO2flux from the soil surface and plant respira-tion), the net ecosystem CO2fluxes can be partitioned to quantify canopy photosynthetic activity. Remotely sensed data of vegetation indices have been used to estimate absorbed photosynthetically active radiation (PAR), providing time-integrated estimates of photo-synthesis across landscapes (Waring et al., 1995). Such estimation requires prior knowledge of the apparent quantum efficiency of canopies and the extent to which environmental factors constrain stomatal conductance. Modeling studies of canopy photosynthesis usu-ally consider heterogeneity in direct versus diffuse radiation, temperature profile, and nitrogen distribu-tion within the canopy (Raupach and Finnigan, 1988; Reich et al., 1990, Whitehead and Hinckley, 1991; Norman, 1993; Amthor, 1994; McNaughton, 1994; Waring et al., 1995). It has been shown that simulation of sun and shade leaves is crucial in estimating canopy carbon fluxes. Modeling studies that consider nitrogen distribution can also substantially improve estimation of canopy assimilation (Hirose et al., 1997). Among all these variables, light environment probably is the driving variable in determining other biological and environmental variation within the canopy. Modeling studies of canopy photosynthesis, based on the light response of photosynthesis by individual leaves and the attenuation of PAR in the canopy, show that the apparent quantum yield (φ) is of greater importance to productivity than the maximum rate of photosynthesis (Lawlor, 1995; de Pury and Farquhar, 1997). A sim-ilar conclusion that increases in quantum yield could account for major changes in canopy photosynthesis was reached earlier by Charles-Edwards (1982) and Baker and McKiernan (1988).
Quantum yield is the initial slope of the photosyn-thetic light response curve and represents the maxi-mum efficiency of light utilization in photosynthesis. It has been extensively studied at the leaf level (Emer-son, 1958; Ehleringer and Björkman, 1977; Ehleringer and Pearcy, 1983; Kirschbaum and Farquhar, 1987; Long and Drake, 1991; Lai and Edwards, 1995; Kubiske and Pregitzer, 1996). Since the theoretical
minimum light requirement for fixation of 1 mol CO2 is 8 mol photons, the maximum φ is 0.125 mol CO2 per quanta. In real plants, the quantum require-ments are between 8.4 and 13.7 mol photon mol−1 CO2 as demonstrated by Ehleringer and Björkman (1977), Ku and Edwards (1978), and Farquhar and von Caemmerer (1982). Experimental measurements have indicated thatfof CO2fixation under ambient CO2 levels and moderate temperatures is similar in C3plants and C4plants. Other studies have confirmed that φ is fairly insensitive to growth environments and species but varies with measurement temperature as well as CO2 and O2 concentration. The insensi-tivity of φ to growth environment and interspecific variation within either C3 or C4 species has a very important implication for predicting relative C3 and C4species distributions over global terrestrial ecosys-tems (Ehleringer, 1978; Ehleringer et al., 1997).
Canopy CO2fluxes have been studied in relation to solar radiation (see an extensive review by Ruimy et al., 1995). Measurements of canopy CO2 fluxes are usually made by micrometeorological methods (e.g. eddy correlation) or using enclosure chambers. The measurements with the eddy correlation apparatus rep-resent an integration of vegetation gas exchange over large, upwind areas. A so-called footprint issue (see Kaharabata et al., 1997), however, makes it difficult to relate the measurements to particular plants or groups of plants and thus, to probe ecological mechanisms underlying the eddy-correlation measurements. In ad-dition, the eddy-correlation method may substantially overestimate net ecosystem carbon exchange because of its limitation in quantifying nighttime carbon re-lease via ecosystem respiration (Lee, 1997). Measure-ments with enclosure chambers have generally been conducted with plants in pot studies or small areas of vegetation in natural ecosystems. Plants in pot stud-ies rarely form a canopy with typical structure of light and nitrogen distributions. Enclosure chambers used in field studies are often designed for portability and not for long-term flux measurements.
leaf-to-canopy scaling issues (Griffin et al., 1996), for balancing ecosystem carbon budget (Cheng et al., 1999), for understanding canopy photosynthetic accli-mation (Sims et al., 1999), and for quantifying canopy radiation and water use efficiencies (Hui et al., 1999). In this study, we utilized data from continuous mea-surements (24 h per day) of canopy photosynthetic CO2fluxes during the experimental period of 58 days to examine how canopy development and elevated CO2interactively affect ecosystem carbon fluxes. By combining these results with leaf-level measurements, we also compareφCwith leaf quantum yield (φL).
2. Material and methods
2.1. Experimental facility, plant material and experiment design
This project utilized a facility (EcoCELLs) de-veloped at the Desert Research Institute, Reno, NV, USA (Griffin et al., 1996) to study leaf and canopy quantum yield and carbon flux during canopy de-velopment. An EcoCELL is a large environmentally controlled and naturally lit plant growth chamber (7.3×5.5×2.4 m3). There are three soil containers (2.85×1.3×1.8 m3) within each EcoCELL. The main features of the facility include: (1) the Eco-CELLs have the same theory of operation as leaf-level gas exchange systems but work at a much larger scale with continuous flux measurements; (2) by providing ecosystem-level measurements under controlled en-vironmental conditions, the EcoCELLs can provide data to independently evaluate canopy and ecosystem models under ambient and non-ambient CO2 condi-tions. Our previous (Griffin et al., 1996) and present studies indicate that canopy CO2 flux measurements can be made with a high degree of accuracy in the EcoCELLs. In this study, all soil containers were filled with a constructed soil profile including three layers from top down: 0–0.4 m with 1 : 1 mix of top soil from Kansas Tallgrass prairie and washed river sand; 0.4–0.8 m with washed river sand; 0.8–1.8 m with washed river bed pebbles. We have chosen the Kansas prairie soil because its isotopic signal is useful in quantifying rhizosphere carbon processes (Cheng et al., 1999).
Seeds of sunflowers (Helianthus annus, Johnny’s, Albin, ME, USA) were planted in rows with a space of 30 cm in two EcoCELLs at ambient CO2 (399±13mmol mol−1, mean±standard deviation) and elevated CO2 (746±14mmol mol−1), respec-tively. There were 108 plants in each EcoCELL. Sunflowers were used in this experiment because of (1) their typical CO2 responsiveness, (2) large leaf areas allowing for leaf-level measurements, and (3) clear understory for soil surface measurements. Water supply was controlled by whole system weight data and plants were watered with a drip irrigation system to maintain soil water content in the range from 60 to 90% of field water holding capacity in both Eco-CELLs. Temperatures were controlled at 28◦C in the daytime and 13◦C at night. Relative humidity was set at 30% during day and 60% at night. The experiment started on 7 July, 1997 and was terminated on 28 Au-gust, 1997. Most of the days during the experimental period were cloudless.
2.2. Carbon flux measurements
Leaf-level light response curves were recorded with an open flow infrared gas analysis system (Li-6400, Li-cor, Lincoln, NE, USA) at the end of the experi-ment. Three plants were randomly selected from the edge to the middle of the canopy in each EcoCELL. Five or six leaves (leaf number 6, 9, 12, 15, 18 and 21 counting from the oldest leaves) of each plant were used to measure photosynthetic response to incident light intensity. Light response curves were measured by varying the light intensity using a LED light source (Li-6400-02, Li-Cor, Lincoln, NE, USA) and record-ing the steady-state photosynthetic rates at eight in-tensities: 10, 50, 100, 200, 500, 1500, and 2000mmol quanta m−2s−1. In total, 35 light response curves were obtained in two EcoCELLs.
Rather, we considered canopy edge effect and adjusted carbon fluxes to the ground surface area that varied as canopy was developing.
Light levels in each of the EcoCELLs were mon-itored with a quantum sensor (9901–013, Li-Cor, Lincoln, NE, USA) mounted parallel to the sur-face of the pots, well above the plant canopy. Be-cause the canopy in the EcoCELLs has a cubic shape and did not form a infinite canopy surface area like in the natural field, quantum fluxes in the EcoCELLs were adjusted by considering di-rect solar radiation on the edges using an equation C=1+((W·cos(θ)+L·cos(90–u)) / (W·L))(H/tan(β)) where C is the correction factor, W the width of canopy, L the length of canopy, H the height of canopy, θ is the solar beam angle from true north measured in the horizontal plane (i.e. azimuth an-gle), andβ is the zenith angle. The term W·L repre-sents the area of the canopy top surface. The term (W·cos(θ)+L·cos(90–θ))(H/tan(β)) is projected side surface area that received light. Calculation ofθ and β follows formula given by Campbell and Norman (1998).
2.3. Estimation of leaf and canopy quantum yields
Assimilation/irradiance (A/I) curves from 35 leaf measurements were used to derive leaf quantum yield (φL). Canopy gross photosynthetic CO2fluxes and in-cident irradiance in the morning from sunrise to noon (31 July–27 August, 1997) were used to derive canopy quantum yield (φC). In order to compare results of this study with others (Ruimy et al., 1995), we selected the rectangular hyperbolic equation as the primary model to fit both leaf and canopy A/I curves by
Pn= φPg∗I P∗
g +φI
−R
where Pnis net photosynthesis, Pg∗the maximal value of gross photosynthesis,φeither leaf (φL) or canopy (φC) quantum yield, I the irradiance, and R is the dark respiration. Leaf dark respiration was estimated by Pg at I=0 for leaf-level measurements. Ecosystem dark respiration was plant and soil respiration during the daytime that was estimated from nighttime respira-tion of entire ecosystem corrected with Q10equaling 2 for the temperature difference between night and day
(13◦C and 28◦C, respectively). Leaf and canopy gross photosynthesis was calculated from measurements of leaf and canopy carbon fluxes, respectively, plus res-piration.
To evaluate the robustness of the estimated φC by the rectangular hyperbolic model, we also used two other methods to compute φC. One is the non-rectangular hyperbolic model:
θ Pg2−(φC′I +Pg∗)Pg+φC′I P ∗ g =0
whereφC′ is the canopy quantum yield estimated by the non-rectangular hyperbolic model andθis the cur-vature of the non-rectangular function. When θ=0, the above equation reduces to the rectangular hyper-bola. The other is a linear equation assuming Pg=0 when I=0:
Pg=φc′′I
where φC′′ is the canopy quantum yield estimated by the linear model from the A/I data with I≤250mmol m−2s−1.
2.4. Measurements of leaf area index (LAI)
The total number of leaves per plant from a ran-dom subset of plants in each EcoCELL was counted. Actual leaf areas were calculated from measurements of leaf length and width using an allometric relation-ship developed for a similar set of leaves. The means of four measurements in each EcoCELL were used as observed LAI values.
2.5. Pseudo-replication and statistical analysis
of system-level measurements and found that more than 95% of 96 data points over a 24 h period var-ied within±0.5mmol m−2s−1in both the EcoCELLs. This variation is extremely small compared to the mag-nitude of canopy CO2 exchange, which ranged from 5mmol m−2s−1in the early stage of canopy develop-ment to 50mmol m−2s−1toward the end of the exper-iment. It is a common practice in biophysical studies that measurements are made with no or less replica-tion if the instruments have high accuracy. For exam-ple, canopy flux measurements made by Wofsy et al. (1993), in Harvard Forests with an eddy-correlation apparatus were not replicated. Second, the primary objective of this study was to quantify φL and φC while comparison between the CO2 treatments was secondary.
Fig. 1. Representative response curves of leaf assimilation with irradiance at different plant positions at ambient CO2 (a) and elevated CO2 (b). Symbols represent measured photosynthesis of Leaf 1 (the bottom leaf (O), Leaf 2 (d), Leaf 3 (h), Leaf 4 (j), Leaf 5 (e), and Leaf 6 (the top leaf,r). Lines represent fitted A/I curves.
Quantum yield estimation was carried out with SAS NLIN procedure. Difference in quantum yield among canopy positions was tested using ANOVA procedure (SAS Institute, Cary, North Carolina USA).
3. Results
3.1. Leaf-level A/I curves and quantum yields
Leaf photosynthesis increased with light for three plants in different positions at both ambient and ele-vated CO2(Fig. 1). Younger leaves at the top of the canopy had higher photosynthetic rates than older ones in the bottom of canopy. The observed maxi-mum leaf CO2 flux changed from approximately 13 to 36mmol m−2s−1 at ambient CO
2 and from 15 to 42mmol m−2s−1 at elevated CO2. Elevated CO2 slightly increased the leaf photosynthesis. All A/I curves were well fitted by the hyperbolic function. The determinant coefficients (R2) were above 0.85 for all of the 35 data sets. Estimated leaf quantum
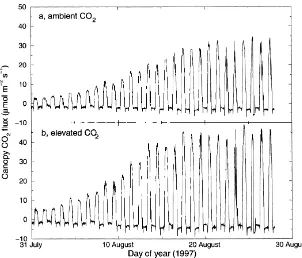
Fig. 3. Measured CO2 fluxes from 31 July to 27 August, 1997 at ambient CO2 (a) and elevated CO2 (b). Partially cloudy conditions prevailed on 9, 19, 16 and 24 August, 1997. Two EcoCELLs were completely covered with black sheets from 1200 to 1600, 26 August to measure daytime respiration.
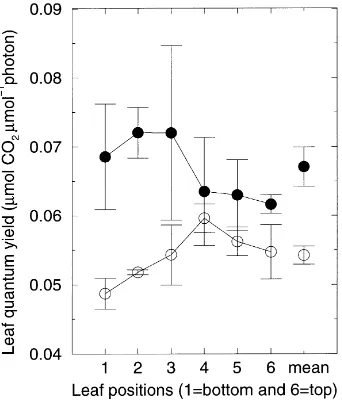
yields (φL) varied little with light levels at differ-ent plant positions (Fig. 2) ranging from 0.0487 to 0.0596mmol CO2mmol−1photon with an average of 0.0542mmol CO2mmol−1photon at ambient CO2. At elevated CO2, the values ofφL changed from 0.0616 to 0.0720mmol CO2 mmol−1photon with an average of 0.0671mmol CO2 mmol−1 photon. TheφL values of middle leaves (Leaf 4 at ambient CO2and Leaf 3 at elevated CO2) were slightly higher than those of lower and upper leaves. Analysis of variance (ANOVA), however, did not show significant difference in φL between different leaf positions at either ambient (p=0.21) or elevated CO2 (p=0.88). Elevated CO2 resulted in an average of 24% higherφL than ambi-ent CO2. The difference in φL between the two CO2 treatments was significant (p=0.009) (Fig. 2).
3.2. Canopy carbon fluxes
Net canopy carbon fluxes increased during the ex-perimental period, from approximately 5mmol m−2s−1 on 31 July 1997 (25 days after planting) to 35 and
48mmol m−2s−1 at ambient and elevated CO2, re-spectively, in the late growing stage when the canopy was closed (Fig. 3). The fluxes increased exponen-tially up to 17 August, 1997 and then slowly increased at both CO2 treatments. At the early stage of canopy development, no substantial difference was observed between the two CO2 treatments. From 4 August, 1997 on, the canopy developed rapidly; and CO2flux at elevated CO2 averaged 53% higher than that at ambient CO2. Although this study lacks the statistical power to assert that the difference between the CO2 treatments at any given point of time was due to the treatment effect, the high accuracy of the continuous measurements with a time series of 29 days offered by the EcoCELL instruments strongly suggests the possibility that the CO2 treatments stimulated large differences in canopy carbon fluxes.
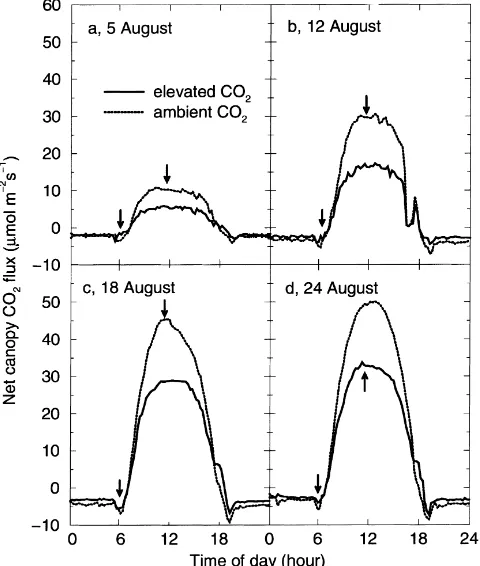
Fig. 4. Diurnal canopy CO2fluxes measured at ambient CO2(solid lines) and elevated CO2(dotted lines) on (a) 5 August; (b) 12 August; (c) 18 August and (d) 24 August, 1997. High respiratory carbon release either in the early morning or late afternoon resulted from step changes between night (13◦C) and day (28◦C) temperature. The sudden decrease in net CO2 fluxes after 1600 on 12 August was due to clouds. The morning data between the two arrows were used to construct canopy assimilation/incident irradiance (A/I) curves in Figs. 5 and 6.
resulted from ecosystem degassing associated with sudden switches in EcoCELL temperature, but the mechanism is not clear yet. During daytime, CO2 flux increased in the morning, reached the maximum at noon, and declined in the afternoon. The diurnal course purely resulted from the diurnal change in radiation because temperature and humidity in the EcoCELLs were controlled at constant levels. The daily maximum of net canopy CO2 fluxes changed from approximately 6mmol m−2s−1 on 5 August to 33mmol m−2s−1 on 24 August at ambient CO2 and from 11 to 50mmol m−2s−1 at elevated CO2 during the same period (Fig. 4).
3.3. Canopy-level A/I curves and quantum yields
We used canopy photosynthetic rates and incident photosynthetically active radiation (PAR) from sunrise
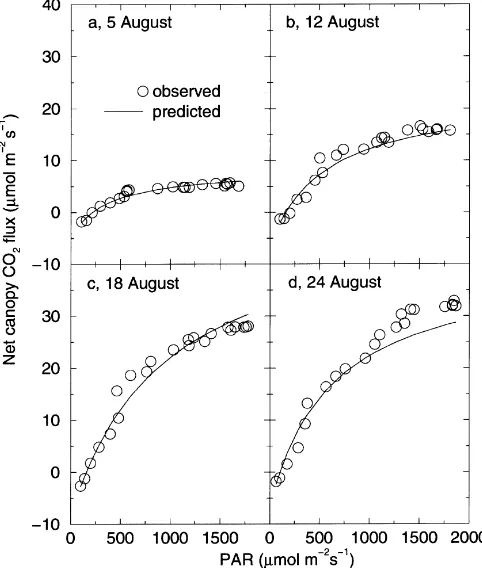
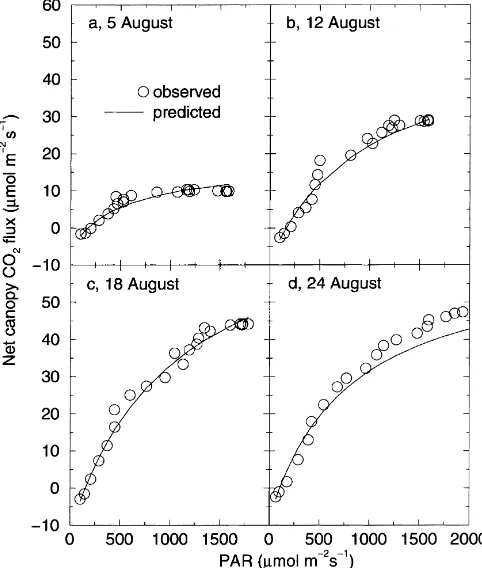
Fig. 5. Net canopy photosynthetic response to photosynthetically active radiation (PAR) on (a) 5 August; (b) 12 August; (c) 18 August and (d) 24 August, 1997 in ambient CO2. Open circles represent observed CO2 fluxes, and the lines are the fitted A/I curves using the rectangular hyperbolic equation.
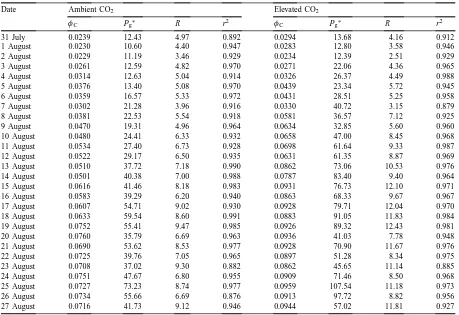
During the same period, the change inφCwas from 0.030 to 0.094mmol CO2mmol−1photon at elevated CO2. Values of φC were higher, on average of 28 points, by 31.5% at elevated CO2than that at ambient CO2. The maximum photosynthetic capacity (Pg∗) also increased with canopy development, ranging from 10.6 to 73.2mmol CO2m−2s−1at ambient CO2 and 12.4 to 107.5mmol CO2m−2s−1at elevated CO2 (Table 1). Estimated daytime plant and soil respira-tion increased from 3.5 to 9.5mmol CO2m−2s−1 at ambient CO2and from 3.2 to 11.8mmol CO2m−2s−1 at elevated CO2during the canopy development. The estimates using Q10equaling 2 and night-time ecosys-tem respiration were highly consistent with weekly daytime measurements of soil surface respiration plus estimated plant respiration (data not shown). Sensi-tivity analysis indicated that the values ofφCand Pg∗ are fairly sensitive to the estimates of daytime plant and soil respiration. In addition, we derived φC
using data either from the afternoon or full day. Results were similar to those derived from the morning data with slightly higher variability (data not shown).
3.4. Leaf area index and canopy quantum yield
Observed leaf area index (LAI) increased from 0.59 on 5 August to 4.48 on 28 August 1997 at ambient CO2 (Table 2). LAI was 0.66 on 5 August and 4.98 on 28 August, 1997 at elevated CO2. There was very little difference in the total number of leaves between the two CO2treatments (data not shown). This slight increase in canopy leaf area at elevated CO2was due to the increased expansion of individual leaves in the center of canopy.
Fig. 6. Net canopy photosynthetic response to photosynthetically active radiation (PAR) on (a) 5 August; (b) 12 August; (c) 18 August; and (d) 24 August, 1997 in elevated CO2. Symbols are the same as in Fig. 5.
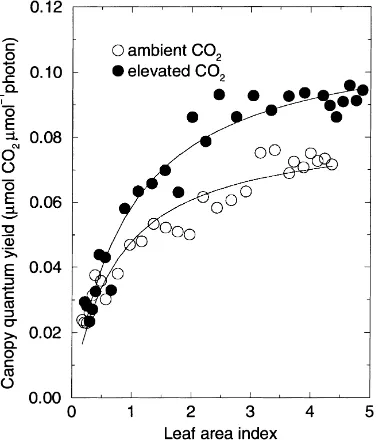
LAI and reached the values of leaf-level quantum yield (φL) at both ambient (φL=0.0542mmol CO2 mmol−1 photon) and elevated (fL=0.0671mmol CO2 mmol−1 photon) CO2 treatments when LAI was approximately 1.5. When LAI approached 2.5–3.0, φC gradually stabilized at 0.073mmol CO2 mmol−1 photon at ambient CO2 and 0.090mmol CO2 mmol−1 photon at elevated CO2. Using a hy-perbolic equation, φC=a·φ∗C·LAI/(φ∗C+a·LAI) where a is a coefficient indicating the initial slope of the hyperbolic function and φ∗C is the maxi-mal value of φC, we obtain a=0.1137±0.0111 (standard error) andφ∗C=0.0829±0.0030 at ambi-ent CO2. At elevated CO2 a=0.1224±0.0099 and φ∗C=0.1129±0.0036. Statistical analysis indicated a significant difference in theφ∗Cvalues between the two CO2 treatment (p<0.01) but no significant dif-ference in the a values between the CO2 treatments (p > 0.10).
3.5. Comparison among three models
Table 1
Values of parametersφC(canopy quantum yield,mmol CO2mmol−1photon), Pg∗(maximum canopy gross photosynthesis,mmol mol−2s−1), and R (ecosystem respiration during the daytime,mmol mol−2s−1) of the rectangular hyperbolic equation and r2 (determinant coefficient) derived by fitting the equation with individual data sets from 31 July to 27 August, 1997 at ambient and elevated CO2
Date Ambient CO2 Elevated CO2
φC Pg∗ R r2 φC Pg∗ R r2
31 July 0.0239 12.43 4.97 0.892 0.0294 13.68 4.16 0.912
1 August 0.0230 10.60 4.40 0.947 0.0283 12.80 3.58 0.946
2 August 0.0229 11.19 3.46 0.929 0.0234 12.39 2.51 0.929
3 August 0.0261 12.59 4.82 0.970 0.0271 22.06 4.36 0.965
4 August 0.0314 12.63 5.04 0.914 0.0326 26.37 4.49 0.988
5 August 0.0376 13.40 5.08 0.970 0.0439 23.34 5.72 0.945
6 August 0.0359 16.57 5.33 0.972 0.0431 28.51 5.25 0.958
7 August 0.0302 21.28 3.96 0.916 0.0330 40.72 3.15 0.879
8 August 0.0381 22.53 5.54 0.918 0.0581 36.57 7.12 0.925
9 August 0.0470 19.31 4.96 0.964 0.0634 32.85 5.60 0.960
10 August 0.0480 24.41 6.33 0.932 0.0658 47.00 8.45 0.968
11 August 0.0534 27.40 6.73 0.928 0.0698 61.64 9.33 0.987
12 August 0.0522 29.17 6.50 0.935 0.0631 61.35 8.87 0.969
13 August 0.0510 37.72 7.18 0.990 0.0862 73.06 10.53 0.976
14 August 0.0501 40.38 7.00 0.988 0.0787 83.40 9.40 0.964
15 August 0.0616 41.46 8.18 0.983 0.0931 76.73 12.10 0.971
16 August 0.0583 39.29 6.20 0.940 0.0863 68.33 9.67 0.967
17 August 0.0607 54.71 9.02 0.930 0.0928 79.71 12.04 0.970
18 August 0.0633 59.54 8.60 0.991 0.0883 91.05 11.83 0.984
19 August 0.0752 55.41 9.47 0.985 0.0926 89.32 12.43 0.981
20 August 0.0760 35.79 6.69 0.963 0.0936 41.03 7.78 0.948
21 August 0.0690 53.62 8.53 0.977 0.0928 70.90 11.67 0.976
22 August 0.0725 39.76 7.05 0.965 0.0897 51.28 8.34 0.975
23 August 0.0708 37.02 9.30 0.882 0.0862 45.65 11.14 0.885
24 August 0.0751 47.67 6.80 0.955 0.0909 71.46 8.50 0.968
25 August 0.0727 73.23 8.74 0.977 0.0959 107.54 11.18 0.973
26 August 0.0734 55.66 6.69 0.876 0.0913 97.72 8.82 0.956
27 August 0.0716 41.73 9.12 0.946 0.0944 57.02 11.81 0.927
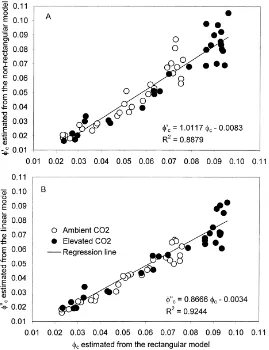
resulted in similar estimates of quantum yield with the non-rectangular hyperbolic model. The underestima-tion by the linear model is consistent with the nounderestima-tion thatφCis the highest as irradiance I approaches zero.
4. Discussion
This study indicates that canopy quantum yield (φC) ranged from 0.0229 to 0.0760mmol CO2mmol−1 pho-ton over LAI changes from 0.6 to 4.5 at ambient CO2 and from 0.0234 to 0.0959mmol CO2mmol−1photon over LAI changes from 0.7 to 5.0 at elevated CO2. This range ofφCis generally comparable to estimates pro-vided by Ruimy et al. (1995), who foundφCvarying from 0.009 to 0.465mmol CO2 mmol−1photon with an average of 0.044mmol CO2mmol−1photon for 122
data sets with 1362 data points. Out of the 122 data sets, 18 haveφCvalues larger than 0.100mmol CO2 mmol−1photon and 84 haveφCvalues less than 0.054, the value of leaf-level quantum yield (φL) at ambi-ent CO2 found in this study. In addition, our results showed thatφCincreased by 31.5% at elevated CO2 compared to that at ambient CO2. The CO2-induced increase inφCis similar to the stimulation reported by Monje and Bugbee (1998). Their study showed that CO2-induced increase in canopy quantum yield, which was calculated as daily average of gross photosynthe-sis divided by absorbed photosynthetic photon flux, ranges from 9 to 30%, depending on developmental stages of the canopy.
Table 2
Measured leaf area index (LAI) at ambient and elevated CO2 (mean±standard error). p is the probability that LAI is signifi-cantly different between the two CO2treatments. 28 August, 1997 was the last harvesting day
Date Ambient CO2 Elevated CO2 p
7 August 0.59±0.05 0.66±0.05 0.36 15 August 2.19±0.16 2.46±0.15 0.26 21 August 3.64±0.60 4.21±0.14 0.39 28 August 4.48±0.61 4.98±0.68 0.60
(CRUE) varies over the diurnal course within one day as well as over the course of canopy development. The variation in CRUE is similar to other experimen-tal and theoretical studies (Ruimy et al., 1995; Med-lyn, 1998; Monje and Bugbee, 1998) but may not be consistent with the early observation. The early ob-servation suggests that CRUE of a plant canopy under unstressed conditions is approximately constant with respect to changes in absorbed photosynthetically ac-tive radiation (Monteith, 1972, 1977). Monje and
Bug-Fig. 7. Canopy quantum yield (φC) from 31 July to 27 Au-gust 1997 (Table 1) correlated with leaf area index (LAI). Circles represent observed φC at ambient CO2 (O) and ele-vated CO2 (d) with nonlinear regression equationφC=0.0094 LAI/(0.0829+0.1137 LAI), r2=0.992 at ambient CO2; and
φC=0.01382 LAI/(0.1129+0.1224 LAI), r2=0.995 at elevated CO2, where r2 is the determinant coefficient. See text for more explanation.
bee (1998) have shown that CRUE varies with canopy development. The review by Ruimy et al. (1995) in-dicates that most canopy carbon fluxes observed in the field follow the curvilinear relationships with radi-ation availability. Medlyn (1998) used a mechanistic model to examine two of the three mechanisms that potentially transform the nonlinear relationship be-tween leaf photosynthesis and light into a linear rela-tionship between canopy carbon fluxes and radiation. Her study concluded that neither radiation distribu-tion within canopy nor temporal integradistribu-tion of CRUE could result in the linear relationship between canopy carbon fluxes and radiation. Indeed, Hui et al. (1999), calculated CRUE, which varied from 0.019mmol CO2 mmol−1photon in early morning or late afternoon to 0.011mmol CO2 mmol−1 photon at noon at ambient CO2. At elevated CO2, CRUE varied from 0.030mmol CO2mmol−1photon in the early morning or later af-ternoon to 0.018mmol CO2mmol−1 photon at noon. However, the apparent deviation of experimental data from the typical hyperbolic function toward a more linear form when LAI is high (Figs. 5d and 6d) war-rants more investigation into canopy gas exchange as related to radiation.
Fig. 8. Comparison of estimated canopy quantum yield among the rectangular hyperbolic, non-rectangular hyperbolic, and linear models. Circles represent quantum yield at ambient CO2 (O) and elevated CO2 (d). The rectangular hyperbolic model is the primary model used in this study.
It has generally been reported thatφL increases at elevated CO2(Chen and Sung, 1990; Teramura et al., 1990; Ziska et al., 1991; Eamus et al., 1993; Wang et al., 1995). However, a decrease ofφLin Siberian white birch and Japanese white birch was found by Koike et al. (1996) and no difference inφLwas reported by Delgado et al. (1994). Our results suggest that elevated CO2 increased φL of sunflower plants by 24%. The increase is slightly smaller than the theoretical value predicted by Farquhar and von Caemmerer (1982).
A comparison of leaf with canopy A/I curves (Fig. 1 versus Figs. 5 and 6) suggests different mechanisms in controlling leaf versus canopy photosynthetic re-sponses to light availability. Leaves with different
photosynthetic capacity respond similarly to an in-crease in light availability at the low level until photosynthesis reaches a light saturating point. The higher the leaf photosynthetic capacity is, the larger the light saturating point with similar initial slopes of A/I curves. Thus, leaf-level quantum yield (φL) is not correlated with photosynthetic capacity (Pg∗). Unlike the leaf A/I responses, we did not observe any apparent light saturating points for canopy photosyn-thetic responses to light. ObservedφCappears to be correlated with canopy Pg∗(Table 1).
CO2compared with that at ambient CO2(0.0671 ver-sus 0.0542mmol CO2mmol−1photon). Canopy quan-tum yield strongly varied with canopy development, varying from 0.0229 to 0.0959mmol CO2 mmol−1 photon over LAI changes from 0.5 to 5.0. CO2 en-richment resulted in a 31.5% increase in the canopy quantum yield. In addition, examination of relation-ship between canopy quantum yield and incident PAR suggested that canopy radiation use efficiency (CRUE) varied with light levels. Variability in CRUE demon-strated in this and other studies warrants further in-vestigation into the notion drawn from earlier studies that CRUE under non-stressed conditions is approxi-mately constant.
Acknowledgements
The authors thank D. Schorran, E. Sotoodeh, V. Yturiaga, and W. Liu for technical support and two anonymous reviewers for useful suggestions. This study would not be possible without the conception and construction of EcoCELLs led by Dr. J.T. Ball. Preparation of this paper was partially supported by the NSF/DOE/NASA/USDA/EPA/NOAA Interagency Program on Terrestrial Ecology and Global Change (TECO) by DOE under DE-FG03-98ER62676 to YL.
References
Amthor, J.S., 1994. Scaling CO2-photosynthesis relationships from the leaf to the canopy. Photosyn. Res. 39, 353–359.
Baker, N.R., McKiernan, M., 1988. Modifications to the photosynthetic apparatus of higher plants in response to changes in the light environment. Biol. J. of the Linnean Society 34, 193–203.
Baldocchi, D., 1993. Scaling water vapor and carbon dioxide exchange from leaves to a canopy: Rules and tools. In: Ehleringer J.R., Field, C.B. (Eds.), Scaling Physiological Processes: Leaf to Global. Academic Press, London, pp 77–114. Campbell, G.S., Norman, J.M., 1998. An Introduction to
Environmental Biophysics. 2nd edi. Springer, New York. Charles-Edwards, D.A., 1982. Physiological Determinants of Crop
Growth. Academic Press, Sydney.
Chen, J.J., Sung, J.M., 1990. Crop physiology and metabolism. Gas exchange rate and yield responses of virginia-type peanut to carbon dioxide enrichment. Crop Sci. 30, 1085–1089. Cheng, W., Sims, D.A., Luo, Y., Johnson, D.W., Ball, J.T.,
Coleman, J., 1999. Demonstration of Complete Carbon Budgeting in Plant-Soil Mesocosms under Elevated CO2: Locally Missing Carbon? Global Change Biology (in press).
Delgado, E., Mitchell, R.A.C., Parry, M.A.J., Driscoll, S.P., Mitchell, V.J., Lawlor, D.W., 1994. Interacting effects of CO2 concentration, temperature and nitrogen supply on the photosynthesis and composition of winter wheat leaves. Plant, Cell and Environ. 17, 1205–1213.
de Pury, D.G.G., Farquhar, G.D., 1997. Simple scaling of photosynthesis from leaves to canopies without the errors of big-leaf models. Plant, Cell and Environ. 20, 537–557. Eamus, D., Berryman, C.A., Duff, G.A., 1993. Assimilation,
stomatal conductance, specific leaf area and chlorophyll responses to elevated CO2 of Maranthes corymbosa, a tropical monsoon rain forest species. Austr. J. Plant Physiol. 20, 741– 755.
Ehleringer, J.R., 1978. Implications of quantum yield differences on the distributions of C3and C4grasses. Oecologia 31, 255– 267.
Ehleringer, J.R., Björkman, O., 1977. Quantum yield for CO2 uptake in C3and C4 plants. Plant Physiol. 59, 86–90. Ehleringer, J.R., Cerling, T.E., Helliker, B.R., 1997. C4
photosynthesis, atmospheric CO2, and climate. Oecologia 112, 285–299.
Ehleringer, J.R., Pearcy, R.W., 1983. Variation in quantum yield for CO2 uptake among C3 and C4 plants. Plant Physiol. 73, 555–559.
Emerson, R., 1958. The quantum yield of photosynthesis. Annu. Rev. Plant Physiol. 9, 1–4.
Farquhar, G.D., von Caemmerer, S., 1982. Modelling of photosynthetic response to environmental conditions. In: Lange, O.L., Nobel, P.S., Osmond, C.B., Ziegler, H. (Eds.), Physiological Plant Ecology II. (Encyclopedia of Plant Physiology, NS, vol. 12B). Springer, Berlin New York, pp 549–587.
Farquhar, G.D., von Caemmerer, S., Berry, J.A., 1980. A biochemical model of photosynthetic CO2assimilation in leaves of C3 species. Planta 149, 78–90.
Field, C.B., Ball, J.T., Berry, J.A., 1991. Photosynthesis: Principles and field techniques. In: Pearcy, R.W., Ehleringer, J.R., Mooney, H.A., Rundel, P.W. (Eds.), Plant Physiological Ecology: Field Methods and Instrumentation. Chapman & Hall London, pp 209–253.
Griffin, K.L., Ross, P.D., Sims, D.A., Luo, Y., Seemann, J.R., Fox, C.A., Ball, J.T., 1996. EcoCELLs: Tools for mesocosm scale measurements of gas exchange. Plant Cell and Environ. 19, 1210–1221.
Harley, P.C., Thomas, R.B., Reynolds, J.F., Strain, B.R., 1992. Modelling photosynthesis of cotton grown in elevated CO2. Plant, Cell and Environ. 15, 271–282.
Hirose, T., Ackerly, D.D., Traw, M.B., Ramseier, D., Bazzaz, F.A., 1997. CO2 elevation, canopy photosynthesis, and optimal leaf area index. Ecology 78, 2339–2350.
Hui, D., Luo, Y., Cheng, W., Coleman, J.S., Johnson, D.W. Sims, D.A., 1999. Canopy radiation and water use efficiencies of as affected by elevated [CO2]. Global Change Biology (submitted). Hurlbert, S.H., 1984. Pseudoreplication and the design of
ecological field experiments. Ecol. Monogr. 54, 187–211. Kaharabata, S.K., Schuepp, P.H., Ogunjemiyo, S., Shen, S.,
Footprint consideration in BOREAS. J. Geophys. Res. 102, 29113–29124.
Kirschbaum, M.U.F., Farquhar, G.D., 1987. Investigation of the CO2dependence of quantum yield and respiration in Eucalyptus
pauciflora. Plant Physiol. 83, 1032–1036.
Koike, T., Lei, T.T., Maximov, T.C., Tabuchi, R., Takahashi, K., Ivanov, B.I., 1996. Comparison of the photosynthetic capacity of Siberian and Japanese birch seedlings growth in elevated CO2and temperature. Tree Physiol. 16, 381–385.
Ku, S.B., Edwards, G.E., 1978. Oxygen inhibition of photosynthesis. III. Temperature dependence of quantum yield and its relation to O2/CO2 solubility ratio. Planta 140, 1–6. Kubiske, M.E., Pregitzer, K.S., 1996. Effects of elevated CO2 and
light availability on the photosynthetic light response of trees of contrasting shade tolerance.. Tree Physiol. 16, 351–358. Lai, A., Edwards, G.E., 1995. Maximum quantum yields of O2
evolution in C4plants under high CO2.. Plant Cell Physiol. 36, 1311–1317.
Lawlor, D.W., 1995. Photosynthesis, productivity and environment. J. Exp. Bot. 46, 1449–1461.
Lee, X.H., 1997. On micrometeorological observation of surface-air exchange over tall vegetation. Agric. For. Meteorol. 91, 39–49.
Long, S.P., Drake, B.G., 1991. Effect of the long-term elevation of CO2 concentration in the field on the quantum yield of photosynthesis of the C3 sedge, Scirpus olneyi. Plant Physiol. 96, 221–226.
McNaughton, K.G., 1994. Effective stomatal and boundary-layer resistances of heterogeneous surfaces. Plant, Cell and Environ. 17, 1061–1068.
Medlyn, B.E., 1998. Physiological basis of the light use efficiency model. Tree Physiol. 18, 167–176.
Monje, O., Bugbee, B., 1998. Adaption to high CO2concentration in an optimal environment: Radiation capture, canopy quantum yield and carbon use efficiency. Plant, Cell and Environ. 21, 315–324.
Nilsen, E., Sharifi, M.R., 1994. Seasonal acclimation of stem photosynthesis in woody legume species from the Mojave and Sonoran Deserts of California. Plant Physiol. 105, 1385–1391. Norman, J.M., 1993. Scaling processes between leaf and canopy levels. In: Ehleringer J.R., Field, C.B. (Eds.), Scaling Physiological Processes: Leaf to Global. Academic Press, London, pp. 41–76.
Raupach, M.R., Finnigan, J.J., 1988. Single-layer models of evaporation from plant canopies are incorrect but useful, whereas multilayer models are correct but useless: Discuss. Austr. J. Plant Physiol. 15, 705–716.
Reich, P.B., Ellsworth, D.S., Kloeppel, B.D., Fownes, J.H., Gower, S.T., 1990. Vertical variation in canopy structure and CO2 exchange of oak−maple forests: influence of ozone, nitrogen, and other factors on simulated canopy carbon gain. Tree Physiol. 7, 329–345.
Ruimy, A., Jarvis, P.G., Baldocchi, D.D., Saugier, B., 1995. CO2 fluxes over plant canopies and solar radiation: A review. Adv. Ecol. Res. 26, 1–68.
Sims, D.A., Cheng, W., Luo, Y., Seemann, J.R., 1999. Photosynthetic acclimation to elevated CO2 in a sunflower canopy. J. Exp. Bot. 50, 645–653.
Stirling, C.M., Nie, G.Y., Aguilera, C., Nugawela, A., Long, S.P., Baker, N.R., 1991. Photosynthetic productivity of an immature maize crop: changes in quantum yield of CO2 assimilation conversion efficiency and thylakoid proteins. Plant, Cell and Environ. 14, 947–954.
Teramura, A.H., Sullivan, J.H., Ziska, L.H., 1990. Interaction of elevated ultraviolet-B radiation and CO2 on productivity and photosynthetic charateristics in wheat, rice and soybean. Plant Physiol. 94, 470–475.
Wang, K., Kellomaki, S., Laitinen, K., 1995. Effects of needle age long-term temperature and CO2 treatments on the photosynthesis of Scots pine. Tree Physiol. 15, 211–218. Wang, Y.P., Polglase, P.J., 1995. Carbon balance in the tundra,
boreal forest and humid tropical forest during climate change: Scaling up from leaf physiology and soil carbon dynamics. Plant, Cell and Environ. 18, 1226–1244.
Waring, R.H., Law, B.E., Goulden, M.L., Bassow, S.L., McCreight, R.W., Wofsy, S.C., Bazzaz, F.A., 1995. Scaling gross ecosystem production at Harvard Forest with remote sensing: A comparison of estimates from a constrained quantum use efficiency model and eddy correlation. Plant, Cell and Environ. 18, 1201–1213.
Webber, A.N., Baker, N.R., Platt-Aloia, K., Thomson, W.W., 1984. Appearance of a state 1-state 2 transition during chloroplast development in the wheat leaf: Energetic and structural considerations. Physiol. Plant 60, 171–179.
Whitehead, D., Hinckley, T.M., 1991. Models of water flux through forest stands: Critical leaf and stand parameters. Tree Physiol. 9, 35–57.
Wofsy, S.C., Goulden, M.L., Munger, J.W., Fan, S.M., Bakwin, P.S., Daube, B.C., Bassow, S.L., Bazzaz, F.A., 1993. Exchange of CO2in a mid-latitude forest. Science 260, 1314–1317. Ziska, L.H., Hongan, K.P., Smith, A.P., Drake, B.G., 1991. Growth
