Apolipoprotein E4 phenotype increases non-fasting serum
triglyceride concentration in infants — the STRIP study
Anne Tammi
a,*, Tapani Ro¨nnemaa
b, Jorma Viikari
b, Eero Jokinen
c,
Helena Lapinleimu
d, Christian Ehnholm
e, Olli Simell
daCardiorespiratory Research Unit,Uni6ersity of Turku,Kiinamyllynkatu 10,FIN-20520 Turku, Finland bDepartment of Medicine,Uni6ersity of Turku,Kiinamyllynkatu4–8,FIN-20520 Turku, Finland cHospital for Children and Adolescents,Uni6ersity of Helsinki,Stenba¨ckinkatu II,FIN-00290Helsinki, Finland
dDepartment of Pediatrics,Uni6ersity of Turku,Kiinamyllynkatu4–8,FIN-20520 Turku, Finland eNational Public Health Institute,P.B. 450,FIN-00101 Helsinki, Finland
Received 25 January 1999; received in revised form 28 September 1999; accepted 15 October 1999
Abstract
As genetically determined apolipoprotein E (apo E) phenotypes influence serum cholesterol concentration, we analysed whether serum triglyceride values are also affected by the apo E phenotypes in infants. Non-fasting serum triglyceride values were measured in 7- and 13-month-old participants in the STRIP project, a randomised, prospective trial aimed at reducing children’s exposure to known atherosclerosis risk factors (n=1062). The mean9S.D. non-fasting serum triglyceride concentrations in 7-month-old infants with apo E4/4 (n=36), E3/4 (n=209), E3/3 (n=412), and E2/3 (n=66) were 2.0591.24, 1.8190.90, 1.6390.90, and 1.7190.83 mmol/l, respectively. Triglyceride concentrations were higher in infants with apo E4/4 or 3/4 than in those with apo E3/3 (P-value for difference 0.01 and 0.009, respectively). The apo E phenotype similarly influenced non-fasting serum triglyceride concentrations at the age of 13 months. The differences in serum triglyceride values in apo E4+infants (apo E3/4 and 4/4 infants combined) and apo E4−infants (apo E2/3 and 3/3 infants combined) occurred independently of the relative weight of the infant, milk type used at 7 months of age (breast milk or formula), and time elapsed from the previous meal. To conclude, apo E phenotypes regulate non-fasting serum triglyceride values in healthy infants. Apo E3/4 and apo E4/4 predispose infants to higher values than apo E3/3 phenotype, suggesting that theo4 allele may increase atherosclerosis risk also via it’s effect on postprandial triglyceride metabolism. © 2000 Elsevier Science Ireland Ltd. All rights reserved.
Keywords:Triglycerides; Apo E; Infants; Breast milk; Cholesterol
www.elsevier.com/locate/atherosclerosis
1. Introduction
Apolipoprotein E (apo E) is a constituent of triglyce-ride rich lipoproteins (i.e. chylomicrons, very low den-sity lipoproteins and their remnants) and some subclasses of high density lipoproteins (HDL) [1]. The gene for human apo E is polymorphic; the three com-mon alleles o2, o3, and o4 encode the isoproteins E2, E3, and E4, respectively. The homozygous phenotypes E2/2, E3/3, and E4/4 and the heterozygous phenotypes E2/3, E2/4, and E3/4 thus predominate [2].
Apo E acts as a ligand for low density lipoprotein (LDL) and remnant receptors, thus playing an impor-tant role in the metabolism of cholesterol and triglyce-ride rich lipoproteins [1]. Apo E also participates in catabolism of chylomicrons together with lipoprotein lipase (LPL), independently of the LDL receptor [3] and is involved in the conversion of intermediate den-sity lipoprotein to LDL [4].
The association between the apo E phenotypes and serum total and LDL cholesterol concentrations is well established. On average, subjects with apo E2 have lower and those with apo E4 higher serum total and LDL cholesterol concentration than those with apo E3 [5 – 8]. The association between the apo E phenotypes and serum triglyceride values has remained less clear.
* Corresponding author. Tel.:+358-2-333-7306; fax:+ 358-2-233-1126.
E-mail address:[email protected] (A. Tammi).
The prevalence of o2 allele is increased in individuals with hypertriglyceridemia [9,10] and clearance of triglyceride rich particles is prolonged also in nor-molipidemic individuals with one or two o2 alleles [11,12]. E2/2 phenotype is an obligatory, but not the only, prerequisite for the development of human type III hyperlipidemia, characterised by accumulation of remnants of triglyceride rich lipoprotein particles in plasma [13]. However, this rare condition alone fails to explain the o2-hypertriglyceridemia association. A few studies suggest that o4 carriers also have higher serum triglyceride values than o3 homozygotes [14 – 18], and the meta-analysis by Dallongeville and co-workers shows that subjects with apo E2 phenotype and apo E4 heterozygotes have higher serum triglyce-ride concentrations than E3 homozygotes [19].
To analyse the effects of the apo E phenotypes on serum triglyceride values in breast-fed and recently weaned infants, serum triglyceride values and apo E phenotypes were determined in a large population of 7- and 13-month-old infants in Finland, a country with an exceptionally high prevalence of the o4 allele.
2. Methods
2.1. Subjects
This study comprises a part of the participants of the STRIP project (Special Turku Coronary Risk Factor Intervention Project), which is a randomised, prospective trial aimed at decreasing exposure of chil-dren to known environmental atherosclerosis risk fac-tors. The ongoing project was launched in Turku, Finland, in 1990. Details of the study design have been published [20]. In brief, 1062 infants were ran-domised to intervention (n=540) and control (n=
522) groups at the age of 7 months. This study comprises those infants from whom blood was suc-cessfully drawn at the ages of 7 months (n=745) and 13 months (n=859). Blood samples from 671 infants were available at both ages.
2.2. Counselling
The intervention families visited the counselling team (a paediatrician and a dietician) at infant’s ages of 7, 8, 10 and 13 months. Infant’s fat intake was not restricted, but saturated fatty acids were suggested to be replaced by polyunsaturated and monounsaturated fatty acids to approach a ratio of polyunsaturated to monounsaturated to saturated fatty acids of 1:1:1. In-fant foods low in saturated fat and cholesterol were thus recommended. A daily cholesterol intake of less than 200 mg was also proposed. Solid foods were introduced to all infants at 3 – 6 months of age; all
infants received breast milk or formula to the age of 1 year. The intervention infants then had skim milk as their primary milk source. The intervention parents were advised to add two to three teaspoonfuls (10 – 15 g) vegetable oil or soft margarine into the infant’s daily diet to confirm an adequate supply of energy and fat (30 – 35% of total energy).
The control families visited the same counselling team at the infant’s ages of 7 and 13 months. They received no individualised dietary counselling about the amount or quality of fat in the child’s diet. Solid foods were introduced to control infants at 3 – 6 months of age. The control infants consumed breast milk or formula also until the age of 1 year but changed then to milk with at least 1.9% fat, as was counselled at the well baby clinics in Finland at that time.
2.3. Ethics
The STRIP project has been approved by the Joint Commission on Ethics of the Turku University and the Turku University Central Hospital.
2.4. Biochemical determinations and weight measurement
Non-fasting blood samples were drawn between 08:00 and 17:00 h under cutaneous anaesthesia (Emla, Astra, So¨derta¨lje, Sweden) from an antecubital vein. The mean time interval between the infant’s previous meal and sampling was 2.2990.98 h at 7 months of age and 2.1990.90 h at 13 months of age; the time interval was similar among carriers of different apo E phenotypes. Serum was separated by low-speed cen-trifugation (3400×g, for 12 min) after clotting at room temperature and was stored for B1 month at
−25°C.
Serum triglyceride concentration was determined with a fully enzymatic colorimetric GPO-PAP method (Boehringer, Mannheim, Germany) using a Kone CD analyser. Serum HDL cholesterol concentration was measured using a fully enzymatic method after precip-itation of LDL and VLDL with dextran sulphate 500 000 as described [21]. Apo E phenotypes were determined using isoelectric focusing and im-munoblotting of delipidated serum [7]. All analyses were performed in the laboratory of the Research and Development Unit of Social Insurance Institution in Turku.
The weight of the infants was measured to the nearest 0.01 kg with a baby scale (Seca® 725,
2.5. Statistical analysis
The results are expressed as means9S.D. Serum triglyceride concentrations were log-transformed for statistical analyses because of skewness of the data. Differences between two groups were tested with a two-samplet-test. One- or two-way analysis of variance was used in analyses of overall differences between the apo E phenotypes. In some analyses, subjects with apo E3/4 and 4/4 phenotypes were analysed together as the apo E4+ group. Similarly, in some analyses apo E2/3
and apo E3/3 children were combined to form the apo E4−
group. Pearson’s correlation coefficient (r) was calculated for serum triglyceride values at the two age points and for correlation between concentrations of serum HDL cholesterol and triglycerides. P-values B
0.05 were considered significant. Statistical analyses were performed using SAS release 6.12 program pack-age (SAS Institute, Cary, NC).
3. Results
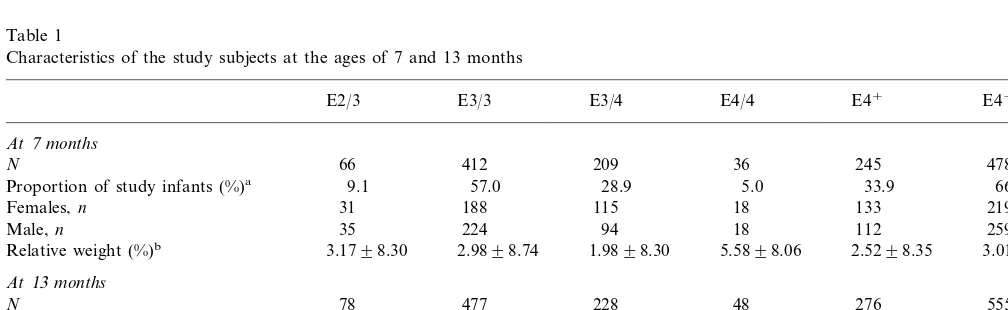
The apo E allele frequencies in the groups of infants at the age of 7 and 13 months were identical (o2, 0.06;
o3, 0.74; and o4, 0.20) (Table 1). Only four and six infants had apo E2/2 phenotype and only 18 and 22 infants had apo E2/4 phenotype at the ages of 7 and 13 months, respectively. The non-fasting serum triglyceride concentration (mean9S.D.) in the apo E2/2 infants was 2.7591.96 and 1.4290.60 mmol/l at the ages of 7 and 13 months, respectively. Similarly, the mean con-centration in the apo E2/4 infants was 1.8790.63 and 1.6990.74 mmol/l, respectively. Because of the small number of infants with these apo E phenotypes, they were excluded from further analyses.
The mean time interval between infant’s previous meal and drawing of the blood sample did not correlate with measured serum triglyceride concentrations at the ages of 7 and 13 months (r= −0.002, P=0.96 and
r= −0.01, P=0.80, respectively). Further, the mean time interval and serum triglyceride values showed no correlation in the apo E4+ infants (r=0.02, P=0.81
for infants aged 7 months andr= −0.05,P=0.43 for infants aged 13 months) and in the apo E4− infants
(rB0.01, P=0.94 for infants aged 7 months and r= −0.06,P=0.17 for infants aged 13 months). Also, no correlation was observed when infants with the four main apo E phenotypes were studied separately at these age points (data not shown).
The mean non-fasting serum triglyceride concentra-tion was higher at the age of 7 than at 13 months (1.7290.92 vs 1.4790.74 mmol/l). In those 671 infants whose samples were successfully measured at both age points, serum triglyceride concentration decreased by 0.2791.05 mmol/l (P=0.0001) during the 6-month follow-up. The serum triglyceride concentrations at 7 and 13 months of age correlated (r=0.21, P=0.0001) in these 671 children despite the fact that the time interval between the previous meal and drawing the blood sample varied randomly at both ages.
Girls had higher mean non-fasting serum triglyceride concentration than boys at the age of 7 months (1.799
0.95 vs 1.6590.89 mmol/l, P=0.02) as well as at 13 months (1.5590.78 vs 1.3990.69 mmol/l,P=0.0002). As serum triglyceride values and apo E phenotypes associated similarly in the girls and boys, the genders were combined in further analyses.
The apo E4+ infants had higher non-fasting serum
triglyceride concentration than the apo E4− infants
both at 7 and 13 months of age. Stratification of serum triglyceride values according to apo E phenotypes
Table 1
Characteristics of the study subjects at the ages of 7 and 13 months
E4−
Proportion of study infants (%)a 66.1
18 115
188
Females,n 31 133 219
35 224 94 18 112
Proportion of study infants (%)a 9.4 57.4
152 258
aInfants with apo E2/2 or apo E2/4 phenotype are excluded.
bValues are means9S.D. Relative weight is expressed as deviation in percentage from the mean weight of healthy Finnish children of same
Table 2
Non-fasting serum triglyceride concentration (mmol/l) in 7- and 13-month-old infants stratified according to apo E phenotypea
E3/3 E3/4
E2/3 E4/4 E4+ E4−
At7months
1.6390.90
Mean9S.D. 1.7190.83 1.8190.90 2.0591.24 1.8490.96 1.6490.89 1.40 (0.40–6.77) 1.63 (0.50–6.30) 1.70 (0.60–7.10)
1.60 (0.32–4.60) 1.70 (0.50–7.10)
Median (range) 1.40 (0.32–6.77)
0.009b 0.01b
P-value 0.42b 0.002c
At13months
Mean9S.D. 1.3590.72 1.4390.76 1.5290.67 1.6990.74 1.5590.69 1.4290.76 1.30 (0.30–7.00) 1.40 (0.40–4.40) 1.70 (0.60–4.20)
1.10 (0.40–3.90) 1.40 (0.40–4.40)
Median (range) 1.20 (0.30–7.00)
0.02b 0.008b
P-value 0.39b 0.001c
aE4+group is apo E3/4 and 4/4 infants combined, E4−group is E2/3 and E3/3 infants combined.
bP-values refer to comparisons between the values of the apo E3/3 infants and infants with other phenotypes (one-way analysis of variance). cP-values refer to comparisons between the values of the E4+infants and E4−infants (two-samplet-test).
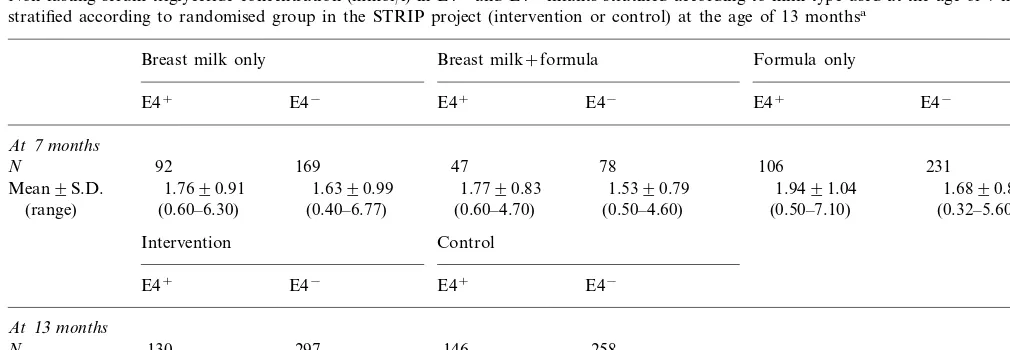
Table 3
Non-fasting serum triglyceride concentration (mmol/l) in E4+and E4−infants stratified according to milk type used at the age of 7 months and
stratified according to randomised group in the STRIP project (intervention or control) at the age of 13 monthsa
Breast milk+formula
Breast milk only Formula only
E4− E4+ E4− E4+ E4−
E4+
At7months
N 92 169 47 78 106 231
1.7690.91 1.6390.99 1.9491.04
Mean9S.D. 1.7790.83 1.5390.79 1.6890.84
(0.40–6.77) (0.60–4.70) (0.50–4.60)
(0.60–6.30) (0.50–7.10) (0.32–5.60)
(range)
Intervention Control
E4− E4+ E4−
E4+
At13months
297 146 258
130 N
1.5890.74 1.4490.77
Mean9S.D. 1.4090.75 1.5290.64
(0.40–7.00) (range) (0.40–4.40) (0.30–6.70) (0.50–4.20)
aAt the age of 7 months, apo E4 phenotype associated with serum triglyceride values (P=0.01), whereas milk type showed no such association
with triglyceride values (P=0.34). For the interaction term (milk×phenotype),P=0.95 (two-way analysis of variance). At the age of 13 months, apo E4 phenotype associated with serum triglyceride values (P=0.005), whereas the group (intervention or control) showed no such association with serum triglyceride values (P=0.29). For the interaction term (intervention×phenotype),P=0.40 (two-way analysis of variance).
showed that the infants with apo E4/4 had the highest serum triglyceride concentration, and the triglyceride values declined in the order E4/4\E3/4\E3/3 (Table 2).
At 7 months of age, multivariate analysis with serum triglyceride concentration as the dependent variable and apo E4 phenotype (E4+ or E4−) and milk type
(breast milk or formula) as the independent variable showed that the apo E4 type independently associated with non-fasting serum triglyceride concentration, whereas milk type showed no such association (Table 3). Consequently, data on infants fed solely breast milk, breast milk and formula, or solely formula were combined for further analyses.
Non-fasting serum triglyceride values in infants aged 13 months showed no association with the group to which they were randomised (intervention group or control group) in a covariance analysis with
triglyce-ride values as a dependent variable and treatment group and apo E4 type as covariates. Meanwhile, the apo E4 phenotype associated with serum triglyceride values (Table 3). Consequently, data on the interven-tion and the control infants were combined for further analyses.
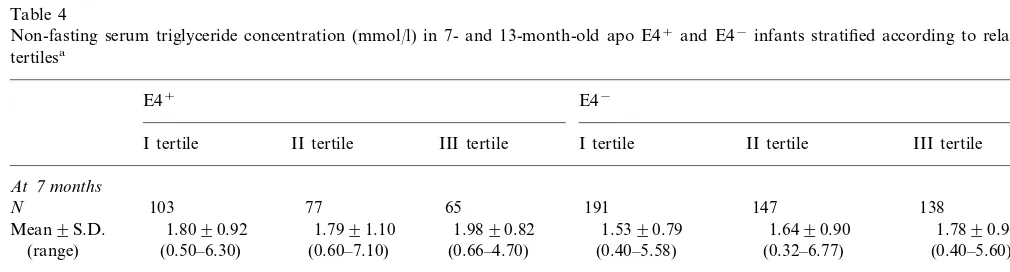
The relative weights of infants with different apo E phenotypes were closely similar (Table 1). When the infants were divided according to relative weight ter-tiles, the E4− infants in the heaviest tertile had the
The o4 allele also had an effect on serum HDL cholesterol concentration in these infants. Serum HDL cholesterol concentration was lower in the infants with
o4 allele than in those without the allele at 7 months of age (0.8890.19 vs 0.9290.19 mmol/l, respectively;
P=0.03) and again at 13 months of age (0.8690.18 vs 0.9090.19 mmol/l; P=0.003). Concentrations of serum HDL cholesterol and triglycerides showed a moderate correlation in the apo E4+ infants (r= −
0.34, P=0.0001) and in the apo E4− infants (r= −
0.37, P=0.001) at the age of 7 months. Similar correlations were found at the age of 13 months (r= −
0.35,P=0.0001 for the apo E4 infants andr= −0.31,
P=0.0001 for the apo E4−
infants).
We have earlier shown that in the whole STRIP study material, the mean concentration of serum total cholesterol is higher in infants with apo E4+phenotype
than in infants with apo E4− phenotype [8]. Similarly,
in the present substudy in the infants from whom serum triglyceride value was available, the concentration of serum total cholesterol was higher in the apo E4+
infants than in the apo E4− infants (4.1290.82 vs
3.9090.73 mmol/l,P=0.0001) at 7 months of age and at 13 months of age (4.2690.73 vs 4.0190.73 mmol/l,
P=0.0001).
4. Discussion
The main finding of this study is that non-fasting serum triglyceride concentration is higher in the infants with theo4 allele than in those without the allele at the ages of 7 and 13 months. Furthermore, the infants homozygous for o4 had higher mean concentrations than the infants heterozygous for o4 and the infants
without theo4 allele showed the lowest concentrations. In accordance with our data, a recent study in adults suggests that postprandial increases in serum triglyce-ride values are higher in subjects carrying the o4 allele than in subjects with otheroalleles [23]. Also, clearance of intestinal and hepatogenous triglyceride rich lipo-protein remnants is impaired in normolipidemic young men with the apo E4/3 phenotype [24]. A few other studies suggest that subjects carrying apo E4 may have increased fasting serum triglyceride concentration [14 – 18]. In the meta-analysis by Dallongeville and co-work-ers, 45 population samples from 17 countries suggest that plasma triglyceride values are increased in children and adults carrying the o2 allele or the o3/4 combina-tion [19]. In that meta-analysis, serum triglyceride val-ues in apo E4 homozygotes were similar to those in apo E3 homozygotes. However, this finding may have been an artefact caused by the small number of subjects carrying the E4/4 phenotype (1.6% of those studied). Meanwhile, the multinational EARS study suggests, that the o2 and o4 alleles equally increase the plasma triglyceride concentration [14].
Even though a few population studies support an association of the o2 allele with hypertriglyceridemia, our study shows no such association. For full expres-sion of hypertriglyceridemia in subjects with the o2 allele, additional factors known to promote hyper-triglyceridemia are probably required, and these factors (obesity, impaired glucose metabolism, or abuse of alcohol) were not features of our study infants. Another explanation for the absence of the o 2-hypertriglyce-ridemia association in our study might again be that only 9% of the infants analysed carried the o2 allele as the infants with apo E2/2 and E2/4 phenotypes were excluded from statistical analyses.
Table 4
Non-fasting serum triglyceride concentration (mmol/l) in 7- and 13-month-old apo E4+and E4−infants stratified according to relative weight
tertilesa
E4+ E4−
I tertile II tertile III tertile I tertile II tertile III tertile
At7months
103 77 65
N 191 147 138
1.6490.90
1.8090.92 1.5390.79
Mean9S.D. 1.7991.10 1.9890.82 1.7890.96
(0.50–6.30) (0.40–5.58) (0.32–6.77)
(range) (0.60–7.10) (0.66–4.70) (0.40–5.60)
At13months
192 170 178
115
N 91 71
1.5190.86 Mean9S.D. 1.4790.69 1.4990.65 1.6790.73 1.3590.67 1.3990.71
(0.40–6.70)
(range) (0.40–0.69) (0.50–3.90) (0.50–4.20) (0.40–4.64) (0.30–7.00)
aInfants in the first (I) relative weight tertile were the lightest and those in the third (III) tertile, the heaviest. For difference in serum triglyceride
values in relative weight tertiles in 7-month-old infants,P=0.13 (E4+infants) andP=0.04 (E4−infants). For difference in serum triglyceride
values in relative weight tertiles in 13-month-old infants,P=0.22 (E4+infants) and 0.48 (E4−infants) (two-way analysis of variance). The apo
The slower clearance of chylomicron and VLDL remnants by theo2 carriers than by o3/3 homozygotes might well explain their high serum triglyceride concen-tration. But what could be the mechanism for our finding that theo4 allele strongly increases non-fasting serum triglyceride values in infants? As apo E and LPL co-ordinately enhance binding and uptake of chylomi-crons by human hepatocytes via LDL receptor related protein in vitro [3], the possibility exists that the apo E4 molecule might function poorly in this reaction and thus disturb co-ordinate chylomicron catabolism. Dif-ferent polymorphic forms of apo E may indeed be able to modulate postheparin LPL activity, and, conse-quently, plasma lipoprotein profile [25]. In support of this hypothesis, apo E4 positive men failed to show inverse correlation between plasma triglyceride concen-tration and postheparin LPL activity and positive cor-relation between plasma HDL cholesterol concentration and LPL activity while those parameters correlated well in apo E2 positive men. Furthermore, in the Stanislas cohort of 1101 healthy subjects, apo E and LPL simultaneously modulated fasting serum triglyce-ride values, o4 allele being associated with high values [18].
Serum triglyceride and serum HDL cholesterol con-centrations show a strong inverse correlation in adults and children [26,27]. In this study, the apo E4+
infants, who had the highest serum triglyceride concentrations also had the lowest serum HDL cholesterol concentra-tions, and serum concentrations of HDL cholesterol and triglycerides showed a moderate correlation. A tendency towards low serum HDL cholesterol concen-tration in o4 carriers has been reported earlier in the STRIP project [8] and in other studies [14,19].
Because serum samples in our study were non-fast-ing, the triglyceride values represent the triglycerides synthesised in the liver and those derived from ingested fat. Still, the interval between infant’s regular meal and drawing of the blood sample was of equal length among the apo E4+ infants and the apo E4− infants.
However, a strong linear correlation exists between the fasting triglyceride concentration and postprandial triglyceride response and, thus, the fasting serum triglyceride level is an important determinant of post-prandial lipemia [28,29]. A proper oral fat loading test with specified fat load meal and a standardised blood drawing protocol with a number of tests was not feasi-ble because the study subjects were infants. Despite these shortcomings we observed a clear association between apo E4 phenotype and high serum triglyceride values in healthy infants at 7 and 13 months of age. This association would probably have been even stronger if we had measured fasting triglyceride values or used a standardised fat load protocol.
Obesity predisposes adults to high serum triglyceride concentrations. The E4− infants in the heaviest weight
tertile in this study had the highest serum triglyceride concentrations. In multivariate analysis the relative weight of infants showed no or only a modest associa-tion with serum triglyceride values, whereas infant’s apo E4 phenotype (apo E4+ or apo E4−) had a
signifi-cant effect on serum triglyceride values suggesting that apo E4+phenotype associates with high serum
triglyce-ride values independently of relative body weight. In summary, this study shows that the inherited apo E phenotypes influence non-fasting serum triglyceride values in healthy infants. The o4 allele associates with high serum triglyceride concentration, suggesting that apo E4+
phenotype may increase atherosclerosis risk not only via high LDL cholesterol concentration but also via its effect on postprandial triglyceride metabolism.
Acknowledgements
This study was supported by grants from Foundation for Pediatric Research, Finland, Medical Council of the Academy of Finland, Mannerheim League for Child Welfare, Sigrid Juselius Foundation, Yrjo¨ Jahnsson Foundation, Finnish Cardiac Research Foundation, Juho Vainio Foundation, and Turku University Hospi-tal Research Fund.
References
[1] Mahley RW, Innerarity TL, Rall SC Jr, Weisgraber KH. Plasma lipoproteins: apolipoprotein structure and function. J Lipid Res 1984;25:1277 – 94.
[2] Zannis VI, Just PW, Breslow JL. Human apolipoprotein E subclasses are genetically determined. Am J Hum Genet 1981;33:11 – 24.
[3] Mann WA, Meyer N, Weber W, Rinninger H, Greten H, Beisiegel U. Apolipoprotein E and lipoprotein lipase co-ordi-nately enhance binding and uptake of chylomicrons by human hepatocytes. Eur J Clin Invest 1995;25:880 – 2.
[4] Ehnholm C, Mahley RW, Chappel DA, Weisgraber KH, Lud-wig E, Witztum JL. Role of apolipoprotein E in the lipolytic conversion of b-very low density lipoproteins to low density lipoproteins in type III hyperlipoproteinemia. Proc Natl Acad Sci 1984;81:5566 – 70.
[5] Utermann G, Pruin N, Steinmetz A. Polymorphism of apolipo-protein E. III. Effect of a single polymorphic gene locus on plasma lipid levels in man. Clin Genet 1979;15:63 – 72. [6] Ehnholm C, Lukka M, Kuusi T, Nikkila¨ E, Utermann G.
Apolipoprotein E polymorphism in the Finnish population: gene frequencies and relation to lipoprotein concentrations. J Lipid Res 1986;27:227 – 35.
[7] Lehtima¨ki T, Moilanen T, Viikari J, A,kerblom HK, Ehnholm C, Ro¨nnemaa T, et al. Apolipoprotein E phenotypes in Finnish youths: a cross-sectional and 6-year follow-up study. J Lipid Res 1990;31:487 – 95.
[9] Assmann G, Schmitz G, Menzel H-J, Schulte H. Apolipoprotein E polymorphism and hyperlipidemia. Clin Chem 1984;30:641 – 3. [10] Eto M, Watanabe K, Ishii K. Reciprocal effects of apolipo-protein E alleles (o2 ando4) on plasma lipid levels in normolipi-demic subjects. Clin Genet 1986;29:477 – 84.
[11] Brenninkmeijer BJ, Stuyt PMJ, Demacker PNM, Stalenhoef AFH, van’t Laar A. Catabolism of chylomicron remnants in normolipidemic subjects in relation to the apoprotein phenotype. J Lipid Res 1987;28:361 – 70.
[12] Weintraub MS, Eisenberg S, Breslow JL. Dietary fat clearance in normal subjects is regulated by genetic variation in apolipo-protein E. J Clin Invest 1987;80:1571 – 7.
[13] Davignon J, Gregg RE, Sing CH. Apolipoprotein E polymor-phism and atherosclerosis. Arteriosclerosis 1988;8:1 – 21. [14] Tiret L, de Knijff P, Menzel H-J, Ehnholm C, Nicaud V,
Havekes LM. ApoE polymorphism and predisposition to coro-nary heart disease in youths of different European populations: the EARS study. Arterioscler Thromb 1994;14:1617 – 24. [15] Valdez R, Howard BW, Stern MP, Haffner SM. Apolipoprotein
E polymorphism and insulin levels in a biethnic population. Diabetes Care 1995;18:992 – 1000.
[16] Haffner SM, Stern MP, Miettinen H, Robbins D, Howard BW. Apolipoprotein E polymorphism and LDL size in a biethnic population. Arterioscler Thromb Vasc Biol 1996;16:1184 – 8. [17] Srinivasan SR, Ehnholm C, Wattigney WA, Bao W, Berenson
GS. The relation of apolipoprotein E polymorphism to multiple cardiovascular risk in children: the Bogalusa Heart Study. Atherosclerosis 1996;123:33 – 42.
[18] Salah D, Bohnet K, Gueguen R, Siest G, Visvikis S. Combined effects of lipoprotein lipase and apolipoprotein E polymorphisms on lipid and lipoprotein levels in the Stanislas cohort. J Lipid Res 1997;38:904 – 12.
[19] Dallongeville J, Lussier-Cacan S, Davignon J. Modulation of plasma triglyceride levels by apo E phenotype: a meta-analysis. J Lipid Res 1992;33:447 – 54.
[20] Lapinleimu H, Viikari J, Jokinen E, Salo P, Routi T, Leino A, Ro¨nnemaa T, Seppa¨nen R, Va¨lima¨ki I, Simell O. Prospective
randomized trial in 1062 infants of diet low in saturated fat and cholesterol. Lancet 1995;345:471 – 6.
[21] Niinikoski H, Viikari J, Ro¨nnemaa T, Lapinleimu H, Jokinen E, Salo P, Seppa¨nen R, Leino A, Tuominen J, Va¨lima¨ki I, Simell O. Prospective randomized trial of low-saturated-fat, low-choles-terol diet during the first 3 years of life. The STRIP baby project. Circulation 1996;94:1386 – 93.
[22] Sorva R, Perheentupa J, Tolppanen E-M. A novel format for a growth chart. Acta Paediatr Scand 1984;73:527 – 9.
[23] Dart A, Sherrad B, Simpson H. Influence of apo E phenotype on postprandial triglyceride and glucose responses in subjects with and without coronary heart disease. Atherosclerosis 1997;130:161 – 70.
[24] Bergeron N, Havel RJ. Prolonged postprandial responses of lipids and apolipoproteins in triglyceride-rich lipoproteins of individuals expressing an apolipoprotein epsilon 4 allele. J Clin Invest 1996;97:65 – 72.
[25] St Amand J, Moorjani S, Lupien PJ, Prud’homme D, Despre´s J-P. The relation of plasma triglyceride, apolipoprotein B, and high-density lipoprotein cholesterol to postheparin lipoprotein lipase activity is dependent on apolipoprotein E polymorphism. Metabolism 1996;45:261 – 7.
[26] Davies CE, Gordon D, LaRosa J, Wood PDS, Halperin M. Correlations of plasma high-density lipoprotein cholesterol levels with other plasma lipid and lipoprotein concentrations. Circula-tion 1980;62(Suppl 4):24 – 30.
[27] Freedman DS, Srinivasan SR, Webber LS, Berenson GS. Diver-gent levels of high density lipoprotein cholesterol and apolipo-protein A-I in children: the Bogalusa heart study. Arteriosclerosis 1987;4:347 – 53.
[28] Brown AJ, Roberts DCK. The effect of fasting triacylglyceride concentration and apolipoprotein E polymorphism on postpran-dial lipemia. Arterioscler Thromb 1991;11:1737 – 44.
[29] Reznik Y, Pousse P, Herrou M, Morello R, Mahoudeau J, Drosdowsky MA, et al. Postprandial lipoprotein metabolism in normotriglyceridemic non-insulin-dependent diabetes patients: Influence of apolipoprotein E polymorphism. Metabolism 1995;45:63 – 71.