A GPU-BASED ALGORITHM FOR THE GENERATION OF SPHERICAL VORONOI
DIAGRAM IN QTM MODE
WANG Lei*, ZHAO Xuesheng, CAO Wenmin, GUO Junfeng
Geoscience and Surveying Engineering College, China University of Mining and Technology(Beijing), Beijing 100083, China - [email protected]
KEY WORDS: Spherical Voronoi Diagram, GPU, CUDA, Global Spatial Grid, QTM
ABSTRACT:
The spherical Voronoi diagram is a type of the global data model in Digital Earth which has become increasingly important and a lot of efforts have been done to develop the algorithms. However, most of the prior works were in vector mode and based on point sets. Recently, some approximation raster-based algorithms were presented which can generate spherical Voronoi diagrams for point, curve, and face sets easily. However, almost all these raster-based algorithms are based on dilation operation and the dilation errors increase greatly with the growth of dilation steps. To overcome this deficiency, a novel GSG-based algorithm for generating spherical Voronoi diagram is proposed in this paper. In our algorithm, distance computation and comparison based on GPU are used instead of dilation operation to diminish the Voronoi error and improve the efficiency. Results show that line sets and area sets can be handled as well as point sets in this algorithm and the Voronoi error can be limited within half of one grid. Additionally, the efficiency for generating spherical Voronoi diagram is improved greatly.
*
Corresponding author at: Geoscience and Surveying Engineering College, China University of Mining and Technology(Beijing), Beijing 100083, China
E-mail address: [email protected] (L. Wang) 1. INTRODUCTION
Recently, with the development of digital earth, Voronoi diagram on the spherical surface has become an active topic and has been applied to areas like global spatial indexing, sphere interpolation, dynamic operation, etc[Chen et al. 2003]. Many researchers have developed algorithms for generating Voronoi diagrams on the sphere. However, most of the prior works were in vector mode and based on point sets. In last decade, some approximation raster-based algorithms were presented which can generate spherical Voronoi diagrams for point, curve, and face sets easily. However, almost all these raster-based algorithms are based on dilation operation and the dilation errors increase greatly with the growth of dilation steps. Even worse, the distribution of these errors is irregularly unlike the planar raster-based algorithms. This deficiency has seriously limited the application of the Voronoi data model in many areas.
To overcome these deficiencies, a novel GSG-based algorithm for generating spherical Voronoi diagram is proposed. In our algorithm, the Voronoi diagram generation is based on QTM units on spherical surface with GPU-computation.
The remainder of the paper is organized as follows: The next section briefly reviews the existing method for generating spherical Voronoi diagram. Then, a new QTM encoding method and the corresponding neighbor searching, coordinate translating methods are presented in Section 3. The algorithm to generate spherical diagram for point sets, line sets and area sets will be discussed in detail in Section 4. The experiments and the analysis of the results will be given in Section 5. In the end, conclusion and the future works are given.
2. RELATED WORK
This section will briefly review the existing CPU-based and GPU-based algorithms for generating spherical Voronoi
diagram.
2.1CPU-based Algorithms
2.1.1Algorithms in Vector mode: Augenbaum’s insertion algorithm [Augenbaum et al. 1985] and Robert’s incremental algorithm [Robert et al. 1997] are two of the earliest algorithms for generating spherical Voronoi diagrams of point sets in vector mode. Both of these algorithms are only good for point sets, but very complex for line sets, and out of consideration for area sets
[Christopher et al. 1992; Christopher et al. 1995]. [Ma and Chen 2010] improved the incremental algorithm to construct Delaunay triangulation and get Voronoi diagrams of a set of point. Also, it is only suitable for point sets. [Christopher and Mir 2000] extended the point-line model, which was presented by [Yang and Christopher 1996], onto the spherical surface to compute Voronoi diagrams of relatively complex vector-based object and deal with the dynamic changes of topological relations. But additional steps such as decompose, calculation, remove and compose made this algorithm and data structure more complex. What’s more, it’s very difficult to deal with the hierarchical expression of large quantities of the spherical data
[Chen et al. 2003].
2.1.2Algorithms in Raster mode: To overcome the deficiencies of vector-based algorithms, researchers have developed raster-based algorithms which make use of distance transformations such as city blocks, chessboards, octagons, etc. However, these raster-based algorithms are limited to a plane and cannot be translated to a spherical surface directly because planar and spherical spaces are not homeomorphous [Chen et al. 2003].
[Chen et al. 2003] proposed a QTM-based algorithm to generate Voronoi diagrams on the sphere. [Ben et al. 2006]
they both based on the dilation operation, the errors of Voronoi diagrams increase as the growth of the dilation steps although the latter can limit the error within a hexagonal grid. Additionally, the efficiency decreases sharply as the level of GSG increases.
2.2 GPU-based Algorithms
The evolution of programmable graphics hardware and the advance of GPGPU spurred the development of new GPU-based algorithms for generating Voronoi diagrams [Kenneth et al. 2000; Rong et al. 2006; Ian et al. 2006]. However, most of these algorithms are designed for computation in 2D, and it is not clear how to extend them to compute the Voronoi diagram on a surface [Rong et al. 2011]. [Rong et al. 2011] extended the Jump Flooding Algorithm(JFA) [Rong et al. 2006] to spherical space and hyperbolic space to compute Centroidal Voronoi tessellation, but it’s not hierarchical and not clear how to deal with line sets and area sets on the sphere.
3. A NOVEL QTM ENCODING METHOD
In our algorithm, the Voronoi diagram generation is based on QTM units on spherical surface with GPU-computation. To make the GPU processing convenient, a novel QTM encoding method is designed. Based on the new encoding method, the corresponding neighbor searching algorithm and translating algorithm between Longitude/Latitude and QTM codes are developed.
3.1 The Encoding Method
QTM was first proposed by [Dutton 1989] and have been studied for many years. The sphere hierarchical subdivision of QTM is shown in Figure 1.
Figure 1. Sphere Hierarchical Subdivision of QTM
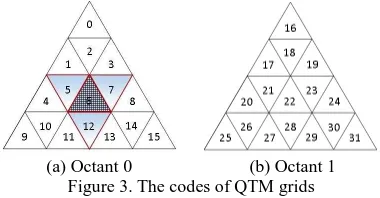
Each of the QTM grids is handled by one of the GPU threads indexed by thread ID during the generation of Voronoi diagram in our algorithm. In order to make the index faster, a sequential index method is used to encode the QTM grids.
Firstly, we give the definitions of row and column which are shown in Figure 2. The row and column number of the shadowed gird are 2 and 3.
Figure 2. The definition of Row and Column
Then, the code in the local octant can be calculated using Equation (1). We can get the local code of the shadowed grid in
Figure 2, it is “7”.
col row
localCode= 2+ (1) We can calculate the global code using Equation (2):
col row Count octa
globalCode= ´ + 2+ (2) Where octa means the ID of the octant the grid locate in and
Count means the amount of the grids in one octant which is decided by the level of QTM.
So, we can get the codes of all the grids. The codes of the grids in Octant 0 and Octant 1 of level 2 are shown in Figure 3.
(a) Octant 0 (b) Octant 1 Figure 3. The codes of QTM grids
3.2 Neighbour Searching Method
The neighbour searching method (“neighbour” here means the three edge neighbours) is used for getting the edge of each Voronoi diagram that will be detail discussed in Section 4. The method in this paper is similar to the edge-neighbour searching method proposed by [Chen et al. 2003]. We classify the grids in one octant into seven categories (see Figure 4) according to their locations as they do. The characteristic of each category and the computing of their neighbours can be seen in Table 1.
Figure 4. Categories of grids in one octant [Chen et al. 2003]
Table 1. Characteristic and neighbor searching of each category
Row Col Left Right Top
A C-1 C+1 C+ N+1
C-N+1
B 0 0 L*P R*P C+2
C M-1 0 (L+1)*P -1 C+1 (T+1)*P-1 D M-1 N-1 C-1 (R+1)*P-N (T+1)*P-N
E [1,M-2] 0 L*P+ K+ N-1 C+1 C+ N+1
F [1,M-2] N-1 C-1 R*P+ K-N+1 C+ N+1
G M-1 [2,N-3] C-1 C+1 (T+1)*P-Col-1
Where M means amount of rows and N means the amount of columns of which the grid locate in; C means the global code of the grids and K means the local code of the grid; L means the ID of the left octant, R means the ID of the right octant and T
means the ID of the top octant; P means the amount of the grids in one octant; Row and Col means the row and column the grid locate in; Left, Right and Top means the global codes of the three neighbors.
3.3 Translating Between Longi/Latitude and QTM Code
In the section, the translating between Longitude/Latitude and QTM code is presented. The following are the steps to translate the code (N) of a grid to the Longitude (l) and Latitude (j)
of its centre.
1. Compute the local code K
P
The computation of local Longitude is different according to the odevity of j , it can be computed by using Equation (5).
The computation of local Latitude is different according to the odevity of j , it can be computed by using Equation (6).
row count of the octant in the corresponding level. 5. Compute the global Longitude (l) and Latitude (j) The calculation of the global Longitude and Latitude is different according to the ID of the octant the grid locates in. They can be computed as follows:
The translating from a pair of Longitude/Latitude to the code of the QTM gird it locates in is the inversion of the above steps, and it will not be discussed in detail here.
4. A GENERATION METHOD OF VORONOI DIAGRAM
For a bounded region in the planar surface, the distance can be Euclidean distance, but in the spherical surface, the distance is the length of the geodesic line between two points (the great circle distance), it can be calculated as follows:
) definition of the spherical Voronoi diagrams in QTM mode here can be defined similar to Equation (7), where the distance function d have to be replaced by dsand w have to be defined as the QTM grid.
4.2 CUDA
CUDA (Compute Unified Device Architecture) is a computing platform launched by NVIDIA in 2006; it’s a general purpose parallel computing architecture with a new parallel programming model and instruction set architecture that leverages the parallel compute engine in NVIDIA GPUs to solve many complex computational problems in a more efficient way than on a CPU. CUDA C extends C by allowing the programmer to define C functions, called Kernels, that, when called, are executed N times in parallel by N different CUDA threads [Nvidia 2012] which are organized in the thread blocks and grids. And these threads may access data from multiple memory spaces during their execution, such as local memory, shared memory, global memory, constant memory and texture memory. Different memory spaces are suitable for various applications due to the differences of their memory size and access speed.
4.3 Generation of Voronoi Diagrams
4.3.1Common Algorithm: In our algorithm, QTM grid is regarded as the minimum unit, just like pixel on the screen. The critical step to generate Voronoi diagrams is to choose the best site (the nearest site) for each of the QTM grids on the sphere by computing and comparing the distances from the grid to all the input sites. Massive computation and comparison have to be done in this step. Meanwhile, the computation and comparison for each of the grids are similar and independent to each other. It is very suitable for GPU, which is especially well-suited to address problems that can be expressed as data-parallel computations, to do these massive tasks.
Certain amounts of threads (the amount is equal to the number of grids on the sphere) are set to conduct the computation and comparison, and each thread is used to handle one of the grids. A kernel function that runs on GPU is designed to choose the best site for each of the grids. Each of the GPU threads does the distance computation and comparison task by executing the kernel function with different data source (different grid). The data source of each thread is selected by matching the code of the grid and the thread ID in GPU.
The vertexes of the grids and the input sites are firstly stored in the global memory, which has a large memory size but low access speed. To overcome the low access speed of the global memory, shared memory is used to reduce the access to the global memory. The shared memory gets certain number (the number is decide by the amount of threads in a block) of the vertexes from the global memory and stored them for the moment. These vertexes are then shared by the threads in one block for the computation and comparison. The pseudo code of the kernel function is as follows:
The vertexes of the the grids grid gridVerts, the vertexes of the input sites siteVerts and its amount Count.
Output:
The IDs of the best sites of all the QTM grids bestSites. __global__ SphereVoronoiCompute()
{
//Get the block ID and thread ID
bid¬blockID; tid¬threadID; //Get subBestSites
subBestSites¬GetSubBestSites(bid);
//Get sub grid vertexes for shared memory
subGrids¬GetSubVertex(gridVerts,bid);
For i=0 to Count/blockSize {
//Get subSiteVertexes for shared memory
subSites¬GetSubVertex(siteVerts,i);
store subGrids and subSites in shared memory;
Threads synchronization;
For every site in subSites {
//Distance computation
currDist¬DistCompute(subGrids[tid], site);
//Distance comparison
If currDist is shorter than tempDist {
Replace the value of tempDist, tempBest by
currDist and site;
} } End for
Threads synchronization;
} End for
//The best site is tempBest.
subBestSites[tid]¬tempBest;//return bestSite
}
4.3.2Point sets: The algorithm above can be applied directly to generate the spherical Voronoi diagram of point sets. The QTM grids that have the same best site form the Voronoi region of their best site.
4.3.3Line sets: As for line sets, an additional index have to be appended to the QTM grids the line go through beside the code. The index indicates which line the grid belongs to. When computing the best site using the algorithm stated in section 4.3.1, the indexes of the grids have to be returned. The QTM grids that have the same index form the Voronoi region of the line.
4.3.4Area sets: Area sets can be handled similarly to line sets. The difference is only the grids that form the edges of the area are seen as the input site but not all the grids in the area. The extraction of area edge is an important step in the generation of spherical Voronoi diagram of area sets. Especially, if there is a hole in the area, both the outer edge and the inner edge have to be extracted. The Voronoi boundary extraction algorithm that will be presented in Section 4.4 also can be used to extract the edges of the input area sets.
4.4 Extraction of Voronoi boundaries
We get the Voronoi diagram of the three types of sites through the algorithm stated in the previous section. However, if the Voronoi boundaries are needed, the extraction operation has to be done to get the boundaries of the Voronoi diagrams.
The main principle of the extraction is: For each of the grids on the sphere, if the three neighbours of the grid and itself belong to two or more Voronoi regions, it’s on Voronoi boundary; else if they belong to only one Voronoi region, it’s inside the Voronoi region. This operation for each of the grids is similar and independent to each other, so we do this task through a kernel function that runs on the GPU. The pseudo code of the kernel function is as follows:
Kernel Function 2: Input:
The codes of the best sites of all the QTM grids
dev_bestSites. Output:
The Boolean values of the QTM grids dev_isOnboundary
to indicate if they are on Voronoi boundries. __global__ BoundaryExtraction() {
code¬threadID; //Get thread ID //Get the neighbours
neighbours¬NeighbourSearch(code);
//Get the best sites (or index for line sets and area //sets ) the three neighbors and itself
bestSites[0] ¬ dev_bestSites[neighbor[0]]; bestSites[1] ¬ dev_bestSites[neighbor[1]];
bestSites[2] ¬ dev_bestSites[neighbor[2]];
bestSites[3] ¬ dev_bestSites[code];
//Compare the best sites
If all the four element in bestSites are the same Then, dev_isOnboundary[code] ¬false; Else, dev_isOnboundary[code] ¬true;
}
5. EXPERMENTS AND ANALYSIS
We implement our algorithm using Microsoft Visual C++ 2010 and NVIDIA CUDA 4.2. The hardware platform is Intel(R) Core(TM) 2 Quad CPU Q8400 @2.66GHz with 2.00 GB RAM, and NVIDIA GeForce 9600 GT with Compute Capability 1.1. We have compared our experimental result with the CPU-based Spherical Voronoi algorithms in QTM mode [Chen et al, 2003].
5.1 The Results of Our Algorithm
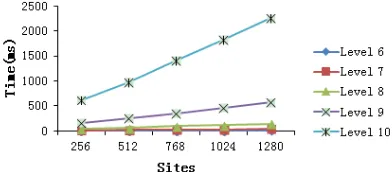
To test the influence of the QTM level and the amount of the input sites to the time for generating the spherical Voronoi diagrams, Voronoi diagrams in different QTM levels with different amount of sites are generated. Figure 5 shows the relationship between the generating time (millisecond) and the amount the input sites (point sets); Figure 6 shows the relationship between the generating time and the QTM levels.
Figure 6. The influence of the QTM level
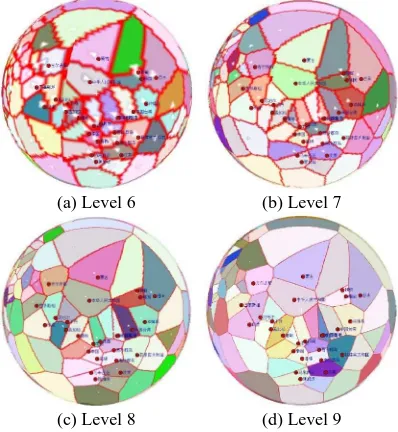
Figure 5 shows that the time for generating the spherical Voronoi diagrams is linear to the amount of the input sites. This is only for the point sets. As for line sets, the time is linear to the number of the grids the line go through; and for area sets, the time is linear to the number of the grids that form the edges of the area. Figure 6 shows that the generating time increases exponentially as the growth of the level, this is because the number of the grids on the sphere is exponential to the QTM level. Although time consuming, the Voronoi diagram we get from higher level of QTM grids is of greater quality. Figure 7 shows the Voronoi diagrams generated by the centers of all the countries in the world in different QTM Levels. So, under the condition that the precision is satisfied, we should use lower level to get a higher efficiency.
(a) Level 6 (b) Level 7
(c) Level 8 (d) Level 9
Figure 7. Voronoi diagrams of all the countries in the word
The Voronoi boundary extraction algorithm is also tested in our experiments. Figure 8 shows the Voronoi boundaries of point sets, line sets, area sets and the composite of all the three types of sites in Level 9. The blue objects are the input sites and the red lines are the Voronoi boundaries of the sites.
(a) Point sets (b) Line sets
(c) Area sets (d) Composite sets Figure 8. Voronoi boundaries
5.2 Contrast to Other GSG-Based Algorithm
5.2.1Precision: The CPU-based algorithm[Chen et al. 2003]
for generating spherical Voronoi diagrams in QTM mode is based on dilation operations, the dilation errors increase with the growth of dilation steps. [Chen et al. 2003] presented the distance distortions of their algorithm, the maximum distance distortion is up to 8 times of the grid size. Our algorithm is based on the distance comparison instead of dilation operation, there are no dilation errors. However, “shape errors” of Voronoi diagrams, which exist in[Chen et al. 2003], also exist in our algorithm because a point is represented by a QTM grid which is an area region strictly. But these errors can be limited within half of the QTM grid size by computing distances from centre to centre. Figure 9 shows the Voronoi diagrams generated by the two algorithms in QTM mode of the same input sites. We can see the Voronoi boundaries of Chen’s algorithm are irregular because of the dilation errors.
(a) Chen’s algorithm (b) Our algorithm Figure 9. Voronoi diagrams of the two algorithms
5.2.2Efficiency: Contrast with the CPU-based serial processing, which is used in [Chen et al. 2003], the distance computation, comparison and boundary extraction of our algorithm are based on GPU parallel computation. So, the efficiency is relatively higher. We have compared the efficiency of our algorithm with Chen’s QTM-based algorithm. Table 2 and Figure 10 show the generating times (millisecond) of the two algorithms in different levels with the same input sites. The advantage of our algorithm is more obvious at higher levels because GPU is more suitable for computation with massive data.
Meanwhile, we implement our algorithm with the CPU-based serial processing. Table 3 and Figure 11 show the generating times (millisecond) of the GPU and CPU. The efficiency is speeded up by 74.6 times in Level 8 and 81.5 times in Level 9 because the using of GPU.
Table 2. Generating times of the two algorithms
Level 5 6 7 8 9
Figure 10. Generating times of the two algorithms
Table 3. Generating times of GPU and CPU
Level 5 6 7 8 9
CPU 42.6 182.1 744.6 3143.1 12847.1 GPU 4.5 5.8 13.0 42.1 157.7 Ratio 9.5 31.4 57.3 74.6 81.5
Figure 11. Generating times of GPU and CPU
6. CONCLUSION AND FUTURE RESEARCH
We present a new GSG-based algorithm for generating Voronoi diagrams on the sphere with GPU parallel computing. A novel encoding method of QTM is proposed to fit the GPU possessing and the corresponding neighbor searching and translating between code and Longi/Latitude methods are developed. Then, algorithms for generating spherical Voronoi diagrams and extracting Voronoi boundaries based on the new encoding method is presented.
The algorithm for generating spherical Voronoi diagrams described in this paper is the first attempt to generate spherical Voronoi diagrams in GSG mode by using GPU. The efficiency of the GSG-based spherical Voronoi generating algorithm is improved in our algorithm because the using of GPU parallel computation. Meanwhile, the Voronoi errors are limited within half of a grid by implementing the algorithm with distance computation and comparison instead of dilation operations.
Although the efficiency is improved in our algorithm, the time for generating Voronoi diagram is exponential to the GSG level and the efficiency is lower at higher levels. We look forward to solve this problem by generating spherical Voronoi diagrams with multi-resolution GSG grids in the future work.
REFERENCES
Augenbaum J.M., C.S. Peskin., 1985. On the construction of the Voronoi mesh on a sphere. Journal of Computational Physics, 1985. 59(2), pp. 177-192.
Ben J., Tong X., Zhang H., et al. 2006. A Spherical Voronoi Algorithm Based on Hexagonal Grid. Journal of Zhengzhou Institute of Surveying and Mapping, 23 (5), pp.328-330.
Chen J., Zhao X., Li Z., 2003. An algorithm for the generation of Voronoi diagrams on the sphere based on QTM.
Photogrammetric Engineering & Remote Sensing, 69 (1),
pp.79-89.
Christopher M.G., 1992. The Meaning of 'Neighbour'. Theories and Methods of Spatio-Temporal Reasoning in Geographic Space. Springer-Verlag, Berlin, Germany, pp.220-235.
Christopher M.G., Alfonso R.C., 1995. A spatial data structure integrating GIS and simulation in a marine environment.
Marine Geodesy. 1995,18(3), pp.213-228.
Christopher G., Mir A.M., 2000. Towards the global GIS.
ISPRS Journal of Photogrammetry & Remote Sensing, 55(3), pp.150-163.
Dutton G., 1989. Modelling locational uncertainty via hierarchical tessellation. Accuracy of Spatial Databases(M. Goodchild and S. Gopal, editors), Taylor and Francis, London, United Kingdom, pp.125-140.
Hyeon-S N., Chung-N L., Otfried C., 2002. Voronoi diagrams on the sphere. Computational Geometry, 2002(23), pp.183-194.
Ian F, Craig G., 2006. Fast Approximation of High-Order Voronoi Diagrams and Distance Transforms on the GPU. Journal of Graphics, GPU, and Game Tools, 2006,11(4), pp.39-60.
Kenneth E. H., Tim C., John K., et al., 2000. Fast Computation of Generalized Voronoi Diagrams Using Graphics Hardware. In Proceedings of the 26th annual conference on Computer graphics and interactive techniques, pp. 277-286.
Ma Y., Chen Q., 2010. Fast Delaunay Triangulation and Voronoi Diagram Generation on the Sphere. In Second WRI World Congress on Software Engineering (WCSE), Wuhan , 2010. pp.187-190.
Nvidia, NVIDIA CUDA C Programming Guide 5.0. 2012.
Robert J. Renka., 1997. Delaunay triangulation and Voronoi diagram on the surface of a sphere. ACM Transactions on Mathematical Software, 1997. 23(3), pp.416-434.
Rong G., Tiow-S T., 2006. Jump Flooding in GPU with Applications to Voronoi Diagram and Distance Transform. In
2006 ACM Symposium on Interactive 3D Graphics and Games, Redwood City, CA, UAS, 2006, pp.109-116,228.
Rong G., Jin M., Shuai L., et al., 2011. Centroidal Voronoi tessellation in universal covering space of manifold surfaces.
Computer Aided Geometric Design, 2011. 28(8), pp. 475-496.
Rong G., Liu Y., Wang W., et al., 2011. GPU-Assisted Computation of Centroidal Voronoi Tessellation. Visualization and Computer Graphics, IEEE Transactions, 2011. 17(3), pp. 345-356.
Thanh-T C., Ke T., Anis M., et al., 2010. Parallel Banding Algorithm to compute exact distance transform with the GPU.
Proc. Symp. Interactive 3D Graphics and Games. Washington D.C., 2010. pp.83-90.
Tong X., Ben J., Zhang Y., 2006. The Generation Algorithm for Spherical Voronoi Diagram of Different Aggregation. Acta Geodaetica et Cartographica Sinica, 35 (1), pp.83-89.