FEATURE-BASED QUALITY EVALUATION OF 3D POINT CLOUDS – STUDY OF THE
PERFORMANCE OF 3D REGISTRATION ALGORITHMS
T. Ridene a, F. Goulette b, S. Chendeba
a CITU PARAGRAPHE, Paris 8 University, 2 rue de la Liberté 93526 Saint-Denis Cedex, Paris region, France - (taha.ridene, safwan.chendeb)@citu.fr
b Robotics Lab, Mines ParisTech, 60 Boulevard Saint Michel 75006 Paris, France - [email protected]
Commission III WGIII/4
KEY WORDS: FBQ-Evaluation, Fuzzy, Binary, ICP, 3D Point Clouds, MMS, DSM.
ABSTRACT:
The production of realistic 3D map databases is continuously growing. We studied an approach of 3D mapping database producing based on the fusion of heterogeneous 3D data. In this term, a rigid registration process was performed. Before starting the modeling process, we need to validate the quality of the registration results, and this is one of the most difficult and open research problems. In this paper, we suggest a new method of evaluation of 3D point clouds based on feature extraction and comparison with a 2D reference model. This method is based on tow metrics: binary and fuzzy.
1. INTRODUCTION
The use of 3D mapping databases is continuously growing, and is subject to an ever increasing interest in research fields such as in virtual and augmented reality in order to meet different needs and to be used in different applicative domains, as military, touristic, heritage valorisation, etc.
Several methods have been used to develop these databases. We identify three main classes: (1) Approaches from airborne view via remote sensing; (2) Methods based on Mobile Mapping Systems (MMS) and (3) Methods based on simultaneous poses of fixed laser acquisition. More detailed explanations of these three approaches are given in [1, 2, 17].
1.1 Context
Our work is carried out under the projects TerraNumerica1 and
TerraDynamica2. The target is to use a multi-data fusion to produce 3D mapping model.
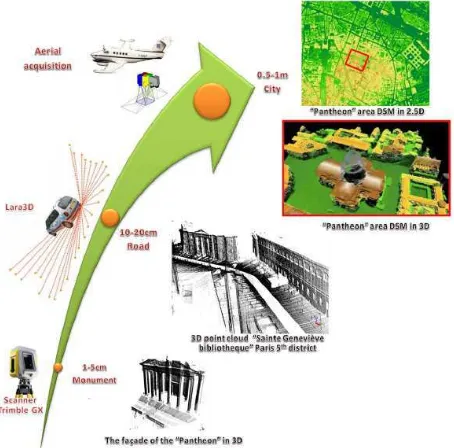
We perform an integration of three kinds of 3D data: (1) DSM obtained by automated matching of stereo images (produced by IGN); (2) 3D point clouds issued by a Mobile Mapping System (MMS) Lara3D [4], based on multi-sensor data fusion techniques; (3) 3D point clouds issued by fixed laser scanner (produced by MENSI TRIMBLE). Those types of data have different resolutions and precisions.
Furthermore, the geometry of acquisition of each kind of data is different. This is the source of the heterogeneity of the processed datasets. We focus on the registration step in the processing of 3D model generation in an outdoor environment. Data characteristics can be found in [1,2]. Fig. 1 shows some dataset examples.
An important issue to handle after producing a 3D representation is to evaluate the accuracy and realism of the result. This is equivalent to a semantic analysis of the 3D
1
http://www.terranumerica.com/ 2
http://www.terradynamica.com/
representation to assess whether an object in a 3D scene corresponds to the same geometric structure in reality (classification and object recognition).
Alternatively, the goal of this work is to make qualitative evaluation of 3D registration, using feature extraction and comparison with accurate 2D reference models.
Fig. 1. Heterogeneous data collected in the 5th district in Paris, next to the Pantheon. Illustration of the role and level of representation of the three types of merged 3D data. We start with a high level of accuracy (1 to 5 cm) for data representing the remarkable buildings. We go to a medium resolution (10 to 20 cm) for the representation of streets and finish with a lesser accuracy (0.5 to 1 m) for the city.
International Archives of the Photogrammetry, Remote Sensing and Spatial Information Sciences,
1.2 Contributions
The main contributions in this work are: (1) propose a new method of evaluation of 3D representations based on feature extraction and comparison with 2D reference models; (2) using this feature-based evaluation method to compare qualitative performances of our registration-implemented algorithms. This paper is organized as follows. In section 2 we present a context of heterogeneous registration, and our implementations are described with exhibition of 3D registration results on a globally processed area. In section 3, our feature-based quality (FQB) evaluation method is detailed. In section 4 we discuss the result of the FBQ evaluation used to compare the performances of registration algorithms. We then present our conclusions and perspectives for future works.
2. HETEREGENEOUS REGISTRATION
2.1 The need for a registration step
The contribution of our heterogeneous data fusion lies in the fact that they complement each other. In fact, the absence or lack of information from a given data source is filled by the presence of this information from another source. Typically, roof information which is not accessible from terrestrial acquisitions (Mobile-Fixed terrestrial laser) can be recovered from aerial data (DSM). In the same way footprint of the buildings hidden by the edges of rooves in a DSM will be available from terrestrial acquisitions. But this integration between different acquisition issued from the same source or from different sources, is faced with the problems of gaps and inconsistencies (see Fig. 2). A registration step is required in this case before performing the fusion and modelling steps.
Fig. 2. Discrepancies between road sections produced by
Mobile Mapping System : Lara3D.
2.2 Implemented and used registration methods
In order to perform the rigid registration, we implemented three variants of ICP (Iterative Closest Point) registration methods. (1) ICP-SA (Ordinarily ICP) [5, 6] using dynamic threshold determination. Details of the implementation are described in [4, 2]. (2) R-ICP, we perform an initialization before the start of the ICP-SA algorithm, using RANSAC. For more details one can refer to [1]. (3) HPS-ICP, we perform an initialization before the start of the algorithm using segmentation of horizontal plans. For more details one can refer to [1, 2, 3, 13].
2.3 Rigid registration global result
We performed different scenarios of registration between road sections issued from Lara3D [3], 3D point clouds issued from a
algorithm presented above was performed on the processed area. Fig. 3 shows a global result of registration in this area. A correct registration result guarentees the quality of the 3D modeling. Fig. 4 shows the result of the modelization issued from TerraNumerica project and used in TerraDynamica project.
Fig. 3. Area around Pantheon in the 5th district of Paris. (a) Incoherence in input heterogeneous data (b) Final result of registration : combination of the best results of ICP-SA, R-ICP and HPS-ICP.
Fig. 4. Result of modelization based on 3D data produced by heteregeneous acquisitions.
3. FEATURE-BASED QUALITY EVALUATION
3.1 Previous works
In previous works, the evaluation metrics that were used to evaluate the algorithm were: (1) behaviors in terms of convergence; (2) acceleration and processing time. Details of application and different evaluations are exposed in [1, 2, 3, 5, 18].
In the case of manipulation of 3D point clouds, the qualitative evaluation corresponds to the comparison between two 3D point clouds (data to evaluate and reference data). In this way:
• Mémoli and Sapiro in [8] proposed a theoretical and
computational framework to compare shapes represented as point clouds, their underlying theory International Archives of the Photogrammetry, Remote Sensing and Spatial Information Sciences,
• Shih in [19] presented a qualitative evaluation method
based on boolean comparison between 3D point clouds, this work was conducted for detection of changes throughout time. (4D context).
• Girardo-Montaut in [20] detailed techniques of
comparison between 3D point clouds in a nuclear industry context.
• Other methods are based on automatic extraction of geometric features [10,11] and on comparison with corresponding features in a reference model. The common point of the cited methods is the use of a 3D reference models to perform the evaluation.
3.2 Elements required for a quantitative evaluation
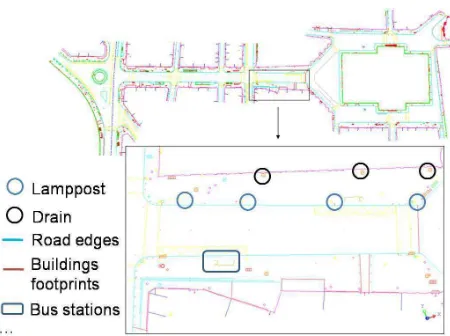
In order to determine a quantitative evaluation of 3D registration result, and if we aim at using existing approaches, we need a 3D reference representation of the same processed area. But we do not have access to such data in our case, and this kind of data is technically difficult to acquire. However we have access to an accurate 2D map of this area with a priori knowledge for all contained features, which can be used as a reference (see Fig. 5). Our idea is to use 2D reference information to quantify the 3D registration quality.
Fig. 5. 2D reference map (scale 1/200e) for the 5th district area in Paris around the Pantheon. Different geometric features can be found in the 2D presentation with accurate positioning.
In order to choose the most effective geometric feature in the processed area, we performed an analysis on the 3D data produced by Lara3D. The most commonly occurrence and regular feature on the processed area is the "lamppost." The reference map contains 139 "lamppost position” with a centimetric resolution.
To apply our method we first need to extract “lampposts” in the 3D point clouds issued from Lara3D. We use an interactive tool [12] to perform that (see Fig. 6).
3.3 Proposed method
Our qualitative evaluation method is an evaluation of successful score of matching, FBQ-Eb and FBQ-Ef based on two main
steps: (1) manual extraction of "lamppost" positions on MMS point clouds after registration, and (2) binary or fuzzy comparison with positions on the 2D reference map. The validation of our measurements was done according to two functions: Eb(.) and Ef(.) for respectively binary and fuzzy
metrics. Fig. 7 shows the general diagram of our method of evaluation. The details of each part are proposed as follows. Fig. 8 shows the results given by our evaluation method process for a comparison between ICP-SA and R-ICP 3D registration.
Fig. 6. Road section in 5th district of Paris. Interactive extraction of “lamppost” in Lara3D point clouds. Lamppost can be represented by 1 to 3 3D profiles. This generates uncertainty in the reference point selection.
Fig. 7. Feature based quality evaluation (FBQ) – general
diagram.
Exx(.) is based on binary or fuzzy response for the evaluation of
each extracted feature. The fuzzy response is based on probalistic response [0-1]. Hence, it could be effective with other datasets. Indeed, the interactive selection is not very accurate; “Lamppost” can be represented by 1 to 5 3D profiles. This generates uncertainty in reference point selection and it is not common to use a probalistic approach.
The use of Exx(.) is generic with respect to other kinds of point
clouds, in which geometric features can be extracted according to the environment knowledge.
International Archives of the Photogrammetry, Remote Sensing and Spatial Information Sciences,
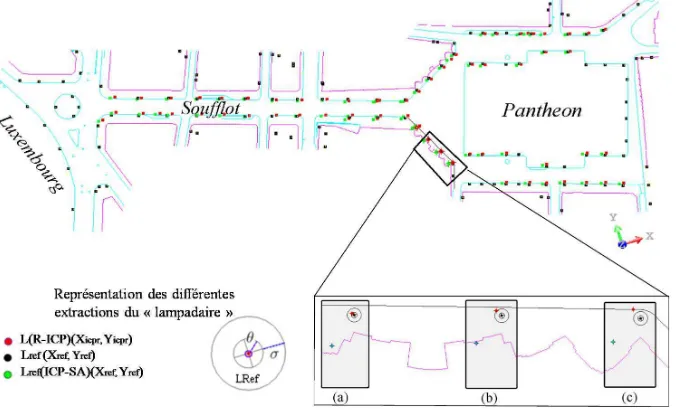
Fig. 8. We extracted the position data of "standard" Li resulting from registration with ICP-SA and R-ICP and compared these
positions with reference positions LRefi according to the formula Eb (.). (a) Eb (L (R - ICP)) = true and Eb (L (ICP- SA)) = false. (b)
Eb (L (R - ICP)) = true and Eb (L (ICP - SA)) = false. (c) Eb (L (R - ICP)) = false and Eb (L (ICP - SA)) = false.
3.3.1 Binary approach: Eb(.)
The binary evaluation is based on the Eb(.) metric defined
recording the equation :
n being the number of “lampposts”, Li and LRefi correspond
respectively to the extracted “lamppost” and the reference “lamppost” positions. σ represents the uncertainty of the selected point and θ the radius of the “lamppost model” from the ground truth.
3.3.2 Incertainty detemining: σ σ is given by :
σd is determined by the TLS (Terrestrial Laser System)
evaluation of error explained by Reshetyuk in [14], which is based on Lichti and Gordo results [15,16].
Reshetyuk takes into account three kinds of correction:
• (1) Horizontal correction
• (2) Vertical correction :
With c, i, θ0, δθ, correspond respectively to: collimators,
vertical axis index, and horizontal axis. φacc and θscan are related
to the horizontal and the vertical directions.
• (3) Radius distance correction
With and corresponding
respectively to the corrections: instrumental, in relation to environmental conditions, with scanned scene, and multi-pixel
with σφ.acc is not taken into account in our approach which is based on 2D reference map. The value of µ is given by σθ.acc which is the vehicle vibration.
3.3.3 Fuzzy approach: Ef(.)
The fuzzy evaluation is based on the Ef(.) metric defined
recording the equation :
with n : number of “lampposts”.
F(.,.) is a fuzzy function defined on]0,1] by :
d is given by the Euclidian distance.
A "lamppost" is represented by 1 to 5 laser profiles in the cloud of points resulting from Lara3D (see Fig. 9). We replace the selection function initially as a binary by a fuzzy function based in uncertainty φ, the function is shown in Fig. 10 and it is expressed as φ = {0 or 0.25 or 0.5 or 0.5 or 0.75 or 1}
corresponding respectively to the number of the laser profile representing the “lamppost” during the extraction process: International Archives of the Photogrammetry, Remote Sensing and Spatial Information Sciences,
Fig. 9. (left) binary function. (right) fuzzy function.
Fig. 10. Illustration of the uncertainty in the selection of the point representing the "lamppost". (a) Case of a selection based on a single profile φ = 0. (b) Case of a selection based on two profiles φ = 0.25. (c) Case selection based on three profiles: φ = 0.5. (d) Cases selected on the basis of four profiles: φ = 0.75. (e)
Provision for selection on the basis of five profiles φ = 1.
4. RESULTS OF EVALUATION
4.1 Evaluation initialization
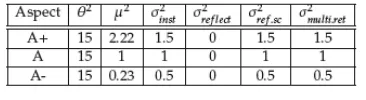
On the treated area, “103” "lampposts" have been identified in the 3D processed point clouds compared to “139” in ground truth. This is due to the noise problem occurring during data acquisition in a dynamic urban environment. The values required for the initialization of the evaluation method (binary, fuzzy) are expressed in Table 1. θ is expressed as a priori knowledge models of "lampposts" of the 5th district of Paris. µ was established after acquisition campaign in collaboration with
Trimble Mensi [17]. σinst is set according to the characteristics of
the laser scanner. σreflect is not taken into account because of the
heterogeneity of the vesting conditions. σref.sc and σmulti.ret are
determined by experimentation. For the validation of our approach on the results of registration, we adopted three sets of variables with these configurations: tolerant, moderate or
challenging.
Table 1. Values required for initializing the validation processing.
In this paper we propose as sample of result of the evaluation on the “Soufflot Street”. “25” “lampposts” were extracted compared to “32” in ground truth in this portion.
4.2 Binary evaluation on “Soufflot Street”
Table 2 shows the result of the evaluation score returned by
FBQ-Eb for the three algorithms. Success rates are much higher
with R-ICP and HPS-ICP than with ICP-SA. The scores of
HPS-ICP and R-ICP are close with an advantage for R-ICP.
This corresponds to (4%, 12% and 8%) respectively to the configurations (A +, A and A-).
Table 2. Qualitative evaluation of the registration results in terms of accuracy. Comparison of results of three algorithms
ICP-SA, R-ICP and HPS-ICP on the registration section of the
“Soufflot Street”. 4.3 Fuzzy evaluation on “Soufflot Street”
We applied the fuzzy evaluation FBQ- Ef by using the fuzzy
selection-based operator, determined interactively (see Fig. 10). We also simulated four cases of artificial selection that replace each time φ. These cases correspond to a uniform variation applied to all the selected positions (all = 0.25, all = 0.5, all =
0.75, all = 1). These four cases are used to assess the
performance of the validation approach proposed in the special conditions of selection. For example, the case of (all = 1) corresponds to the selection of an operator in a case of very dense point cloud (representing a "lamppost" by more than 5 profiles).
Out of “32” “lampposts” in ground truth, only “23” were considered in the selection of focus. “7” “lampposts” were not represented in the 3D point cloud and “2” were represented by a single profile. Table 3 includes the distribution of the fuzzy selection interactive.
Soufflot Street
Number of “lampposts” Details of the selection φ
hidden considered φ=0 φ=.25 φ=0.5 φ=0.75 φ=1
7 25 2 7 11 5 1
Table 3. “Soufflot Street”: values obtained by the fuzzy interactive selection.
The comparison of artificial configurations (all = 0.5, all = 0.5, all = 0.75, all = 1) shows a large superiority in terms of score of
R-ICP and HPS-ICP compared to ICP-SA, the dominance of the
cases (A, A-, A +) crossed with four cases of configurations artificial difference score is more than 60%. For the selection φ, we obtain relatively high scores for R-ICP and HPS-ICP compared to ICP-SA. The comparison between R-ICP and
HPS-ICP shows the superiority of HPS-ICP-R with (16%, 20% and 21%)
corresponding respectively to the configurations (A-, A, A+). Fig. 11 exhibits the FBQ- Ef scores related configurations (A-, A
and A+) for the registration on the “Soufflot Street” R-ICP, and HPS-ICP and ICP-SA.
International Archives of the Photogrammetry, Remote Sensing and Spatial Information Sciences,
Fig. 11. “Soufflot Street”. Score of FBQ- Ef for R-ICP, HPS-ICPand ICP-SA for the configrations : (l) A-, (c) A and (r) A+.
5. CONCLUSION AND FUTURE WORK
In this paper, we have shown a new method of evaluation of 3D point clouds based on feature extraction and comparison with a 2D reference model. This method allows us to obtain a qualitative evaluation of 3D results of registration methods, and then to perform a qualitative comparison between the performances of those 3D registration algorithms based on ICP. This method uses two kinds of metrics “fuzzy and binary (FBQ-
Eb and FBQ- Ef), applied on 3D laser data. FBQ- Exx can be
used to evaluate other kind of algorithm which produces 3D representation.
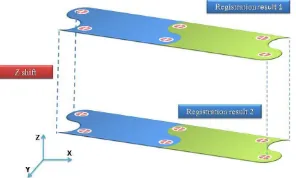
When data results of two different registrations are only shifted on Z axis, FBQ- Exx fails and cannot return a correct
quantification (see Fig. 12). Of course a 3D reference model would solve this limitation. In this term, FBQ- Exx can be
extended in future work using 3D reference features.
Fig. 12. Case of shift in Z axis. FB-Evaluation cannot return
TerraNumerica and TerraDynamica projects. The reference
model was delivered by the Mairie de Paris. 7. REFERENCES
1. T. Ridene, F. Goulette, “Registration of fixed-and-mobile-based terrestrial laser data sets with DSM,” 8th
IEEE- CIRA2009, Daejeon, 2009.
2. T. Ridene, F. Goulette, “Registration of several 3D point clouds issued from a Mobile Mapping System, together and with respect to DSM and fixed scanner data,”
Mobile. Mapping Technologies, Sao Paolo, 2009.
3. T. Ridene, F. Goulette, “ Recalage de relevés laser fixes et mobiles sur MNS pour la cartographie numérique 3D,” Mobile. RFPT, 2011.
4. F. Goulette, F. Nashashibi, I. Abuhadrous, S. Ammoun,
Modelling,” In Proceedings of the ISPRS Commission I
Symposium, From Sensors to Imagery, Paris, 2006.
5. P. Besl, H. Mckay, “A method for registration of 3-D shapes,” Pattern Analysis and Machine Intelligence,
IEEE Transactions on, 14, no 2, pp. 239-256, 1992.
6. Y. Chen, G. Medioni, “Object modelling by registration of multiple range images,” Image and Vision Computing, 10, no 3, pp. 145–155, 1992.
7. F. Latremoliere, “Approximation of quantum tori by finite quantum tori for the quantum Gromov--Hausdorff distance,” Journal of Functional Analysis, 2005. 8. F. Mémoli, G. Sapiro, “Comparing point clouds,”
Pattern Analysis and Machine Intelligence, Proceedings of the Eurographics/ACM SIGGRAPH symposium on Geometry processing, pp. 40-49, 2004.
9. S. Gumhold, X. Wang, R. MacLeod, “Feature Extraction from Point Clouds,” Proc. 10th Int. Meshing
Roundtable, pp. 293-305, 2001.
10. M. Pauly, R. Keiser, M. Gross, “Multi-scale feature extraction on point-sampled surfaces,” Computer
Graphics Forum, pp. 281–289, 2003.
11. J. Daniels, L.K. Ha, T. Ochotta, C.T. Silva, “Smooth feature extraction from point clouds,” International
Conference on Shape Modeling and Applications, 2007.
12. RealWorks, http://www.trimble.com/realworks.shtml time-of-flight terrestrial laser scanners. PhD thesis, Royal Institute of Technology (KTH)”, Department of
Transport and Economics Division of Geodesy,
Stockholm, 2006.
15. R. Li. “Mobile Mapping: An emerging technology for spatial data acquisition”. Photogrammetric Engineering
and Remote Sensing, 63(9):1085–1092, 1997.
16. D.D. Lichti, S.J. Gordon, and T. Tipdecho. “Error models and propagation in directly georeferenced terrestrial laser scanner networks”. Journal of Surveying
Engineering, 131 :135, 2005.
17. T. Ridene, “Co-recalage de données hétérogènes 3D géo-référencées : contributions à la correction des relevés laser mobiles ”, PhD Thesis, Mines ParisTech, 2010. 18. D. Akca. “Least Squares 3D surface matching”. PhD
thesis, Institut für Geodäsie und Photogrammetrie,
Eidgenössische Technische Hochschule, 2007.
19. N.J. Shih, M.C.Wu, and J. Kunz. “The inspections of as-built construction records by 3D point clouds”. Center
for Integrated facility engineering (CIFE), 2004.
20. D. Girardeau-Montaut. “Détection de changement sur International Archives of the Photogrammetry, Remote Sensing and Spatial Information Sciences,