CLASSIFICATION OF LIDAR DATA FOR GENERATING A HIGH-PRECISION
ROADWAY MAP
J. Jeong a, I. Lee a *
a Dept of Geoinformatics, University of Seoul, 163, Seoulsiripdae-ro, Dongdaemun-gu Seoul, Korea - (jihee514, iplee)@uos.ac.kr
Commission III, WG III/2
KEY WORDS: Lidar, Feature extraction, Machine learning, Classification, Mobile mapping
ABSTRACT:
Generating of a highly precise map grows up with development of autonomous driving vehicles. The highly precise map includes a precision of centimetres level unlike an existing commercial map with the precision of meters level. It is important to understand road environments and make a decision for autonomous driving since a robust localization is one of the critical challenges for the autonomous driving car. The one of source data is from a Lidar because it provides highly dense point cloud data with three dimensional position, intensities and ranges from the sensor to target. In this paper, we focus on how to segment point cloud data from a Lidar on a vehicle and classify objects on the road for the highly precise map. In particular, we propose the combination with a feature descriptor and a classification algorithm in machine learning. Objects can be distinguish by geometrical features based on a surface normal of each point. To achieve correct classification using limited point cloud data sets, a Support Vector Machine algorithm in machine learning are used. Final step is to evaluate accuracies of obtained results by comparing them to reference data The results show sufficient accuracy and it will be utilized to generate a highly precise road map.
1. INTRODUCTION
Generating of a high-precision map grows up with development of autonomous driving vehicles. The high-precision map represents entire static objects within a road including their locations and shapes and it is more precise than an existing commercial map. For example, lanes and signs are distinguished in the high-precision map. For these reasons, it has been used to implement a localization of the unmanned vehicles and recognize the road environments. For example, Levinson, et al. (2007) performed vehicle localization with high accuracy by particle filter with sensory data from a GPS, an odometer and a Lidar. On the other hands, Noyer, et al. (2008) used a DGPS, other inertial sensors and a lane detection system mounted on their test car in order to automatically generate a high precision map for ADAS. Yoneda, et al. (2014) also focused on features from a laser scanner data for localization with highly precise 3D map.
One of source data is point cloud data from a Lidar for creating the high-precision map. The Lidar mounted on a vehicle has been used in mobile mapping system because the Lidar provides high-density XYZ positions, intensity, and range information. Although a raw data from a Lidar includes those information, it is visually not semantic. Thus, it is more important to process the point cloud to be cognitive data. In this regards, there have been a lot of segmentation or classification methods to process point cloud data.
In recent years, many machine learning algorithms have been accepted to researches about classification or recognition methods in point cloud data. For example, Serna and Marcotegui (2014) suggested a detection, segmentation and classification methodology of Lidar data in urban environments using mathematical morphology and supervised learning. A ground segmentation step was implemented based on elevation images. Object detection was by mathematical morphology and
* Corresponding author
classification was by Support Vector Machine (SVM). Geometrical, contextual and color features were used in the study. Weinmann, et al. (2015) focused on 2D and 3D features in point cloud data for an automatic analysis about a large-scale urban scenes. It was important to define optimal neighbours of a point for an accurate feature extraction in the study. Then, classifiers such as decision trees via bootstrap were combined for supervised classification of a huge point cloud data. Lehtomäki, et al. (2016) also proposed a machine learning based object recognition from a mobile laser scanner on a road. A main objective of the study was to compare features for point cloud data classification. The features were local descriptor histograms, spin images and general shapes.
In this paper, we propose a classification method of point cloud data from a Lidar mounted on a vehicle using a machine learning algorithm. Geometrical features are extracted from georeferenced point cloud data. Those features are described as histograms about relationships among the 3D points based on surface normal. Then, each point is classified to road surfaces or objects based on the features using SVM.
2. METHODOLOGY
2.1 Overview
Our approach for a classification of 3D point clouds is based on machine learning methods. In general, the methods include a training step and a classification or recognition step. First of all, a data for classification by machine learning is separated to training data sets and test data sets and features in the training data sets and test sets are extracted. A feature is a key information indicating characteristics of each data set. Features from the training data set are used for learning. The learning is a data training step for an analysis about distribution of the characteristics so that a decision rule to determine a boundary The International Archives of the Photogrammetry, Remote Sensing and Spatial Information Sciences, Volume XLI-B3, 2016
XXIII ISPRS Congress, 12–19 July 2016, Prague, Czech Republic
This contribution has been peer-reviewed.
among the features is generated. As a result of these processing, a model for classification is produced. The model is regarded as a classifier which includes the decision rule to distinguish patterns in the features. On the other hands, the extracted features from the test data set is a non-learning data, so they are input data of the model to be classified. Therefore, the classifier classifies the features of the test data set by the decision rule. Following Figure 1 describes those processes.
Figure 1. A general processing in machine learning
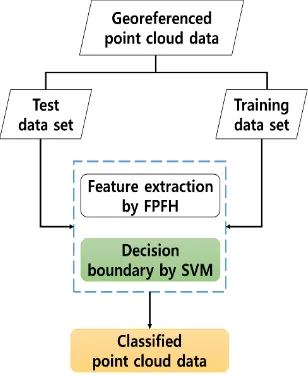
The proposed approach for the classification of 3D point cloud data is summarized in Figure 2 and includes the following two steps. Our training data set and test data set are georeferenced point cloud data. In this study, we propose a processing of point cloud data by extracting geometrical features of 3D point cloud using Fast Point Feature Histogram (FPFH) and a classification of the features by Support Vector Machines (SVM).
Figure 2. A flow chart about our approach
2.2 Feature Extraction
Various factors such as heights, roughness, gradients and surface normal vectors are used for extracting features in 3D point cloud data. For those factors, it is important to consider relationships between the points in order to recognize targets for the classification. A descriptor describes the factors as features in visual scenes including point cloud data.
Fast Point Feature Histogram (FPFH) is a kind of a descriptor based on Point Feature Histogram (PFH). PFH is a descriptor which represents a geometrical characteristic as a histogram of relationships between each point and its neighborhood (Rusu, et al., 2008; Rusu, et al., 2010). The relationship is described as
three angles, α, θ, ϕ among a local frame and normal vectors of the point and shown as Figure 3. The local frame and angles are defined as below two equations. �⃗⃗⃗⃗ and �⃗⃗⃗⃗ is surface normal vectors of point and respectively.
(1)
(2)
Figure 3. A relationships between two points in PFH
In this paper, we implemented the feature extraction step using FPFH because PFH calculates all pairs of points and their neighbourhood and its complexity is � ��2 . However, FPFH is a simplified form of PFH by reducing query points and its complexity is � �� with a lower accuracy than PFH (Rusu, et al., 2010). The value k is the number of neighbourhood points of each query point. Therefore, FPFH is faster and an amount of the computation is small to process high-density point cloud data.
2.3 Support Vector Machine (SVM)
SVM is one of the supervised learning algorithms for data classification or logistic regression. For the following reasons, SVM was selected among the various types of supervised learning. In first, data in a non-linear distribution is classified. Also, a high-precision model for prediction is generated even if the amount of data is limited. Above all, it is suitable to classify a large amount of computation about geometrical features because required calculations for the classification is simpler than other methods (Huang, et al., 2013).
A main concept of the SVM is to maximize a margin which is defined as a shortest distance from a support vector to a decision boundary. A support vector is a sample data that is closest to the decision boundary at the same time the distance to decision boundary is perpendicular to decision boundary. In Figure 4, all of the lines (a), (b), (c) can be candidates for a decision boundary to classify blue points and green points. However, an optimal decision boundary is in Figure 5 with support vectors and the largest margin. The points marked by red circles are support vector and perpendicular distances are margins.
The International Archives of the Photogrammetry, Remote Sensing and Spatial Information Sciences, Volume XLI-B3, 2016 XXIII ISPRS Congress, 12–19 July 2016, Prague, Czech Republic
This contribution has been peer-reviewed.
Figure 4. Examples of possible decision boundaries
Figure 5. A concept of support vector and margin
The margin and support vectors vary according to the decision boundary if the training data such as obtained point cloud data is fixed. To avoid an overfitting problem in a training step, margin should be maximized. In other words, SVM is a classifier which finds the decision boundary where the margin is the biggest (Bishop, 2006).
3. EXPERIMENTAL RESULTS
To apply above the methodology, 3D point cloud data as an input data was obtained in urban roadways. The input data of this experiment was acquired by a Velodyne HDL-32E Lidar mounted on the top of a car and then it was georeferenced to TM. This data also represents a road environment, so it includes signs, trees, poles, and a part of buildings as well as road surfaces. Figure 6 shows the sample of the input data used in this experiment. The experiments are implemented by using Point Cloud Library (PCL) and LIBSVM which are open source library based on C++.
Figure 6. Visualization of the georeferenced point cloud data
Filtering by voxelgrid before the feature extraction was not applied despite of high density of the input data to accurately represent the surface by using all points. However, a whole point cloud data in Figure 6 includes over 4.6 million points. Therefore, the point cloud was divided into several subsets instead of using the whole point cloud and they were also used for training data set or test data set.
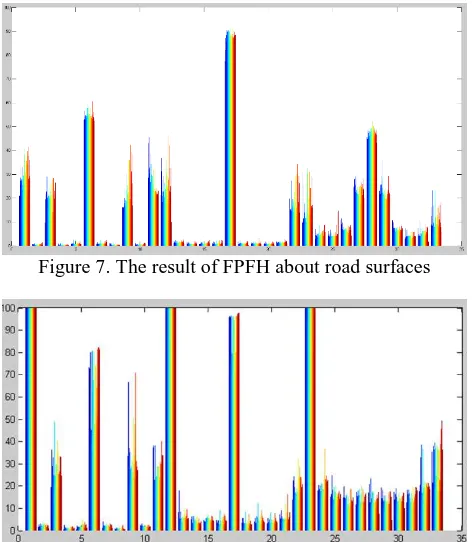
Figure 7 is a result of FPFH about road surfaces and Figure 8 is a result of FPFH about tree parts in each subset cloud. In the case of below Figure 7, the total number of points in the cloud is about 2000. Since FPFH generates a 33-dimensional vector, a horizontal axis means 33 bins and a vertical axis represents frequencies. Each color is each point, so there are 2000 bars in a bin.
Figure 7. The result of FPFH about road surfaces
Figure 8. The result of FPFH about trees in the road
In the classification step by SVM, the point cloud data in figure 6 was divided into several subsets and training data sets and test data sets were generated. Then, training data sets were separated to five groups and cross validations were performed in order to create an optimal classifier. As a result of classification about a center of road with trees, an accuracy of the cross validation was about 98% and a prediction accuracy by the model was 91%.
4. CONCLUSIOINS AND FUTURE WORKS
In this study, we implemented feature extraction steps and classification of point cloud data from a mobile Lidar using the combination with FPFH and SVM. The result of the classification was obtained with high accuracies. However, we still have the following challenges for improvements. In feature extraction step, the number of neighbour points is important because FPFH is based on surface normal vectors. Also, FPFH was applied in this paper for an efficiency but we should compare more descriptors for a fast calculation and fitting to target data. In SVM, we need to use multi-class SVM and adjust various parameters for segmentation of different objects. Then, a highly precise map can be automatically generated and used for Simultaneously Localization and Mapping (SALM).
The International Archives of the Photogrammetry, Remote Sensing and Spatial Information Sciences, Volume XLI-B3, 2016 XXIII ISPRS Congress, 12–19 July 2016, Prague, Czech Republic
This contribution has been peer-reviewed.
ACKNOWLEDGEMENTS
This research was a part of the project titled “Base Research for Building Wide Integrated Surveillance System of Marine Territory” funded by the Ministry of Oceans and Fisheries, Korea.
REFERENCES
Bishop, C., 2006. PATTERN RECOGNITION AND MACHINE LEARNING, Springer, pp. 326-327.
Huang, J., and You, S., 2013. Detecting objects in scene point cloud: A combinational approach. In: 3D Vision-3DV, International Conference on. IEEE, pp. 175-182.
Lehtomäki, M., Jaakkola, A., Hyyppä, J., Lampinen, J., Kaartinen, H., Kukko, A., Puttonen, E., and Hyyppä, H., 2016. Object Classification and Recognition From Mobile Laser Scanning Point Clouds in a Road Environment. IEEE Transactions on Geoscience and Remote Sensing, Vol. 54, pp. 1226-1239.
Levinson, J., Montemerlo, M., and Thrun, S., 2007. Map-Based Precision Vehicle Localization in Urban Environments. Robotics: Science and Systems, Vol. 4, p. 1.
Noyer, U., Schomerus, J., Mosebach, H. H., Gacnik, J., Löper, C., and Lemmer, K., 2008. Generating high precision maps for advanced guidance support. In: Intelligent Vehicles Symposium, IEEE, pp. 871-876.
Rusu, R., Blodow, N., Marton, Z., and Beetz, M., 2008. Aligning point cloud views using persistent feature histograms. In: International Conference on Intelligent Robots and Systems (IROS), Nice, France, pp. 3384-3391.
Rusu, R., Blodow, N., and Beetz, M., 2010. Fast point feature histograms (fpfh) for 3d registration. In: International Conference on Robotics and Automation (ICRA). Kobe, Japan, pp. 3212-3217.
Serna, A., and Marcotegui, B. 2014. Detection, segmentation and classification of 3D urban objects using mathematical morphology and supervised learning. ISPRS Journal of Photogrammetry and Remote Sensing, 93, pp. 243-255.
Weinmann, M., Urban, S., Hinz, S., Jutzi, B., and Mallet, C. 2015. Distinctive 2D and 3D features for automated large-scale scene analysis in urban areas. Computers & Graphics, 49, pp. 47-57.
Yoneda, K., Tehrani, H., Ogawa, T., Hukuyama, N., and Mita, S. Serna, 2014. Lidar scan feature for localization with highly precise 3-D map. In: Intelligent Vehicles Symposium Proceedings, IEEE, pp. 1345-1350.
The International Archives of the Photogrammetry, Remote Sensing and Spatial Information Sciences, Volume XLI-B3, 2016 XXIII ISPRS Congress, 12–19 July 2016, Prague, Czech Republic
This contribution has been peer-reviewed.