Time-dependent adsorption in near coastal
marine sediments: a two-step model
Anne M. Hansen
a& James O. Leckie
b aInstituto Mexicano de Tecnologı´a del Agua, Paseo Cuauhna´huac 8532, 62550 Jiutepec, Mor., Mexico b
Environmental Engineering and Science, Department of Civil Engineering, Stanford University, Stanford, CA 94305, USA
(Accepted 23 September 1996)
Many important physical and chemical processes occur at phase boundaries. The role of surface phenomena is frequently underestimated or overlooked although surfaces play a significant role in many natural science disciplines. Experimental data from the literature indicate that in adsorption from solution, most of the adsorbates move to the adsorbent surface in a relatively short time period. Actual adsorption equilibrium, however, may take longer to establish. In this study time variable parametric experiments were performed with Co and a suspended marine sediment sample. Two different time dependencies were observed: a rapid step that reached equilibrium in 5–10 days, while a slower step continued for more than 100 days. Observed behavior was simulated with a time-dependent model that differentiates the slow and fast steps. The fast step was considered to be due to diffusion of the adsorbate to the external and macropore surface of the adsorbent and exchange at surface sites, while the slow step was considered as diffusion of adsorbate into the adsorbent micropore capillaries where adsorptive binding occurs.q1998 Elsevier Science Limited. All rights reserved.
Key words: time dependent adsorption, two-step model, cobalt, marine sediments.
NOMENCLATURE
r radius of the dissolved species rp radius of the pore
D diffusion coefficient of dissolved species in small pores
D0 diffusion coefficient in bulk solution
A specific surface area of the solid (m2/g) W suspended solid concentration (g/l)
[Me] bulk dissolved metal ion concentration (mol/l) [Me]s interfacial metal ion concentration (mol/l)
[Me]eq equilibrium metal ion concentration (mol/l)
[Me]tot total metal ion concentration (mol/l)
[SOH] concentration of free surface adsorption sites (mol/l)
[SOMe] concentration of occupied surface adsorption sites (mol/l)
Stot total concentration of surface sites (mol/l)
[H] proton concentration (mol/l)
ka adsorption velocity constant (l/mol-day)
kd desorption velocity constant (l/mol-day)
KA adsorption equilibrium constant (unitless)
r1 transfer velocity of metal ion to the external and
macroporous surface (mol/g-day)
rads adsorption velocity (mol/l-day)
rdes desorption velocity (mol/l-day)
r2 net adsorption velocity (mol/l-day)
km external mass transfer coefficient (mm/day)
ki internal mass transfer coefficient (mm/day)
K01 mass transfer adsorption coefficient for the fast
step (per day)
K02 mass transfer adsorption coefficient for the slow
step (per day)
Ae specific external surface area (m2/g)
Ai specific internal surface area (m2/g)
D1 pre-exponential factor corresponding to fast
adsorption step (mol/l)
D2 pre-exponential factor corresponding to slow
adsorption step (mol/l)
1 INTRODUCTION
Major components of oxidized sediments include hydrous oxides of Fe, Al and Mn, aluminosilicate minerals, carbonate minerals, and detrital organic matter. Sediment particles occur most commonly as complex aggregates
Advances in Water Resources 21 (1998) 523–531 q1998 Elsevier Science Ltd All rights reserved. Printed in Great Britain 0309-1708/98/$19.00 + 0.00
PII: S 0 3 0 9 - 1 7 0 8 ( 9 7 ) 0 0 0 3 9 - 0
with organic and inorganic coatings that strongly influence the availability of mineral components to metal ions.11,15
The rate of adsorption of dissolved trace metal ions on sediment particles depends on many factors. Of primary importance are: size and structure of the adsorbates, com-position of the solution, stoichiometry of the surface reac-tions, and characteristics of the adsorbent porosity. Every adsorption process has at least two successive steps: (1) diffusion transport of the adsorbate from the bulk phase to the adsorbent surface, and (2) attachment or bond formation on the adsorbent surface.
The first step depends on the characteristics of the solution and adsorbate and is controlled by the laws of diffusion. Pouchly and Erdo¨s,17 when considering the kinetics of adsorption from solution, concluded that two mass transport processes were involved: (a) diffusion of the adsorbate to the external surface of the adsorbent (external diffusion), and (b) diffusion of the adsorbate into the adsorbent pores and capillaries (internal diffusion).
Chemical bond formation is itself, when attachment sites are unobstructed, typically so rapid that it is difficult to determine its characteristics.9
Intraparticle pores are usually classified according to size in the manner originally proposed by Dubinin.6 Pores having diameters less than 2 nm are termed micropores, those between 2 and 50 nm, mesopores, and those greater than 50 nm, macropores. Meso- and micropores can be estimated by gas adsorption methods, while macropores cannot be differentiated from the external surface by gas adsorption.6
The linear dimensions of ions and simple organic molecules in water are measurable in nanometers to tenths of nanometers (10¹10–10¹9m). Linear dimensions of interstices between particles in sediments, may be thought of as being of the same order of magnitude as the particle dimensions: micrometers (10¹6–10¹5m) for fine-grained clayey sediments while internal pores may typically be in the range from 10¹9 to 10¹8m. Compared to these distances, the dimensions of dissolved species are about 10¹4of the interstices and 10¹1of the intraparticle pores. For intraparticle pores however, as pores become smaller, diffusion of dissolved species is retarded by a combination of geometric and hydrodynamic effects (hindrance by pore walls through an increased drag force). An additional limitation on transport is the electroneutrality constraint. Because adsorption on oxide surfaces either produces protons (cation adsorption) or consumes protons (anion adsorption) the result is a coupled diffusion process with ions moving in opposite directions.
Several models have been presented in the literature to describe the kinetics of organic pollutant sorption to sedi-ments or soil. Some researchers have assumed one fraction of the sorbent has equilibrium sites and the other fraction of sites are rate-limited and sorption kinetics may be described by mass transfer.2,5,18These models, however, are based on the Freundlich isotherm representation of the actual sorption phenomenon. Other studies have used a diffusion coefficient
and a tortuosity factor based on particle size,19,20being the description of sorption based on empirical weight to weight based partitioning coefficients. More recently, Connaughton et al.3 have described the release of naphthalene from contaminated soils by assuming a continuum of mass transfer coefficients that follow a gamma distribution. None of these studies intended to describe variations in the sorption behavior of inorganic ionic species as a function of solution chemistry variations as would be expected in a near-coastal marine environment being influenced by tide and seasonally varying river inputs.
The objective of the present work was to develop a methodology to describe the sorption of ionic species on a natural sediment suspended in different electrolytes. This method should be able to describe the effect of variations in major electrolyte anion and cation concentrations, on the sorption of trace ionic species. Equilibrium as well as time-dependent situations should be accounted for to describe the sorption phenomenon at different times of contact between solute and adsorbent.
2 THE TIME-DEPENDENT MODEL
Most studies of adsorption at solid/solution interfaces reported in the literature consider equilibrium conditions. Often, the adsorption processes show two-step time depen-dencies, an initial fast step followed by a slower long-term process. The long-term process may take from a few days to several months to reach equilibrium, depending on the nature of the solid phase. Lo and Leckie13 suggested that the slow process may be due to solid state diffusion and/or diffusion in micropores. This last mechanism can be dominant for porous adsorbents. Given the typically fast bond formation step,9 external mass transport (surface-film diffusion) and internal mass transport (pore diffusion) combined with coupled diffusion may be the processes limiting overall adsorption velocities.
Lo et al.14 developed a two-step model to describe the incorporation of heavy metals in waste activated sludge, based on a model of mass transfer and adsorption. This two-step phenomenon was similar to the behavior found for the adsorption of metals at porous oxide/solution inter-faces.13In this study, a two-step model was used to describe the mass transfer process and obtain the mass transfer coefficients corresponding to the fast and slow step of Co(II) adsorption on complex coastal marine sediments. Stoichiometric reactions describe the formation of surface complexes.
In a perfectly well mixed system, the mass transfer due to film diffusion can be expressed in the following way:
r1¼ ¹ 1 W
d[Me]
dt ¼kmAe([Me]¹[Me]s) (1)
where r1is the transfer velocity of metal ion to the surface
plane and macropore volume (mol/g-day); km, the external
area of the solid (m2/g); W, the amount of suspended solid (g/l); and [Me] and [Me]sare the dissolved and interfacial
metal ion concentrations (mol/l), respectively. Charges on the ions have been omitted to maintain simplicity. Here we will develop the mass transfer equations for the two-step reaction using the surface complexation model (SCM) format for the adsorption reaction.
The reaction stoichiometry for adsorption of the metal ion at the sediment/solution interface can be represented as:
SOHþMe¼SOMeþH (2)
and the mass action expression is:
KA¼
ka
kd
¼[SOMe][H]
[SOH][Me] (3)
where SOH represents the adsorption sites at the surface; Me the aqueous metal ion; SOMe the adsorbed metal ion; H the proton; kathe adsorption velocity constant (l/mol-day);
kdthe desorption velocity constant (l/mol-day); and KAis
the adsorption equilibrium constant. The site mass balance requirement is
Stot¼[SOH]þ[SOMe] (4)
where Stot is the total concentration of sites available for
adsorption (mol/l), and the adsorption and desorption velocities (mol/l-day) can be expressed as:
rads¼ka[Me]s(Stot¹[SOMe]) (5)
rdes¼kd[SOMe][H] (6)
respectively.
The net velocity at the film boundary (including macropores), r2 (mol/l-day), can be expressed in the
following way:
When film and macropore diffusion, and mass transfer are both controlling processes, and no net accumulation in the film boundary occurs (steady-state conditions at the film boundary) then
r2,0 (8)
Since
[SOMe]¼[Me]tot¹[Me] (9)
where [Me]tot is the total metal ion concentration, the
interfacial metal ion concentration can be calculated as
[Me]s¼
By substituting eqn (10) into eqn (1), the rate of change in
the bulk solution metal ion concentration is
d[Me]
where [Me]eq is the equilibrium metal ion concentration.
Now Stotcan be calculated from eqn (10) under equilibrium
conditions:
By substitution of eqn (14) into eqn (11) d[Me]
The numerical value of log KAfor the equilibrium Co
sedi-ment reactions with a proton stoichiometry of ¹2 has been estimated by Hansen et al.8to be ¹10.260.3. Therefore it is reasonable to assume that
KA[Me][Me]eqp[Me]tot[H] (16)
Now eqn (15) can be simplified as follows: d[Me]
Integrating eqn (18) from [Me]totto [Me], yields
[Me]¼D exp(¹K0t)þ[Me]eq (20)
time-dependent results, the data can be separated into two parts using a separation technique, and integrated the result is shown as eqn (21).
During the fast step both the external and the internal mass transport processes occur. For that reason, kmas well
as ki (the internal mass transfer coefficient) must be
included in the K0) value. The slow step is exclusively
due to internal mass transport,14and under these conditions K0 includes the ki value. Now, the solution metal
concentration can be expressed as follows:
[Me]¼D1exp(¹K01t)þD2 exp(¹K02t)þ[Me]eq
where K01 and K02 (per day) are the mass transfer
adsorption coefficients of the rapid and slow stages; Ae
and Ai represent the specific external and internal surface areas (m2/g), respectively, where
A¼AeþAi (24)
and D1 and D2 (mol/l) are the pre-exponential factors
corresponding to the fast and the slow adsorption steps, respectively. Physically, these parameters were calculated from the y-axis intercept of the time-dependent adsorption curves for the fast and slow steps, respectively. [Me]eqwas
calculated from the equilibrium surface reaction constant found by Hansen et al.8for the adsorption of Co(II) on a Laguna Verde sediment sample.
3 EXPERIMENTAL
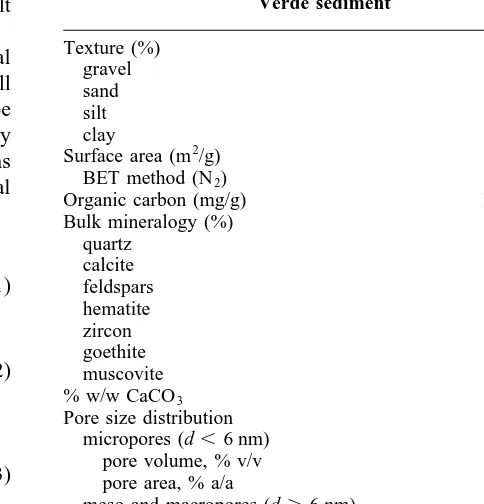
A marine sediment sample was collected in the near-shore region of the Laguna Verde Nuclear Power Plant, Veracruz, Mexico. The sediment was characterized to determine the physical, chemical and mineralogical properties (Table 1). In a split sample, calcite was eliminated by adding dilute hydrochloric acid and the acidity of the solution was con-stantly monitored to avoid fluctuations below pH 5.5. The calcite content was estimated as the weight difference before and after the acid digestion.
Bulk mineralogy was analysed by X-ray diffraction and by optical microscopy. Organic carbon content was determined on five replicate sub-samples of each sediment, following persulfate oxidation in an autoclave at 1308C for 4 h. Inorganic carbon was removed prior to autoclaving by purging the persulfate-treated solution with a carbonate-free inert gas. The organic carbon content was determined on a Dohrman carbon analyser.
Nitrogen gas adsorption and the BET isotherm1 were
used to characterize the porous nature and the specific surface area of the sediment sample. A BET surface area and pore size distribution analyser model Digisorb 2500 (Micromeritics) was employed on samples previously degassed at 1408C for 24 h. The isotherms were obtained until the N2(g) pressure reached 590 mmHg (the saturation
pressure of N2 (g) at the experimental temperature was
595.6 mmHg). The volume versus pressure data were analysed using the equation described by Gregg and Sing,7and the computational procedure of Mackay.16 The pore size distribution was analysed, using the desorption isotherm obtained by reduction of the pressure to less than 50 mmHg. The adsorption and desorption isotherms joined at N2(g) pressure of 195 mmHg.
The partitioning of Co between sediment and water was determined using a radiochemical tracer (Co-57) and an isotopic dilution technique.4 Weighted sediment sub-samples were suspended in 6.3 ml aliquots of electrolyte in polypropylene reaction vessels at 25 6 18C until the suspension pH reached a constant value. A previous experiment indicated that equilibration was complete within a week. Aliquots (0.02 ml) of 3.15 3 10¹4M cobalt (II) with traces of cobalt-57 were added. At different time intervals, pH was measured and phases were separated by centrifugation at 4000 rpm for 15 min. The effectiveness of this separation was verified by comparison with filtration using 0.45mm membrane filters.
Supernatant aliquots were transferred to counting vials and liquid as well as mixed fractions were analysed for cobalt-57 gamma activity on a Packard A5530 scintillation counter with a 3 inch NaI(Tl) well crystal. Each sample was measured to 10 000 decays to obtain counting errors of less Table 1. Physical and chemical characteristics of Laguna
Verde sediment
BET method (N2) 5.80
Organic carbon (mg/g) 1.960.2
Bulk mineralogy (%)
meso and macropores (d.6 nm)
pore volume, % v/v 80
than 1%. Exceptionally, when activities were low, the counting was stopped after 10 min, and the counting error was incorporated into measurement error calculations.
The fractions of cobalt removed from solution were calculated by comparing supernatant (liquid) activities with total activities. The fractions of adsorbed metal f, were calculated from:
f¼1¹(Nl¹Nb)=(Ntot¹2Nb) (25)
where N is the gamma activity. Subscripts l, tot and b denote supernatant, total, and background activities, respectively. Mass balances were performed on each experiment to assure that no loss in radioactivity occurred by adsorption on reaction vessels or by otherwise uncontrolled experimental errors.
All chemicals used were analytical grade and the solutions were prepared with double distilled deionized water. The glassware was cleaned by immersion in dilute nitric acid for at least three days and subsequent repeated washing with deionized water. Reagent blanks were run to assure adequate cleansing procedures.
4 RESULTS AND DISCUSSION
The Laguna Verde sediment sample characteristics are presented in Table 1. The sample was composed of the following minerals: quartz, calcite, hematite, zircon, K-feldspar, goethite, and muscovite.8This sediment had a low specific surface area and was mainly composed of badly classified, fine sand, very asymmetrical towards course sizes and extremely leptocurtical. The hysteresis of the gas adsorption/desorption isotherm (BET analysis) indicated that the pores behaved as though cylindrical with exterior connections. The pores showed a bimodal distribution with diameters around 2–3 and 10–40 nm (Fig. 1). The specific external and internal surface areas were calculated using the pore size distribution data, taking as a limit the pores of 6 nm, where a valley in the pore size bimodal distribution was found (Fig. 1). The micropores (d,6 nm) represented about 20% of the pore volume and 60% of the surface area (Fig. 2). The meso- and macropores (d.6 nm) accounted for 80% of pore volume and 40% of pore surface area. Fig. 1. Pore size distribution of Laguna Verde sediment sample.
BET analysis of nitrogen gas adsorption and desorption isotherms.
Fig. 2. Cumulative pore area and volume as a function of pore size
of Laguna Verde sediment sample.
Fig. 3. Incorporation of Co(II) by Laguna Verde sediment sample
in seawater, pCo ¼ 6, pH¼ 8.3. The data points represent the experimental data and the solid lines represent the modelling
results.
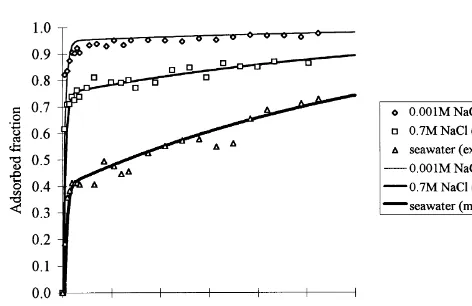
Fig. 4. Incorporation of Co(II) by Laguna Verde sediment without
calcite in seawater, pCo¼6, pH¼8.25. The data points represent the experimental data and the solid lines represent the modelling
Adsorption experiments were performed with sediment samples suspended in different background electrolytes. Experimental results of the Co interactions with various amounts of marine sediment suspended in seawater are illustrated as data points in Fig. 3. The solid lines represent the modelling results. Uptake of Co continued throughout the experiment. Sediment without calcite also showed an increasing removal of Co with time (Fig. 4), eliminating the hypothesis that time dependency could be due to the formation of Co–calcite solid solution only. Both solids with and without calcite showed a two-step adsorption behavior: a fast step that lasted between 5 and 11 days and a slow step that continued throughout the experiment (.100 days). The first step is too slow to be accounted for by simple diffusion to particle external surface and therefore must also include mass transport into the macro- and mesopores of the particles. This is consistent with the bimodal distribution of pore volume and pore surface shown in Figs 1 and 2.
The effects of electrolyte type and concentration were studied with calcite-free sediment suspended in different electrolytes. The results indicate that Co sorption is reduced at higher ionic strength (0.001 versus 0.7 M NaCl in Fig. 5). This phenomenon may be explained by the reduction in free aqueous Co2þsince as much as 15% of Co is complexed as chloro-complexes in seawater. Furthermore, Co formed outer sphere complexes with the functional groups at the sediment surface.8As investigated by Hayes and Leckie,9 ionic strength strongly affects the position of pH-dependent adsorption edges of trace cations forming outer sphere com-plexes. This is due to the rather weak character of this type of bond and the competition with major electrolyte cations for the same binding sites. However, dissolved ions in sea-water affected the adsorption of Co to a much greater extent, decreasing further the adsorption in this medium as compared to the solution of NaCl at the same ionic strength (i.e. seawater versus 0.7 M NaCl). SCM modelling of Co sorption in the presence of Mg8 indicated that this major
cation reduced the sorption of Co by several tenths of a percent, due to competition for the same adsorption sites at the sediment surface.
The steepest line of the modelling results corresponds to the fast reaction where the Co is adsorbing to the external surface and inside macro- and mesopores. In this step, a combination of external and internal mass transport is believed to be controlling the time depen-dency (the first term of eqn (21)). The second step of the adsorption curve represents the mass transport in intraparticle micropores only. This step corresponds to the second term of eqn (21), and is exclusively internal mass transport limited.
Mass transport limitations in the internal pore structure, specially the micropores, can arise from several simulta-neous or sequential processes: (1) coupled counter diffusion within small pores (rate limited by slowest diffusing species); (2) surface diffusion in the smallest pores where fluid properties and electrical double layer properties are highly altered; (3) lability of adsorbed metal, limited by the slowness of the desorption step; and (4) the possible formation of outer sphere complex intermediates which react to form inner sphere complexes at a slower rate.
An additional time-dependent process is possible and cannot be distinguished from strict mass transport limitations. The possibility exists, in principle, for mineral assemblages, that adsorption kinetics are faster for thermo-dynamically weaker binding surfaces and slower for thermodynamically more favorable binding surface sites. In such a case the initial reactions would form essentially thermodynamically metastable surface complexes and the system would slowly relax (readjust) to a more stable thermodynamic configuration with time. The resultant macroscopic observation would be likely to appear similar to the fast step observed in these experiments.
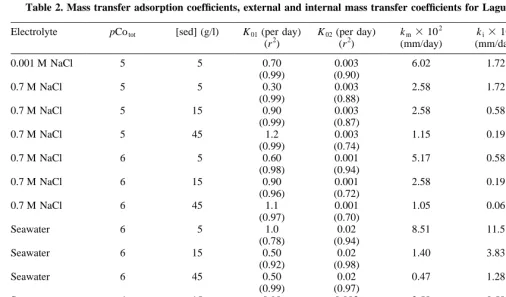
The mass transfer coefficients for the fast step, K01, and
for the slow step, K02, for the Co interactions with Laguna
Verde sediment and calcite-free sediment, are shown in Tables 2 and 3. In sodium chloride solutions, the fast step mass transfer coefficients, K01, exceeded those of the slow
step, K02, by two to three orders of magnitude. This relative
difference in magnitude between K01and K02was reduced to
one to two orders of magnitude in seawater. Under identical experimental conditions, the ratio km/ki was lower in
sediment without calcite as compared to whole sediment when suspended in NaCl and dilute seawater. In seawater, however, km/kiwas higher by a factor of two for sediment
without calcite.
Values of km values in seawater were generally lower
than in 0.7 M NaCl for both Laguna Verde sediment and calcite-free sub-samples. An exception was found at low solid/solution ratio where kmvalues were higher for whole
sediment and identical for calcite-free sub-samples. ki, on the other hand, showed larger values in seawater than in 0.7 M NaCl solutions. By applying triple layer modelling,8 a reduction was found of adsorbed Co from 95 to 65% in a system of similar composition at pH 8 due to the Fig. 5. Adsorption of Co(II) by Laguna Verde sediment without
calcite in different electrolytes, pSOH¼3.4, pCo¼6, pH¼8. The data points represent the experimental data and the solid lines
competition with Mg at concentrations found in seawater. The experimental results of this work agrees with the results of the equilibrium modelling,8 although sorption increased with time. This result suggests that an appro-priate modelling of the Co sorption in Laguna Verde sedi-ment should include both time-dependent and equilibrium considerations.
Lo and Leckie13suggested that, under equal physical and chemical conditions, the mass transfer coefficients should be identical for different solid/solution ratios. Our results suggest that the internal as well as the external mass transfer coefficients decrease as the sediment/solution ratio increases (Tables 2 and 3). A possible explanation for the change in external mass transfer coefficients with increasing solid/solution ratios, is an increasing tendency for particle–particle interaction at higher solid concentration. It is currently not understood why the internal mass transfer coefficients decrease with an increase in the solid/solution ratio.
Honeyman10 studied the effect of solid phase con-centration on the adsorption in mono-mineral systems. He found that adsorption at high adsorbate concentrations differed from that at lower sediment contents, and attributed this observation to an increase in particle interactions at high solid/solution ratios. Kent et al.12 explained this phenom-enon by the physical interactions between the electrical double layers of adjacent particles, coagulation phenomena, partial dissolution, adsorption and/or precipitation of one adsorbent on the other.
5 CONCLUSIONS
The time-dependent adsorption of Co in a Laguna Verde near-coastal marine sediment sample followed a two-step process. A two-step kinetic model which related adsorption reactions to mass transfer processes was developed and applied to model the experimentally observed behavior. The fast step is much slower than that found both for non-porous adsorbents and for single phase porous adsorbents.13 The extended duration of the fast step is likely to be due to a combination of several sequential steps with the slowest process being limiting. Possible limiting processes include both diffusion in macro- and mesopores and reaction limitation in adsorption/desorption within the pore structure. The second slow step extends over several months and is likely to be the result of the limited internal mass transport into micro- and mesopores and adsorption sites with otherwise difficult access.
The internal mass transport extends the adsorption process in time as well as in magnitude, because the amount of accessible internal surface area increases with reaction time. The degree of competition of ions in the background electrolyte for available surface sites depends upon the strength of the chemical bonds formed during adsorption.
A two-step time-dependent model was developed and adapted to describe the time-dependent adsorption behavior of the Co species on a porous and mineralogically complex natural marine sediment sample. Internal and external mass Table 2. Mass transfer adsorption coefficients, external and internal mass transfer coefficients for Laguna Verde sediment
Electrolyte pCotot [sed] (g/l) K01(per day)
(r2)
K02(per day) (r2)
km3102 (mm/day)
ki3104 (mm/day)
km/ki
0.001 M NaCl 5 5 0.70 0.003 6.02 1.72 350
(0.99) (0.90)
0.7 M NaCl 5 5 0.30 0.003 2.58 1.72 150
(0.99) (0.88)
0.7 M NaCl 5 15 0.90 0.003 2.58 0.58 445
(0.99) (0.87)
0.7 M NaCl 5 45 1.2 0.003 1.15 0.19 605
(0.99) (0.74)
0.7 M NaCl 6 5 0.60 0.001 5.17 0.58 891
(0.98) (0.94)
0.7 M NaCl 6 15 0.90 0.001 2.58 0.19 1358
(0.96) (0.72)
0.7 M NaCl 6 45 1.1 0.001 1.05 0.06 1750
(0.97) (0.70)
Seawater 6 5 1.0 0.02 8.51 11.5 74
(0.78) (0.94)
Seawater 6 15 0.50 0.02 1.40 3.83 37
(0.92) (0.98)
Seawater 6 45 0.50 0.02 0.47 1.28 37
(0.99) (0.97)
Seawater 6 15 0.90 0.003 2.58 0.58 445
14.3% (0.91) (0.91)
Seawater 6 15 0.75 0.003 2.15 0.58 371
28.6% (0.94) (0.92)
Seawater 6 15 0.70 0.003 2.01 0.58 347
transfer coefficients were calculated and variations in these were discussed leading to the following conclusions:
1. Ionic strength reduced the extent of initial adsorption of Co in Laguna Verde sediment. In calcite-free sediment, km values were identical at high and low
ionic strength of the background electrolyte, suggest-ing that the presence of calcite partially influenced the sorption behavior.
2. The external mass transfer coefficients for Co adsorption were of the same order of magnitude for whole sediment and calcite-free sub-sample at equal solid/solution ratios when suspended both in 0.7 M NaCl and in seawater. Values of ki, on the other
hand, were approximately 20 times lower for whole sediment suspended in seawater as compared to 0.7 M NaCl, while kifor the calcite-free sediment was of the
same order of magnitude for both types of electrolyte. The slow adsorption behavior is probably due to a combination of internal mass transport limitations in addition to solid solution formation with calcite for whole sediment samples.
3. In sodium chloride solutions, the fast step mass transfer coefficients, km, exceeded those of the slow step, ki, by two to three orders of magnitude. This
ratio decreased to one to two orders of magnitude in seawater. This difference indicates competition of
major cations in seawater for adsorption sites at the sediment surface, and major anions for the solution complexes of Co. Both types of competition may have a retarding effect on the overall Co sorption behavior.
4. km/kivalues in seawater were very similar for whole
sediment and calcite-free samples. By dilution of sea-water, the difference in km/ki values increased. This
effect was attributed to the competition of dissolved salt constituents in the seawater.
5. The decrease in external mass transfer coefficients with increasing sediment/solution ratio was possibly due to increasing particle–particle interactions at higher solid/solution ratios.
6. Values for km/kiwere higher by a factor of 4–6 for
whole sediment as compared to calcite-free sediment when suspended in 0.7 M NaCl. In seawater as back-ground electrolyte, this relationship was in the same order of magnitude for both sediment types. This result suggests that the presence of calcite appears to have a stronger influence in relatively simple systems. At higher complexity of the background electrolyte, the composition of the liquid phase is the controlling factor.
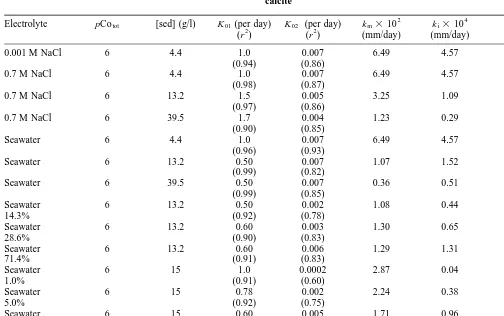
By combining triple layer surface complexation theory with adsorption time dependencies the overall sorption Table 3. Mass transfer adsorption coefficients, external and internal mass transfer coefficients for Laguna Verde sediment without
calcite
Electrolyte pCotot [sed] (g/l) K01(per day)
(r2)
K02 (per day) (r2)
km3102 (mm/day)
ki3104 (mm/day)
km/ki
0.001 M NaCl 6 4.4 1.0 0.007 6.49 4.57 142
(0.94) (0.86)
0.7 M NaCl 6 4.4 1.0 0.007 6.49 4.57 142
(0.98) (0.87)
0.7 M NaCl 6 13.2 1.5 0.005 3.25 1.09 298
(0.97) (0.86)
0.7 M NaCl 6 39.5 1.7 0.004 1.23 0.29 424
(0.90) (0.85)
Seawater 6 4.4 1.0 0.007 6.49 4.57 142
(0.96) (0.93)
Seawater 6 13.2 0.50 0.007 1.07 1.52 70
(0.99) (0.82)
Seawater 6 39.5 0.50 0.007 0.36 0.51 71
(0.99) (0.85)
Seawater 6 13.2 0.50 0.002 1.08 0.44 245
14.3% (0.92) (0.78)
Seawater 6 13.2 0.60 0.003 1.30 0.65 200
28.6% (0.90) (0.83)
Seawater 6 13.2 0.60 0.006 1.29 1.31 98
71.4% (0.91) (0.83)
Seawater 6 15 1.0 0.0002 2.87 0.04 100
1.0% (0.91) (0.60)
Seawater 6 15 0.78 0.002 2.24 0.38 250
5.0% (0.92) (0.75)
Seawater 6 15 0.60 0.005 1.71 0.96 148
10.0% (0.92) (0.69)
Seawater 6 15 0.50 0.0055 1.43 1.05 136
behavior can be explained as a function of solution chemistry and solid phase characteristics.
ACKNOWLEDGEMENTS
The authors gratefully acknowledge the financial support given by the International Atomic Energy Agency (Contract No. 301-K4-Mex-3491) for the research carried out at the Instituto de Ciencias Nucleares at the UNAM; to the Instituto de Investigaciones Ele´ctricas for additional support given to A.M.H. and to the Comisio´n Federal de Electrici-dad for the help during the sampling. The authors also thank the following: G. Hopkins for the TOC determinations; G. Izquierdo for the XRD analysis; B. Balaguer and K. Gruebel for the surface area determination; R. Oliver for preparation and analysis of the thin sections; L. Conroy and C. Arzate for the pore size distribution determinations; J. L. Reza and A. Galva´n for the experimental assistance in the laboratory.
REFERENCES
1. Brunauer, S., Emmett, P. H. and Teller, E. Adsorption of gases in multimolecular layers. J. Phys. Chem., 1938, 60, 309–319.
2. Cameron, D. A. and Klute, A. Convective-dispersive solute transport with a combined equilibrium and kinetic adsorption model. Water Resources Res., 1977, 13, 183–188. 3. Connaughton, D. F., Stedinger, J. R., Lion, L. W. and Shuler, M. L. Description of time-varying desorption kinetics: release of naphtalene from contaminated soils. Environ.
Sci. Technol., 1993, 27, 2397–2403.
4. Davis, J. A. and Leckie, J. O. Surface ionization and com-plexation at the oxide/water interface: II. Surface properties of amorphous iron oxyhydroxide and adsorption of metal ions. J. Colloid Interface Sci., 1978, 67, 90–107.
5. De Camargo, O. A., Biggar, J. W. and Nielsen, D. R. Transport of inorganic phosphorous in an alfisol. Soil Sci.
Soc. Am. J., 1979, 43, 884–890.
6. Gregg, S. J. & Sing, K. S. W., Surface and Colloid Science, Vol. 9, ed. E. Matijevec. Wiley Interscience, New York, 1976, p. 231.
7. Gregg, S. J. & Sing K. S. W., Adsorption, Surface Area and
Porosity. Academic Press, London, 1982.
8. Hansen, A. M., Leckie, J. O. and Mee, L. D. Cobalt(II) interactions with near coastal marine sediments. Environ.
Geol. Water Sci., 1992, 19(2), 97–111.
9. Hayes, K. F. & Leckie, J. O., Mechanism of lead ion adsorption at the goethite/water interface. In Geochemical
Processes at Mineral Surfaces, ed. J. A. Davis &
K. F. Hayes. ACS Symposium Series No. 323, Chap. 7, American Chemical Society, Washington DC, 1987. 10. Honeyman, B. D., Cation and anion adsorption at the oxide/
solution interface in systems containing binary mixtures of adsorbents: an investigation of the concept of adsorptive additivity. PhD dissertation, Stanford University, Stanford, CA, 1984.
11. Jenne, E. A., Trace element sorption by sediments and soils—sites and processes. In Symposium on Molybdenium
in the Environment, ed. W. Chappel & K. M. Petersen.
M. Dekker Inc., New York, 1977, pp. 425–553.
12. Kent, D. B., Tripathi, V. J., Ball, N. B. and Leckie, J. O., Surface-complexation modeling of radionuclide adsorption in sub-surface environments, NUREG/CR-4807, (SAND86-7175), U.S. Nuclear Regulatory Commission, 1988. 13. Lo, K. S.-L. and Leckie, J. O., Physical-chemical
character-ization of porous amorphous aluminium oxide. Proc. 2nd
IAWPRC Asian Conf. on Water Pollution Control, 1992,
pp. 555-562.
14. Lo, K. S.-L., Lin, C.-Y. and Leckie, J. O. The mass transfer—adsorption model of metal ions uptake by waste activated sludge. Proc. Nat. Sci. Counc. ROC(A), 1989,
13(3), 109–119.
15. Luoma, S. M. and Davis, J. A. Requirements for modelling trace metal partitioning in oxidized estuarine sediments. Mar.
Chem., 1983, 12, 159–181.
16. Mackay, D. M., Pyrolysis and gasification of lignocellulosic solid wastes for activated carbon production. PhD disserta-tion, Stanford University, Stanford, CA, 1981.
17. Pouchly, J. and Erdo¨s, E. Kinetics of adsorption from solutions. (I) Simultaneous external and internal diffusion.
Chem. Listy, 1958, 52, 874–886.
18. Rao, P. S. C., Davidson, J. M., Jessup, R. E. and Selim, H. M.
Evaluation of conceptual models for describing
nonequilibrium adsorption–desorption of pesticides during steady-flow in soils. Soil Sci. Soc. Am. J., 1979, 43, 22–28.
19. Wu, S. C. and Gschwend, P. M. Sorption kinetics of hydrophobic organic compounds to natural sediments and soils. Environ. Sci. Technol., 1986, 20, 717–725. 20. Wu, S. C. and Gschwend, P. M. Numerical modeling of
sorption kinetics of organic compounds to soil and sediment particles. Water Resour. Res., 1988, 24,