175
ANALYSIS OF SEASONAL AND ANNUAL CHANGE OF VEGETATION IN THE
INDIAN THAR DESERT USING MODIS DATA
Priyabrata Santra a and Abhishek Chkraborty b a
Central Arid Zone Research Institute, Jodhpur, India - [email protected] b
National Remote Sensing Centre, Hyderabad, India - [email protected]
KEY WORDS: Arid western India, Biomass, Jaisalmer, NDVI, 16-day composite MODIS products (MOD13Q1)
ABSTRACT:
The western part of India, specifically the dry region, will play an important role in determining the Indian monsoon and even global climate patterns. Drastically change in land use pattern of the region has been observed during last few decades. In this paper, an effort was made to track the seasonal as well as annual changes of vegetation pattern in Jaisalmer district using MODIS normalized difference vegetation index (NDVI) products. Apart from this, ground data on vegetation were also collected under vegetation carbon pool assessment programme of ISRO-IGBP. It was found that during the hot summer month of May, the area under NDVI class 0-0.1 is reduced from 98% during 2003 to 95% during 2009 with a simultaneous increase in area under NDVI class 0.1-0.2 from 2 to 5%. During the month of September, area under NDVI class 0.2-0.3 increased from almost negligible during May to 34−39% during normal or surplus rainfall year but only to 3% during a deficit year. From the ground data on vegetation biomass, it was found that Prosopis juliflora and Acacia senegal are the most abundant trees in Jaisalmer region of the desert. The sites with NDVI value ≥ 0.2 were mostly found with Prosopis juliflora tree. Among shrubs, the most abundant species was Calotropis procera and Zizyphus numularia. From this study, it has been found that MODIS NDVI products may be used to quickly assess the vegetation changes in response to rainfall as well as due to anthroprogenic interventions in desert.
INTRODUCTION
In India, the land degradation process occurring on the hot arid western plain is very active in the context of climate change as well as anthropogenic disturbance. Mapping of desertification processes as a result of the different land uses in the region reveals that ~76 per cent of the area of western Rajasthan is affected by wind erosion, covering all major land uses, but mostly croplands and dunes/sandy areas, while water erosion has affected ~2 per cent (mostly in croplands and scrublands), salinization ~25 per cent (mostly in croplands), and vegetation degradation by ~3 per cent (especially in scrublands and forests) (Kar et al., 2009). Drastic changes in the land use pattern in arid western India has also been observed during the last few decades. For example, the area under rainfed cultivation in Jaisalmer district has increased by 332% and net irrigated area has increased from a meager value of only 110 ha to 146246 ha between 1980 and 2006 (CAZRI, 2008). All these expansion in cultivated area has been mostly at the expense of grasslands, which were mostly dominated by Lasuirus sindicus. Recent effort has been initiated to green the desert through afforestation programmes. It has been reported that vegetation dynamics of an area is closely linked with climatic variations: temperate coastal vegetation is influenced by temperature variation while tropical, subtropical and continental vegetation is best explained by precipitation variations (Los et al., 2001). In the Indian Thar desert, rainfall and vegetation cover is highly correlated. During a surplus rainfall year, grasses and annuals fully cover the desert surface. It has also been critically observed that once a good amount of rainfall occurs, there is a high probability of drought in the next year. Few recent literatures suggested that increasing the green vegetation coverage in dry areas of the world may alter the regional climatic pattern. Under such circumstances, it is anticipated that greening the desert areas may weaken the monsoon trough in northwest India and thus may disturb the normal monsoon. For this purpose, we wanted to monitor the intra-annual and
inter-annual vegetation cover changes in the Indian Thar desert and to find its relationship with rainfall.
Vegetation dynamics within a year and between the years reflects the interaction between the terrestrial bioshpere and inter- and intra-annual variations in climates and hydrological regimes (Zhang et al., 2006). Monitoring vegetation dynamics at regional to global scale through remote sensing has become popular because of synoptic coverage and repeated temporal sampling of satellite observations (Myneni et al., 1997). Vegetation indices, which provide an indication of the greenness are commonly used to monitor vegetation dynamics (Curan, 1983, Sellers, 1985), particularly the normalised difference vegetation index (NDVI) (Tucker and Sellers, 1986, Zhang et al., 2003, Sakamoto et al., 2005, Pettorelli et al., 2005, Beck et al., 2006, Bradley et al., 2007, Studer et al., 2007). The NDVI is derived from the red: near-infrared reflectance ratio [NDVI = (NIR-R)/(NIR+R), where NIR and R are the amounts of surface reflectance at near-infrared and red radiation]. The NDVI relies on the absorption of red radiation by chlorophyll and other leaf pigments, and the strong scattering of near-infrared radiation by mesophyll structure of foliage. NDVI value thus ranges from -1 to +1, where negative values corresponds to an absence of vegetation.
Most monitoring of large-scale vegetation activity is based on time-series datasets of NDVI acquired by National Oceanic and Atmospheric Administration (NOAA) Advance Very High Resolution Radiometer (AVHRR) (Goward and Prince, 1995, Myneni et al., 1997, White et al., 1997). Global NDVI data have been collected by AVHRR since 1980. Indeed, AVHRR data was the only source for seasonal and decadal analysis of vegetation dynamics till the start of 21st Century (Zhou et al., 2001). Since 2000, Moderate Resolution Imaging Spectroradiometer (MODIS) onboard NASA’s Terra and Aqua spacecraft have been providing a new era of global remote sensing data products. In particular, MODIS provides daily
ISPRS Archives XXXVIII- 8/W20; Workshop Proceedings: Earth Observation for Terrestrial Ecosystems
176 reflectance data at spatial resolutions of 250 m, 500 m, and 1 km globally with substantially improved geometric and radiometric properties relative to AVHRR data and are also atmospherically corrected and screened for clouds. Therefore, MODIS data provides an improved basis for monitoring vegetation dynamics.
2. MATERIALS AND METHOD
2.1 Study area
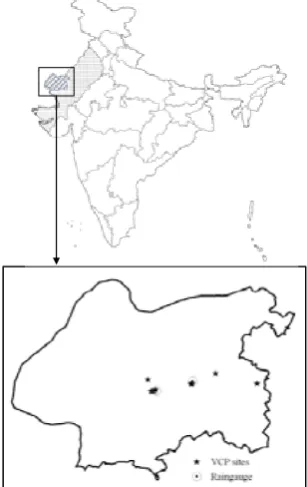
Indian Thar desert is situated between the latitudes of 24°30′ N and the longitudes of 69°30′ N. Within the territory of India the Thar forms a part of the country’s sandy hot arid zone, spread over 0.32 million sq. km area. Western Rajasthan alone constitutes (61%), while in the state of Gujarata it covers 20% area and in the state of Punjab and Haryana 9% area (Fig. 1). In this study, vegetation dynamics in Jaisalmer district was analysed, which is located at the western part of the Indian Thar desert.
Figure 1. Location of study area in the Indian Thar desert and observation points in Jaisalmer district
2.2 Data
2.2.1 MODIS data: The MODIS instrument includes seven spectral bands that are explicitly designed for land surface monitoring (Justice et al., 1997). In this study, we used 16-day composite NDVI products (MOD13Q1). Two pre-monsoon (julian day 129 and 145) and two post-monsoon (julian day 257 and 273) NDVI products with a spatial resolution of 250 m during each of the year 2003, 2006 and 2009 were downloaded from Land Processes Distributed Active Achieve Centre (LPDAAC) (ftp://e4ftl01.cr.usgs.gov/MOLT/ MOD13Q1.005). 2.2.2 Ground data on vegetation: Field data on vegetation biomass was collected from Jaisalmer district in the year 2009-2010 under Vegetation Carbon Pool (VCP) assessment project of ISRO-IGBP. A total of ten sites each of 250 m × 250 m in size were selected covering different vegetation densities according to NDVI value. The selected site was identified in the
field with the help of global positioning system (GPS) and is presented in Fig. 1. Vegetation biomass related data were collected for trees, shrubs and herbs from each site.
2.2.3 Rainfall data: Daily rainfall data collected at Jaisalmer and Chandan research station of Central Arid Zone Research Institute located at Jaisalmer district was used in the study. Location of both Jaialmer and Chandann station is depicted in Fig. 1.
2.3 Methodology
16-day composite NDVI products were downloaded for 4 different dates of 2003, 2006, and 2009. These years were selected to cover different annual rainfall situation in Jaisalmer district. Year 2003 was a normal rainfall year whereas year 2006 was a surplus year and year 2009 was a deficit year. NDVI products were processed and corresponding images of Jaisalmer district was prepared in ArcGIS through masking. Pre-monsoon (julian day 129 and 145) and post-monsoon (julian day 257 and 273) NDVI products were composited (mean value) and then reclassified in six NDVI classes: <0, 0−0.1, 0.1−0.2, 0.2−0.3, 0.3-0.4, and >0.4. Pixels under each NDVI class were counted and percentage area was computed.
3. RESULTS AND DISCUSSION
3.1 Rainfall pattern
Annual rainfall pattern of Jaisalmer and Chandan station is pre-sented in Fig. 2. Average annual rainfall at the Jaisalmer and the Chandan site was 196 and 213 mm, respectively, with less than 10 rainfall events per year, major portion of the annual rainfall occurs during June–September of the year at both Jaisalmer and Chandan. It has been critically observed that annual rainfall variation follows a cycle of 4-5 years. During 2003, 2006, and 2009 for which NDVI products are analysed in this study, total annual rainfall was 130.7, 385.7, 70.4 mm at Jaisalmer and 167.7, 291, and 81.8 mm at Chandan, respectively. Year 2003 was considered as normal rainfall, whereas year 2006 and 2009 were considered as surplus and deficit year, respectively. From Fig. 2, it is found that 2002 was a severe drought year in the re-gion with annual rainfall not greater than 30 mm at both Jaisamer and Chandan station. It is also notable that surplus rainfall during 2006 creates flood in the desert because very high intensity rainfall events occurred at Jaisalmer during the month of August (124 mm, 64.6 mm, 99.8 mm at 6th, 19th and 21st August).
Figure 2. variation of annual rainfall at Jaisalmer and Chandan station in Jaisalmer district of western Rajasthan
ISPRS Archives XXXVIII- 8/W20; Workshop Proceedings: Earth Observation for Terrestrial Ecosystems
177 3.2 Intra- and inter-annual variation of NDVI
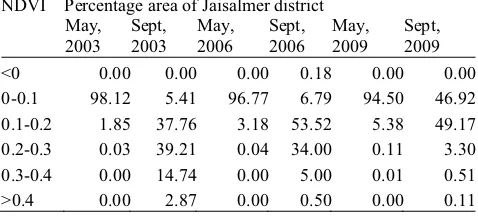
Classified NDVI maps of Jaisalmer district for the year 2003, 2006, and 2009 are presented in Fig. 3. It was found that during the hot summer month of May, the area under NDVI class 0-0.1 is reduced from 98% during 2003 to 95% during 2009 with a simultaneous increase in area under NDVI class 0.1-0.2 from 2 to 5% (Table 1). This indicates an increase in permanent vegetation in the form of trees as most of the annual herbs and shrubs mostly remains dry during hot summer months. During the month of September, area under NDVI class 0.2-0.3 increased from almost negligible during May to 34−39% during normal or surplus rainfall year but only to 3% during a deficit year.
Figure 3. Location of study area in the Indian Thar desert and observation points in Jaisalmer district
NDVI Percentage area of Jaisalmer district May,
<0 0.00 0.00 0.00 0.18 0.00 0.00
0-0.1 98.12 5.41 96.77 6.79 94.50 46.92 0.1-0.2 1.85 37.76 3.18 53.52 5.38 49.17 0.2-0.3 0.03 39.21 0.04 34.00 0.11 3.30
0.3-0.4 0.00 14.74 0.00 5.00 0.01 0.51
>0.4 0.00 2.87 0.00 0.50 0.00 0.11
Table 1. Percentage area under different NDVI classes
3.3 Vegetation type
Vegetation biomass data were collected from 10 forest sites and 4 outside forest sites of Jaisalmer district. To calculate the biomass in tree plantations, circumference at breast height (CBH) and the total height of each tree at each site were recorded (Table 2).
Overall, it was found that Prosopis juliflora and Acacia senegal are the most abundant trees in Jaisalmer region of the desert. The sites with NDVI value ≥ 0.2 were mostly found with Prosopis juliflora tree. In general, height of trees was not more than 4 m and average CBH of trees was 30-40 cm. However, big size trees of Prosopis cineraria with CBH of 142 cm and height of 9.3 m was also recorded. Among shrubs, the most
abundant species was Calotropis sp. and Zizyphus sp. In sites outside forests, significant amount of vegetation was recorded along IGNP canals and Eucalyptus block plantation at Mohangarh areas of Jaisalmer.
Tree Name Circumference at breast height (cm)
16.0-142.0 66.24 2.1-9.3 5.3 Salvadora
Table 2. Circumferences at breast height (CBH) and height of trees at Jaisalmer region of the Indian Thar desert
4. CONCLUSION
From this study, it has been found that MODIS NDVI products may be used to quickly assess the vegetation changes in response to rainfall as well as due to anthroprogenic interventions in desert. It is critically observed that annual rainfall pattern in Jaisalmer follows a natural cycle of 4-5 years. Therefore, once in every five years a severe drought year occurs in desert, and whenever occurs it brings a surplus rainfall year immediately after that. It is hypothesized that during drought years, vegetation coverage over desert remains very less, which is resulted in hot land surface and thus creates the strong monsoon trough during the succeeding year.
REFERENCES
Beck, P.S.A., Atzberger, T. C., Høgda, K.A., Johansen, B., Skidmore, A.K., Improved monitoring of vegetation dynamics at very high latitudes: A new method using MODIS NDVI. Remote Sensing of Environment, 100, pp. 321–334.
Bradley, B.A., Jacob, R.W., Hermance, J.F., Mustard, J.F., 2007. A curve fitting procedure to derive inter-annual phonologies from time series of noisy satellite NDVI data. Remote Sensing of Environment, 106, pp. 137–145.
CAZRI. 2008. Annual report of Central Arid Zone Research Institute, Jodhpur India. pp. 1-166.
Curran, P. J., 1983. Multispectral remote sensing for the estimation of green leaf area index, Philos. Trans. R. Soc., Ser. A, 309, pp. 257–270.
Goward, S. N., & Prince, S. D., 1995. Transient effects of climate on vegetation dynamics: Satellite observations. Journal of Biogeography, 22, pp. 549–563.
May 2003
ISPRS Archives XXXVIII- 8/W20; Workshop Proceedings: Earth Observation for Terrestrial Ecosystems
178 Justice, C.O., Vermote, E., Townshend, J.R.G. et al., 1997. The moderate resolution imaging spectroradiometer (MODIS): land remote sensing for global change research. IEEE Transactions on Geoscience and Remote Sensing, 36, pp. 1228–1249. Kar, A., Moharana, P.C., Raina, P., Kumar, M., Soni, M.L., Santra, P., Ajai, Arya, A.S. and Dhinwa, P.S., 2009. Desertificatiion and its control measures. In: Trends in Arid Zone Research in India. (Eds. A. Kar, B.K. Garg, M.P. Singh, S. Kathju), CAZRI, Jodhpur, India, pp. 1–47.
Los, S.O., Collatz, G.J., Bounoua, L., Sellers, P.J., Tucker, C.J., 2001. Global interannual variations in sea surface temperature and land surface vegetation, air temperature, and precipitation.
J. Climate, 14, pp.1535–1549.
Myneni, R. B., Keeling, C. D., Tucker, C. J., Asrar, G., & Nemani, R. R., 1997. Increased plant growth in the northern high latitudes from 1981– 1991. Nature, 386, pp. 698–702. Pettorelli, N., Vik, J.O., Mysterud, A., Gaillard, J.M., Tucker, C.J., Stenseth, N.C., 2005. Using the satellite-derived NDVI to assess ecological responses to environmental change. TRENDS in Ecology and Evolution, 20(9), pp. 503-509.
Sakamato, T., Masayuki Yokozawa, M., Toritani, H., Shibayama, M., Ishitsuka, N., Ohno, H., 2005. A crop phenology detection method using time-series MODIS data. Remote Sensing of Environment, 96, pp. 366–374.
Sellers, P. J., 1985. Canopy reflectance, photosynthesis, and transpiration. Int. J. Remote Sens., 6, pp. 1335– 1372.
Studer, S., Stöckli, R., Appenzeller, C., Vidale, P. L., 2007. A
comparative study of satellite and ground-based phenology. Int
J Biometeorol, 51, pp. 405–414.
Tucker, C. J., Sellers, P. J., 1986. Satellite remote sensing of primary production. International Journal of Remote Sensing, 7, pp. 1395−1416.
White, M. A., Thornton, P. E., Running, S. W., 1997. A continental phenology model for monitoring vegetation responses to interannual climatic variability. Global Biogeochem. Cycles, 11, pp. 217– 234.
Zhang, X., Friedl, M.A., Schaaf, C.B., 2006. Global vegetation phenology from Moderate Resolution Imaging Spectroradiometer (MODIS): Evaluation of global patterns and comparison with in situ measurements. Journal Of Geophysical Research, Vol. 111, G04017, doi:10.1029/2006JG000217. Zhang, X., Friedl, M.A., Schaaf, C.B., Strahler, A.H., Hodges, J.C.F., Gao, F., Reed, B.C., Huete, A., 2003. Monitoring vegetation phenology using MODIS. Remote Sensing of Environment, 84, pp. 471–475.
Zhou, L., Tucker, C. J., Kaufmann, R. K., Slayback, D., Shabanov, N. V., Myneni, R. B., 2001. Variation in northern vegetation activity inferred from satellite data of vegetation index during 1981 to 1999. J. Geophys. Res., 106(D17), pp. 20,069–20,083.
ACKNOWLEDGMENT
The authors acknowledge the IIRS, Dehradun and the funding agency of ‘Vegetation Carbon Pool Assessment’ project for financial assistance of the present study. The senior author sincerely acknowledges the support provided by the Director, Central Arid Zone Research Institute, Jodhpur, India.