HYBRID AUTOMATIC BUILDING INTERPRETATION SYSTEM
K. Pakzad a, *, A. Klink a, A. Müterthies a, G. Gröger b, V. Stroh b, L. Plümer b
a
EFTAS Fernerkundung Technologietransfer GmbH, 48145 Münster, Germany - (kian.pakzad, adrian.klink,
andreas.mueterthies)@eftas.com
b
Institute of Geodesy and Geoinformation, University of Bonn, Bonn, Germany – (groeger, stroh,
pluemer)@igg.uni-bonn.de
Commission III, WG III/4
KEY WORDS: Building, 3D City Model, Roof, Solar, Automatic
ABSTRACT:
HABIS (Hybrid Automatic Building Interpretation System) is a system for an automatic reconstruction of building roofs used in virtual 3D building models. Unlike most of the commercially available systems, HABIS is able to work to a high degree automatically. The hybrid method uses different sources intending to exploit the advantages of the particular sources. 3D point clouds usually provide good height and surface data, whereas spatial high resolution aerial images provide important information for edges and detail information for roof objects like dormers or chimneys. The cadastral data provide important basis information about the building ground plans.
The approach used in HABIS works with a multi-stage-process, which starts with a coarse roof classification based on 3D point clouds. After that it continues with an image based verification of these predicted roofs. In a further step a final classification and adjustment of the roofs is done. In addition some roof objects like dormers and chimneys are also extracted based on aerial images and added to the models. In this paper the used methods are described and some results are presented.
* Corresponding author. This is useful to know for communication with the appropriate person in cases with more than one author.
1. INTRODUCTION
Virtual 3D city models are applied for an increasing number of applications, like city planning, mobile phone simulations or the determination of the potential for the installation of solar panels on building roofs. For that reason more and more institutions and companies are interested in an efficient way of generating virtual 3D city models. Most of the commercially available tools for generating 3D buildings require many manual steps. A higher degree of automation during generation would increase the efficiency of this task and hence reduce the costs. A key issue within the reconstruction of buildings is the recognition of building roofs. The presented system HABIS focuses on this task.
HABIS (Hybrid Automatic Building Interpretation System) is a system for an automatic reconstruction of building roofs used in virtual 3D building models. Unlike most of the commercially available systems HABIS is able to work to a high degree automatically. The hybrid method uses different sources intending to exploit the advantages of the particular sources. 3D point clouds usually provide good height and surface data, whereas spatial high resolution aerial images provide important information for edges and detail information for roof objects like dormers or chimneys. The cadastral data provide important basis information about the building ground plans.
The methodology works with a multi-stage-process, which starts with a coarse roof model prediction and ends with a final reconstruction of the verified and adjusted roofs and an inclusion of additional roof objects like dormers and chimneys.
In this paper the methodology of the different interpretation steps will be described and some results will be shown. In section 2 HABIS will be described, beginning with a system
overview in 2.1 and a description of the input data in 2.2. In 2.3 to 2.8 the different steps of the methodology used in HABIS are explained and section 2.9 contains some results. Finally section 3 ends with a conclusion.
2. HABIS
In this section the methodology of HABIS will be described. After a system overview in section 2.1 the input data will be described in 2.2. Then the individual system components are described in chronological order in sections 2.3 to 2.8. At the end in section 2.9 some results are presented.
2.1 System Overview
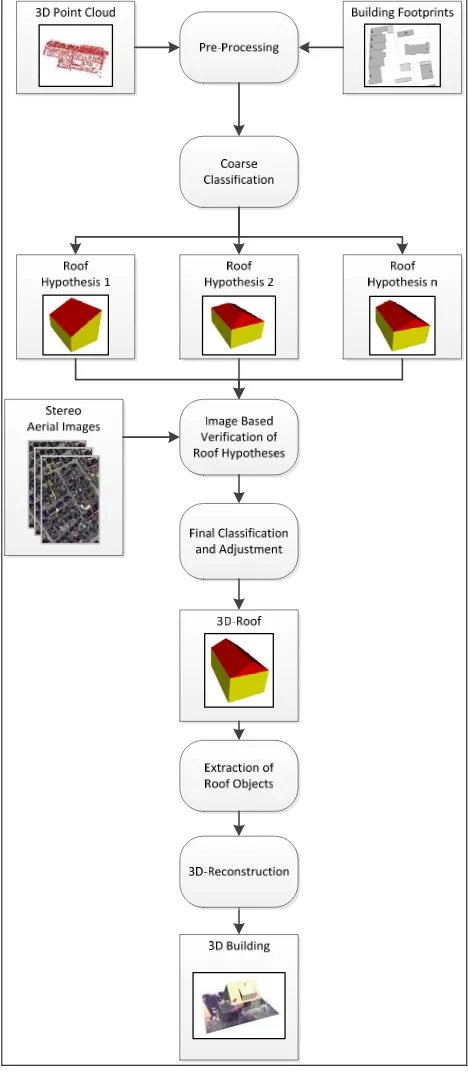
The approach works with a multi-stage-process, which starts with coarse models and improves them step by step as depicted in Figure 1. The method consists of different modules which have to exchange data between each other. As data storage and exchange platform HABIS uses a spatial database. In a pre-processing step the whole input data is preprocessed and imported into the database. Afterwards HABIS reconstructs all buildings successively. In the Coarse Classification Step the system creates different roof hypotheses per building part based on the imported 3D data. In the Image Based Verification Step these Roof Hypotheses are verified and rated by using the aerial images. In addition the Roof Hypotheses are also refined by spatial correction of the edges based on the optical data. In the third step the predicted models from the Coarse Classification including the ratings and the new found edges from Image Based Verification are used together to do a Final Classification
and Adjustment of the roofs in order to create the final roof models. After that in the Extraction of Roof Object Step additional chimneys and dormers are extracted on the roofs by the detection of edge and shape information, in order to refine the building models. Finally all these steps lead into the 3D-Reconstruction, in which the system creates buildings in specified output formats (e.g. CityGML).
Figure 1. System overview
2.2 Input Data
HABIS is working with two kinds of data: 3D point clouds as well as stereo aerial images. By using this independent kind of data HABIS is able to combine the advantage of having direct 3D-information of the scene with the optical information containing the accurate position of edges.
For the 3D points laser scanner data is used, optionally together with matching points derived from stereo images. As optical data RGB stereo aerial images with a ground pixel size of approximately 10 cm/pel are used. As additional data building ground plans from cadastral data sets are integrated as well as a DTM of the processed area.
2.3 Pre-processing
In the pre-processing step the input data (building footprints, 3D laser points, 3D matching points, digital terrain model) is imported into the database system. The building footprints are partitioned into rectangles using the method of (Kada, 2007). If no appropriate partition can be derived due to non rectangular angles, the bounding box (which is parallel to the main axes of the footprint) of the footprint is used. In the next step the 3D points (laser, matching points) are integrated into the data set by cutting this point set across the rectangles. The resulting 3D points are assigned to the corresponding rectangles in the data base. Methods provided by the spatial data base PostGIS (version 1.5) are used for the cut operation.
2.4 Coarse Classification Step
Since the method for classification and 3D reconstruction of roofs should yield satisfying results even if the data (laser points, matching points) is not dense, a model based approach is employed. This approach exploits prior knowledge about roofs – the symmetry of roofs or the fact that ridges are horizontal, for example. This prior knowledge is implemented in the following roof types, which are considered in our approach:
• flat roof • monopitch roof • gabled roof • hip roof • pyramid hip roof • saw tooth roof
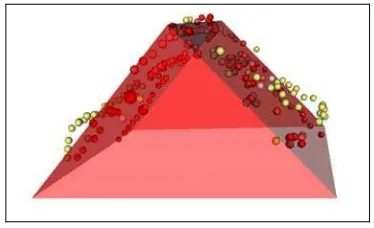
In order to estimate which of these models fits best to the 3D points observed for a rectangle, the well known RanSaC method (Fischler and Bolles, 1981) is used. We consider a point that deviates more than 0.3m from the model as outlier and particularly employ the MSAC (M-Estimator SAmple Consensus), see (Torr and Murray, 1997). This RanSaC variant considers outliers with a constant value (0.3m) instead of its actual distance to the model. As an example, Figure 2 shows inlier and outlier with regard to a gabled roof as the result of an application of MSAC. The output values of the MSAC are combined with a constant parameter denoting the complexity of the roof model, by applying model selection methods (Burnham and Anderson, 2010). For each rectangle R and for each roof type T a value is derived which indicates the probability that the roof of the rectangle clip R of the footprint has the roof type T.
Figure 2. Coarse classification step: Result of a RanSaC run for a gabled roof. Outlier are depicted in yellow and inlier in red
colour.
In parallel, methods from the field of supervised Machine Learning, particularly Support Vector Machines (Vapnik, 1998; Schölkopf and Smola, 2002) are applied to classify the roof type. These methods are based on manually classified sample data for roofs and on the derivation of features (area, height, roof declination ...) from the database or from RanSaC results. Both the Machine Learning results and the results from the model selection process are combined to a single rating for each pair consisting of rectangle and roof type. The concrete geometry of the roof models and the corresponding rating are transferred to the module Image Based Verification of Roof Hypotheses.
In some cases the availability and density of (laser scan or matching point) data is not sufficient for a reasonably reliable prediction of the roof type and for a 3D reconstruction of the roof. To obtain reasonably meaningful results even in those cases, the spatial context of a building, e.g. all buildings inside a buffer of 50 m centred at that building, is analyzed in order to derive the local probability of a roof type (and of a parameter value like the height).
2.5 Image Based Verification of Roof Hypotheses
This step starts with the roof hypotheses created in the coarse classification step. This step aims to achieve two goals: One is a rating of the different roof hypotheses based on the observations in the optical images in order to find out which model has the best match to the real roof. The other goal is to improve the spatial position of the predicted edges by using the observed edges in the optical images. Therefore this step affects both the roof classification as well as the spatial accuracy of the roof edges.
HABIS processes one building at a time. For every building an edge extraction is done within all perspectives which can be found in all stereo images. The extracted lines are filtered in a next step. The result is a set of lines with particular characteristics (see Fig. 3 at the top). They are the candidates for possible roof edges. After that the 2D lines within the different perspectives are transferred into 3D lines by using epipolar geometry. This huge number of possible edges has to be reduced by using plausibility considerations: All edges which are not plausible are cleared. At this processing point a set of 3D edges exists for every building and has to be compared with the 3D roof models created in the coarse classification step (see Fig. 3 at the middle).
In order to do this for every edge of a roof hypothesis, a possible corresponding edge from the observed edges is searched for in 3D space (see Fig. 3 at the bottom). Depending
on the existence of a corresponding edge and the distance to the predicted edges a common rating for every roof hypothesis is computed. Furthermore the selected corresponding edges are used to improve the spatial position of the roof edges. Both, the image based ratings and the observed edges are transferred to the next module described in section 2.6.
Figure 3. Steps within the Image Based Verification Step. Top: Processed building in one perspective and the roof based
edge extraction. Middle: The set of 3D edges after the first filtering. Bottom: The selected edges as the base of the image
based rating and the edge refinement.
2.6 Final Classification and Adjustment
The results produced by the Image Based Verification Step – a ranking of the models (in the following called image based ranking) and additional edges (with ratings) representing ridges or roof boundaries are further processed by the Final Classification and Adjustment module. The edges are converted to 3D points where the point density is derived from the point density of the present point cloud and the rating of that edge. These points are combined with the present point cloud and are the input of a second RanSaC/MSAC run. As in the coarse classification step, the result of the refined run is processed by model selection methods, machine learning methods are applied and again two ratings are derived. Both are combined linearly with the image based rating, yielding the final classification result, i.e. the most probable roof model for each rectangle. These roofs, which are derived by the RanSaC/MSAC estimator, are adjusted with regard to neighbouring roofs. For example, if the deviations of the ridges and declinations of two neighbouring gabled roofs are below a certain threshold, both the ridges and the declination are equalized. The geometries of the most probable adjusted roofs are transferred to the next module Extraction of Roof Objects.
2.7 Extraction of Roof Objects
After the correct classification and adjustment of the building roofs, in this step the extraction of roofs assemblies on the found building roofs is done. In the following the extraction of dormers and chimneys is described.
2.7.1 Dormers
At the moment two kinds of dormers can be detected: Shed dormers and triangle dormers. The reason for the division into these two basic shapes is that they are good observable and separable by using only few edges.
Again the first step is an edge extraction within the previously detected roof areas (see Fig. 4 at the top). After the edge extraction an initial filtering is done. Hence only a subset of the edges is used as potential dormer candidates. Based on the possible combinations of the edges within the different perspectives the 2D edges are transferred into 3D edges by using epipolar geometry. Again, after this step another filtering of the edges is applied in 3D by using plausibility checks (see Fig. 4 at the middle). The remaining 3D edges are now used for the search for dormers. This search was done model based. Within the 3D space the system searches for a set of characteristic edges with particular constraints. These constraints affect both the position of the edges to the roof ridge and also the relative position of the edges to each other. Because the position of the edges has a certain inaccuracy at this processing step a buffer for the spatial neighbourhood has to be used. If a set of edges being characteristic for a certain dormer type was found, the particular dormer type is presumed to be classified. In some cases the procedure completes some missing 3D edges if the classification as one of both dormer types can be done with high possibility in spite of the missing edge.
After the detection of the dormers an adjustment of the dormer edges is done in order to obtain edges with direct connections to each other, correct angles to the roof edges (e.g. the ridge) and correct edge symmetry (see Fig. 4 at the bottom).
Figure 4. Steps within the Extraction of Roof Dormers. Top: Processed building in one perspective and the dormer
based edge extraction. Middle: The set of 3D edges as candidates for dormer edges. Bottom: The selected dormer
edges after the adjustment.
2.7.2 Chimneys
A matching based approach is used for the detection of chimneys. Within the roof area all image objects representing a rectangle with a specified size range are extracted (see Fig. 5 at the top). Afterwards corresponding matches between different perspectives are transferred into the 3D space and checked for plausibility. The method uses different geometric features including the centre of the chimney as well as its borders. Unrealistic matches are ignored. Afterwards the resulting top area polygon is verified, adjusted and extruded onto the roof to create a volumetric 3D chimney (see Fig. 5 at the bottom).
Figure 5. Steps within Extraction of chimneys. Top: Processed building in one perspective and the extracted
chimney candidates (green: good candidates). Bottom: The selected and extrudes chimney.
2.8 3D Reconstruction
In the last step, the geometries of the roofs derived by the detailed classification step are reconstructed. The footprint height is derived from the digital terrain model by using interpolation methods. In addition, dormers and chimneys which are provided by the module extraction of roof objects are included. Furthermore, roof overhangs which are derived from the edges that represent the roof boundary are added. The reconstructed buildings are geometrically more comprehensive than level-of-detail 2 (LoD2) buildings according to the CityGML specification (Gröger et al., 2008), since dormers and chimneys are not covered by LoD2. Output formats are
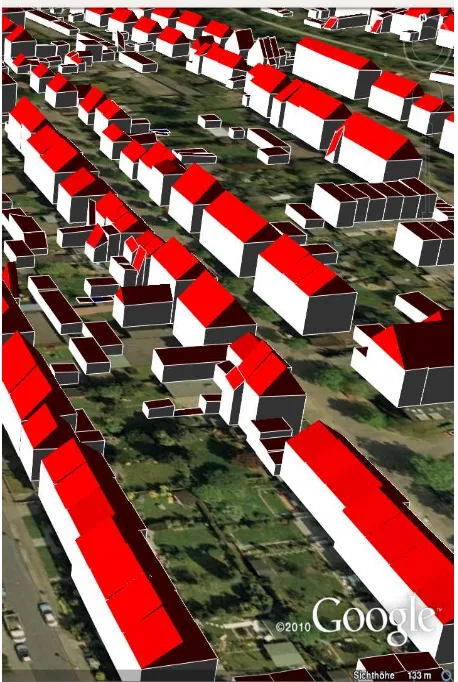
CityGML, KML as well as PostGIS geometry. Fig. 6 depicts an example KML LoD2 output file visualized in Google Earth.
2.9 Classification Results
First results of the HABIS prototype have been evaluated by statistical methods. In the study a data set consisting of approximately 4800 buildings from the cities of Münster and Bonn in Germany was used. The roof types have been classified manually. The mean density of the laser points was 1 point per m². The classification accuracy of the HABIS prototype was derived based on 10-fold cross-validation (Alpaydin, 2004). For the classification of flat/monopitch versus gabled/hip/pyramid hip roofs, the accuracy is above 95%. Gabled versus hip/pyramid hip roofs can be classified with an accuracy of 97%.
Figure 6. Example LoD2 KML file derived by HABIS and visualized in Google Earth
3. CONCLUSIONS
In this paper the methods used in HABIS were presented. The hybrid approach of HABIS combines the advantages of the different kinds of data: 3D points as well as optical data. The multi-stage-process is a returning change between creating of hypotheses based on one kind of data and the verification of them based on the other kind. During the process step by step the correct roof type per building, the spatial positions of the edges and some roof assemblies are created. At the end the
buildings are exported into CityGML, KML and PostGIS geometry. Our approach enables a higher degree of automation in the creation process of 3D buildings compared to current systems which are commercially available.
Currently HABIS is tested on large test areas in order to improve the stability and performance. For the future an extension of the used roof and dormer types is intended. Furthermore the included a priori and context knowledge will be enlarged.
4. REFERENCES
Alpaydin, E., 2004. Introduction to machine learning. MIT Press, Cambridge, Mass.
Burnham, K.P., Anderson, D.R., 2010. Model Selection and Multimodel Inference. A practical information-theoretic approach, 2. ed., 4. printing. Springer, New York.
Fischler, M.A., Bolles, R.C., 1981. Random sample consensus: a paradigm for model fitting with applications to image analysis and automated cartography. Communications of the ACM 24 (6), pp. 381–395.
Gröger, G., Kolbe, T.H., Czerwinski, A., Nagel, C., 2008. OpenGIS City Geography Markup Language (CityGML)
Encoding Standard. Version 1.0.0., Open Geospatial
Consortium, OGC Doc. No. 08-007r1.
Kada, M., 2007. Scale-Dependent Simplification of 3D Building Models Based on Cell Decomposition and Primitive Instancing. In: Winter, S., Duckham, M., Kulik, L., Kuipers, B. (Eds.), Spatial information theory. 8th international conference, COSIT 2007, Melbourne, Australia, September 19 - 23, 2007 ; proceedings. Springer, Berlin, Heidelberg, pp. 222–237.
Schölkopf, B., Smola, A.J., 2002. Learning with Kernels - Support Vector Machines, Regularization, Optimization and Beyond. MIT Press, Cambridge.
Torr, P.H.S., Murray, D.W., 1997. The development and comparison of robust methods for estimating the fundamental matrix. International J. of Computer Vision 24 (3), pp. 271– 300.
Vapnik, V.N., 1998. Statistical learning theory. Wiley, New York.
5. ACKNOWLEDGEMENTS
HABIS was developed within a cooperation project between EFTAS and the Institute of Geodesy and Geoinformation, University of Bonn, and was founded by the “Federal Ministry of Economics and Technology” within the Central Innovation Programme (ZIM) under grant KF2214701SS9.