ASSESSMENT OF SOIL DEGRADATION IN THE NORTHERN PART OF NILE
DELTA, EGYPT USING REMOTE SENSING AND GIS TECHNIQUES
A. H. El Nahrya M. M,.Ibraheim,b and A. A.El Baroudy b a
National Authority for Remote Sensing and Space Sciences (NARSS),Cairo, Egypt b
Soils and Water Department, Faculty of Agriculture, Tanta University, Tanta, Egypt.
Key words: North Nile Delta, physical degradation, chemical degradation, Remote Sensing and GIS.
ABSTRACT
The present work aims at monitoring soil degradation process within the last two decades in the northern part of Nile Delta .The investigated area lies between longitudes 31o 00- & 31 o 15- E and latitudes 31o 00' & 31 o 37' N., covering an area of about 161760 feddans. Detecting soil degradation and recognizing its various types is a necessity to take the practical measures for combating it as well as conserving and keeping the agricultural soil healthy. Land degradation was assessed by adopting new approach through the integration of GLASOD/FAO approach and Remote Sensing / GIS techniques .The main types of human induced soil degradation that observed in the studied area are salinity, alkalinity (sodicity), compaction and water logging .On the other hand water erosion because of sea rise is assessed. The obtained data showed that, areas that were affected by compaction increment have been spatially enlarged by 40.9 % and those affected by compaction decrease have been spatially reduced by 22.6 % of the total area ,meanwhile areas that have been unchanged were estimated by 36.5% of the total area. The areas that were affected by water logging increase have been spatially enlarged by 52.2 % and those affected by water logging decrease have been spatially reduced by 10.1 % of the total area, meanwhile the areas which have been unchanged were represented by 37.7 % of the total area. Areas that were affected by salinity increase have been spatially enlarged by 31.4 % of the total area and those affected by salinity decrease have been reduced by 43.3 % of the total area. An area represented by 25.2 % of the total area has been unchanged. Alkalinization (sodicity) was expressed by the exchangeable sodium percentage (ESP).Areas that were affected by sodicity increase have been spatially enlarged by 33.7 %, meanwhile those affected by sodicity decrease have been spatially reduced by 33.6 % of the total area. An area represented by 32.6 % of the total area has been unchanged. Multi-dates satellite data from Landsat TM & ETM+ images dated 1983 and 2003 were used to detect the changes of shoreline during the last two decades. The obtained results showed that, the eroded areas were determined by 547.4 feddans , meanwhile the accreted areas were detected by 476.5 feddans during the twenty years period.
1-INTRODUCTION
From an agricultural perspective, land degradation has been defined as reduction in the soil capacity to produce crops or biomass for livestock. From an ecological perspective, land degradation can be seen as damage to the healthy functioning of land-based ecosystems. The problem of soil degradation has been drastically accentuated by changes in land use since the 18th century, (Richards, 1991 and Williams,1991). Land degradation in Egypt is a serious problem and far-reaching in terms of the affected areas and the number of people who suffer the consequences.The main types of land degradation identified in Egypt are salinity, sodicity, compaction and water logging as well as water erosion as a result of Mediterranean sea level rise. These types of land degradation were identified throughout the current study. The main objective of this study is to monitor physical, chemical and natural land degradation, within the previous two decades in the northern part of Nile Delta, through using new approach of land degradation assessment. This approach was adopted through integration of GLSOD/FAO approach (traditional
method) and Remote Sensing and GIS techniques (advanced approach).
2-MATERIALS AND METHODS
2.1. Location of the study area:
The studied area is located in the northern part of Nile delta, Egypt, longitudes 31o 00- & 31 o 15- E and latitudes 31 o00 - & 31 o 37- N. It is bounded by the Mediterranean sea at the north, Gharbia Governorate at the south, Dakahlia Governorate at the east and Sidi Salem and kafr El Sheikh Districts at the west (Figure1), with a total area of 344584.01 feddans (feddan = 4200 m2).
2.2. Digital image processing
Fig. (1) Location of the studied area
rectification and sub-setting.2-Enhancing the ground resolution from 30 m to 15m, fusion methodology was applied according to Ranchin and Wald, (2000).
2.3. Field studies
A rapid reconnaissance survey was made throughout the investigated area in order to identify the major landforms and gain an appreciation of the broad soil patterns and landscape characteristic. The primary mapping units were verified based on the pre-field interpretation and the information gained during the reconnaissance survey. Forty three soil profiles were dug (13 in coastal plain,7 in fuvio-marine plain and 23 in flood plain) to fulfill the requirements of the digital soil mapping. A detailed morphological description of soil profiles were noted based on the basis outlined by FAO (1990).
2.4. Laboratory analysis
2.4.1. Physical analyses:
Soil color (wet & dry) was identified with the aid of Munssel color charts, Soil Survey Staff (1951), Particle size distribution was determined due to Rowell (1995) and bulk density by paraffin wax method, (Soil Laboratory Staff, 1984)
2.4.2. Chemical analyses: Electric conductivity (EC),
soluble cations and anions, CaCO3 %, O.M % , Gypsum content , Cation exchange capacity (CEC), exchangeable cations and pH were determined according to Rowell (1995).
2.5. Type and degree of land degradation
FAO criteria were used to determine the degree, class and rate of different types belonging to land degradation, FAO/UNEP (1978).
2.6. Spatial Land Degradation Process Model (SLDPM).
Spatial Land Degradation Process Model (SLDPM) was designed as a new approach, through integration of GLASOD/FAO approach and remote sensing & GIS techniques (El-Baroudy, 2005) to assess land degradation status during the period of 1981 and 2005. This part of study based on comparing between the data obtained from Abo Zeid (1981), Mahmoud (1982), El-Sokary
(1983) and Mansour (1983), and the data of this study carried out in the year 2005.
2.7. Maps production
Arc Map 9.2 (ESRI, 2006) was used to display and produce the intermediate and final thematic maps.
2.8. Change detection
Change detection of the shoreline during the period of 1983 and 2003 was assessed by ENVI 4.3 software
3-RESULTS AND DISCUSSION
3.1. Geomorphology of the investigated area
According to El-Baroudy (2005), three main landscapes could be identified I) the coastal plain, II) the fluvio-marine plain and III) the flood plain. According to relief ,these landscapes have been divided into seven landforms i.e. sand flats (low , moderately , moderately high and high sand flats), sand sheets (low, moderately low, moderately and high sand sheets), depressions , man-made terraces (low , moderately and high man-man-made terraces), recent river terraces (low , moderately , moderately high recent river terraces and high recent river terraces ), decantation basins (low , moderately low, moderately , moderately high and high decantation basins), overflow basins (low , moderately low , moderately , moderately high and high overflow basins )
3.2. Soils of the investigated area
site to another due to fine fraction and organic matter content, where it ranges between 5.72 and 10.63 meq/ 100g soil in the coastal plain ,it ranges between 36.42 and 54.28 meq/ 100g soil in the fluvio-marine plain and it ranges between 38.79 and 58.4 meq/ 100g soil in flood plain. Exchangeable sodium percentage ranges between 5.22 and 19.56 in the coastal plain soils, it ranges between 6.18 and 28.59 in the fluvio-marine plain soils and it ranges between 4.71 and 35.93 % in the flood plain soils. Gypsum content ranges between 0.07 and 1.19 % in the coastal plain soils. It ranges between 0.96 and 8.15 % in the fluvio-marine plain soils, meanwhile it ranges between 0.21 and 9.68 % in the flood plain soils.Soils of the study area could be classified into Typic Torrifluvents, Vertic Torrifluvents, Aquic Torrifluvents, Vertic Natrargids, Typic Natrargids, Vertic Natrigypsids, Gypsic Haplosalids, Calcic Haplosalids Aquic Torripsamments, Typic Torripsamments(Soil Survey Staff, (1999).
3.3. Land degradation
3.3.1. Types of land degradation
The dominant causative factors of the different types of land degradation were identified in the field and also collected from the available technical reports. The main types of human induced land degradation in the investigated areas are salinization, alkalinization, soil compaction and water logging as well as water erosion. Those degradation variables were assessed showing the changes that happened during the period of 1981 and 2005 for human induced land degradation using the designed Spatial Land Degradation Process Model (SLDPM) and during the period of 1983 and 2003 for shoreline erosion and accretion using multi-dates satellite images.
3.3.2. SLDPM
SLDPM attempts to describe the interaction of the inputs i.e. salinity, alkalinity, water logging and compaction for soil degradation map production. Since there are many different types of interactions between objects, SLDPM used to describe processes, as well as predicting what happened when some action occurs. SLDPM as process model simply designed as possible to capture the necessary reality to solve the spatial problem of soil degradation in the investigated area. The model process could be summarized as follows:-1 converting vector layers of the two date’s variables (1981 and 2005) to raster data sets.2- Reclassifying data sets to common scale.3 Weighting& influencing data sets 4. Combining & overlaying datasets.5. Producing soil degradation raster map. Variables represented by salinity, alkalinity, water logging and soil compaction were studied on the landscape level. Figure (2) shows the flowchart of SLDPM
3.3.2.1. Salinity variable
Change detection of salt-affected areas could be
illustrated in Figure (3). These changes were summarized as follows: The total investigated area was determined by 344584.01 feddans of which 108326.29 feddans affected
by salinity increase have been spatially enlarged by 31.44% of the total area. Increment of salinity may be due to intrusion of sea water and seepage from the adjacent fish ponds that supplied with low water quality, in addition to improper drainage system. An area of 149360.05 feddans affected by salinity decrease have been spatially reduced by 43.34 % of the total area. Decreasing of salinity refers to leaching processes and improving the actual drainage system. An area of 86897.67 feddans represented by 25.22 % of the total area have been unchanged
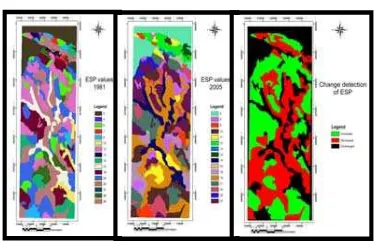
3.3.2.2. Alkalinity variable
Change detection of sodicity-affected areas could be illustrated in Figure (4). These changes were summarized as follows: The total investigated area was determined by 344584.01 feddans of which 116331.58 feddans affected by sodicity increase have been spatially enlarged by 33.76 % of the total area. This increment may be due to improper management (using brackish water) . An area of 115918.05 feddans affected by sodicity decrease have been spatially reduced by 33.64 % of the total area. Decreasing of sodicity level may be due to adding soil amendments. An area of 112334.38 feddans represented by 32.60 % of the total area have been unchanged. The human induced salinization and alkalinization in the studied area can be result of three causes; firstly, it can be the result of poor management of irrigation schemes. Secondly, salinization and or alkalinization will occur if a sea water or fossil saline ground water body intrudes the ground water reserves of good quality. A third type occurs where human activities lead to an increase in evapo-transpiration of soil moisture in areas of high salt-containing parent materials or with saline ground water.
Figure (3) Spatial variability of EC
3.3.2.3. Compaction variable
Compaction in the current work is expressed by bulk density (g/cm3) Change detection of the compaction affected areas could be illustrated in Figure (5). These changes were summarized as follows: The total investigated area was determined by 344584.01 feddans of which 140985.19 feddans affected by compaction increase have been spatially enlarged by 40.91% of the total area. This increment may be due to improper management, improperly timed use of heavy machinery. An area of 77954.66 feddans affected by compaction decrease have been spatially reduced by 22.62 % of the total area. This decreased owing to adding organic manures and soil tillage practices. An area of 125644.16 feddans represented by 36.46 % of the total area have been unchanged.In the studied areas soil compaction was resulted from improperly timed use of heavy machinery, misuse of irrigation, absence of conservation measurements, shortening of the fallow period and the excessive fertilizers.
Figure (5) Spatial variability of bulk density
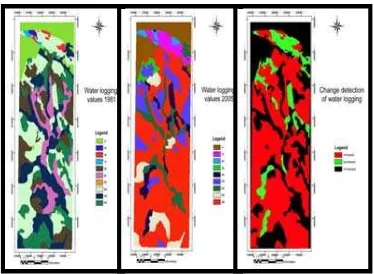
3.3.2.4. Water logging variable
Water logging in the current work is expressed by water table level Overall changes in water table affected areas that detected using multi dates satellite images could be illustrated in Figure (6). These changes were summarized as follows: The total investigated area was determined by 344584.01 feddans of which 179887.09 feddans affected by water logging increase have been spatially enlarged by 52.20 % of the total area. Over irrigation, insufficient drainages and destruction of subsurface drainage networks are the main causes of water logging in the studied areas. An area of 34966.14 feddans affected by water logging decrease have been spatially reduced by 10.15 % of the total area. An area of 129730.78 feddans represented by 37.65 % of the total area have been unchanged. Over irrigation, insufficient drainages and destruction of subsurface drainage networks are the main causes of water logging in the studied areas.
Figure (6) spatial variability of water logging
Land degradation assessment
Four degradation classes resulted from land degradation model could be noted as follows:-None degraded class. This class occupies an area of about 222592.52 feddan representing 61.1% of the total area.2- Slightly degraded class. This class occupies an area of about 102742.28 feddan representing 28.19% of the total area.3-Moderately degraded class. This class occupies an area of about 33696.29 feddan representing 9.25% of the total area.4- Highly degraded class. This class occupies an area of about 5335.76 feddan representing 1.46% of the total area.Figure (7) shows soil degradation classes.
3.3.3.Water erosion
Fig.(7): Degradation classes map
The average rates of erosion and accretion were -11.64 m yr-1 and +5.12 m yr-1, respectively (Ali, 2004). Losses in Abu_Qir gulf as a result of both sea rise and the current action are ranging between 253.7 and 318.9 feddans in eight years during the period of 1990-1998,(El Nahry,2001).In the current work multi-dates satellite TM & ETM+ images dated to years 1983 and 2003 respectively were used to detect the changes of shoreline during the last two decades. The obtained results showed that, the eroded areas were determined by 547.4 feddans meanwhile the accreted areas was detected by 476.5 feddans during the twenty years period .
4.CONCLUSION
Soil improvement program could be summarizes as follows:
The drainage of topsoil can be improved by adding organic matter, or by adding materials such as lime or gypsum that cause
fine clay particles to “flocculate” or stick together into sand sized multi-particles. Aeration can be improved by sub-soil ploughing and adding organic materials like compost. There are four strategies commonly used in dealing with compaction; 1) avoidance, 2) alleviation, 3) controlled traffic, and 4) acceptance. Avoidance is the most desirable where it is physically and economically possible. Alleviation. There are two ways of alleviating and lessening the damage caused by compaction, 1.) Attempt to remove the compaction causes or 2.) Attempt to reduce the adverse effects of the compaction by applying fertilizer in a way that increases the availability. The philosophy behind controlled traffic is to restrict the amount of soil traveled on by using the same wheel tracks. By controlling traffic, the tracked area will have a slightly deeper compaction but the soil between the tracks
will not be compacted. Acceptance is waiting for the detrimental effects to be removed by natural forces. Salinity control is defined as the physical control, management, and use of water and related land resources in such a way as to maintain or reduce salt loading and concentrations of salt in water supplies. To control Sodicity, Gypsum addition considering gypsum requirement is urgent after leaching processing Finally water erosion can be controlled by establishing sea barriers and sea walls that made of concrete.
5- REFERENCES
Abo Zeid,W.A. ,1981. Physical and chemical changes accompanying soil reclamation in the Northern Delta, Egypt. Ph.D. Thesis, Fac. of Agric., Cairo Univ., Egypt.
Ali,M.H.,2004. Monitoring coastal changes in the Nile delta of Egypt using SAR interferometry. 2004 Denver Annual Meeting (November 7–10, 2004) Texas A&M Univ Paper No. 123-15
El-Baroudy,A.A.,2005. Using Remote Sensing and GIS techniques for monitoring land degradation in some areas of Nile delta. Ph.D. Thesis, Fac. Of Agric., Tanta, Tanta Univ.,Egypt.
El Nahry,A.H.,2001. An approach for sustainable landuse studies of some areas in Northwest Nile Delta, Egypt. Ph.D. Thesis, Fac. of Agric.,Soil dept. Cairo, Univ.,Egypt.
El-Sokary,S.S. ,1983. Soil Morphology and taxonomy of some sandy soils in Egypt. Ph.D.Thesis, Fac.of Agric., Cairo Univ., Egypt.
ESRI, ,2006. ArcMap version 9.2 user manual. Redlands, CA, USA.
FAO/UNEP ,1978. Methodology for assessing soil degradation. Rome, 2527 January 1978 Italy.
FAO, 1990. Guidelines for soil profile description. 3rd edition (Revised), FAO, Rome.
Mahmoud,A.M. ,1982. Identification of some structural parameters in the Burullus area. M.Sc.Thesis, Fac. of Agric., Cairo Univ., Egypt.
Mansour,A.M. ,1983. Pedological studies and mapping of some soils in the Northern area of the Nile Delta, Egypt. Ph.D.Thesis, Fac. of Agric., Cairo Univ., Egypt.
Owino, J. O., Owido, M S.and Chemelil, F.C.,2006. Soil loss in runoff from a clay loam soil protected by narrow grass strips J. of World Association of Soil and Water Conservation,1:1-13.
Ranchin T. and Wald L. ,2000 - Comparison of different algorithms for the improvement of the spatial resolution of images. Proceeding of the third conference "Fusion of Earth data: merging point measurements, raster maps and remotely sensed images", Sophia Antipolis, France, pp. 33-41.
Rowell ,D.L. ,1995. “ Soil Science Methods & Applications” Library of Congress Cataloging- in-Publication data. New York, NY 10158. U.S.A.
ITT Industries Inc., 2006. ENVI 4.3 user manual. Inc., 4990 Pearl East Circle,Boulder, CO 80301 USA.
Soil Laboratory Staff ,1984. Analytical methods of the service laboratory for soil, plant, and water analysis Part 1: methods for soils analysis , Royal Tropical Institute , 63 Mauristskade ,Amsterdam.
Soil Survey Staff, 1951. “Soil Survey Manual” U.S. Dept. Agric., Hand book, No. 18. Government printing office, Washington, D.C.
Soil Survey Staff, 1999. “Soil Taxonomy”. A basic system of soil classification for making and interpreting surveys, Second edition, Agriculture Hand Book No. 436.U.S.D.A., Nat. Res. Cons. Service.